


Posts by AltonParrish:
A sneak peek into the mist of futuristic 3D fog screen
April 14th, 2014By Alton Parrish.
A tabletop display with personal screens made from a curtain of mist that allow users to move images around and push through the fog-screens and onto the display, will be unveiled at an international conference later this month.
MisTable supports different types of 3D interaction

Image courtesy of Bristol Interaction and Graphics group, University of Bristol
The research paper, to be presented at one of the world’s most important conferences on human-computerinterfaces – ACM CHI 2014 [26 April-1 May], could change the way people interact and collaborate in the future.
MisTable, led by Professor Sriram Subramanian and Dr Diego Martinez Plasencia from the University ofBristol’s Department of Computer Science, is a tabletop system that combines a conventional interactive table with personal screens, built using fog, between the user and the tabletop surface.
These personal screens are both see-through and reach-through. The see-through feature provides direct line of sight of the personal screen and the elements behind it on the tabletop. The reach-through feature allows the user to switch from interacting with the personal screen to reaching through it to interact with the tabletop or the space above it.
The personal screen allows a range of customisations and novel interactions such as presenting 2D personal content on the screen, 3D content above the tabletop or supplementing and renewing actual objects differently for each user.
Sriram Subramanian, Professor of Human-Computer Interaction, in the University’s Bristol Interaction and Graphics group, said: “MisTable broadens the potential of conventional tables in many novel and unique ways. The personal screen provides direct line of sight and access to the different interaction spaces. Users can be aware of each other’s actions and can easily switch between interacting with the personal screen to the tabletop surface or the interaction section. This allows users to break in or out of shared tasks and switch between “individual” and “group” work.
“Users can also move content freely between these interaction spaces. Moving content between the tabletop and the personal screen allow users to share it with others or to get exclusive ownership over it. The research team believe MisTable could support new forms of interaction and collaboration in the future.”
With the new system, having personal screens for each user allows the view of each of the users to be customised to them, as well as maintaining all well-established tabletop interface techniques like touch and tangible interactions.
Comments Off on A sneak peek into the mist of futuristic 3D fog screen
Why are night shinning clouds increasing?
April 11th, 2014By Alton Parrish.
First spotted in 1885, silvery blue clouds sometimes hover in the night sky near the poles, appearing to give off their own glowing light. Known as noctilucent clouds, this phenomenon began to be sighted at lower and lower latitudes — between the 40th and 50th parallel — during the 20th century, causing scientists to wonder if the region these clouds inhabit had indeed changed — information that would tie in with understanding the weather and climate of all Earth.
Night-shining, or noctilucent clouds on July 3, 2011, in Lock Leven, Fife, Scotland.

Image Credit: Courtesy of Adrian Maricic
A NASA mission called Aeronomy of Ice in the Mesosphere, or AIM, was launched in 2007 to observe noctilucent clouds, but it currently only has a view of the clouds near the poles. Now scientists have gathered information from several other missions, past and present, and combined it with computer simulations to systematically show that the presence of these bright shining clouds have indeed increased in areas between 40 and 50 degrees north latitude, a region which covers the northern third of the United Sates and the lowest parts of Canada. The research was published online in the Journal of Geophysical Research: Atmospheres on March 18, 2014.
NASA’s Aeronomy of Ice in the Mesosphere, or AIM, mission captured this image of noctilucent clouds over the poles in 2010. By compiling data from several missions at once, researchers have now created a record of the clouds at lower latitudes as well.

Image Credit: NASA/AIM
The team tested the model by comparing its output to observations from the Osiris instrument on the Swedish Odin satellite, which launched in 2001, and the SHIMMER instrument on the U.S. Department of Defense STPSat-1 mission, both of which observed low level noctilucent clouds over various time periods during their flights. The output correlated extremely well to the actual observations, giving the team confidence in theirmodel.
The model showed that the occurrence of noctilucent clouds had indeed increased from 2002 to 2011. These changes correlate to a decrease in temperature at the peak height where noctilucent clouds exist in the atmosphere. Temperatures at this height do not match temperatures at lower levels – indeed, the coldest place in the atmosphere is at this height during summertime over the poles – but a change there certainly does raise questions about change in the overall climate system.
Russell and his team will research further to determine if the noctilucent cloud frequency increase and accompanying temperature decrease over the 10 years could be due to a reduction in the sun’s energy and heat, which naturally occurred as the solar output went from solar maximum in 2002 to solar minimum in 2009.
“As the sun goes to solar minimum, the solar heating of the atmosphere decreases, and a cooling trend would be expected,” said Russell.
NASA’s Goddard Space Flight Center in Greenbelt, Md. manages the TIMED mission for the agency’s Science Mission Directorate at NASA Headquarters in Washington. The spacecraft was built by the Johns HopkinsUniversity Applied Physics Laboratory in Laurel, Md.
Comments Off on Why are night shinning clouds increasing?
Green tea boost the brain
April 9th, 2014By Alton Parrish.

Credit: Kanko from Nagasaki, Japan
Better memory
In a new study, the researcher teams of Prof. Christoph Beglinger from the University Hospital of Basel and Prof. Stefan Borgwardt from the Psychiatric University Clinics found that green tea extract increases the brain’s effective connectivity, meaning the causal influence that one brain area exerts over another. This effect on connectivity also led to improvement in actual cognitive performance: Subjects tested significantly better for working memory tasks after the admission of green tea extract.
For the study healthy male volunteers received a soft drink containing several grams of green tea extractbefore they solved working memory tasks. The scientists then analyzed how this affected the brain activity of the men using magnetic resonance imaging (MRI). The MRI showed increased connectivity between the parietal and the frontal cortex of the brain. These neuronal findings correlated positively with improvement in task performance of the participants. “Our findings suggest that green tea might increase the short-term synaptic plasticity of the brain,” says Borgwardt.
Clinical implications
The research results suggest promising clinical implications: Modeling effective connectivity among frontal and parietal brain regions during working memory processing might help to assess the efficacy of green tea for the treatment of cognitive impairments in neuropsychiatric disorders such as dementia.
Comments Off on Green tea boost the brain
Loneliness affects DNA
April 6th, 2014By Denise Aydinonat.

Credit: Denise Aydinonat
Using molecular genetics to assess exposure to stress
To test whether social isolation accelerates telomere shortening, Denise Aydinonat, a doctorate student at the Vetmeduni Vienna, conducted a study using DNA samples that she collected from African grey parrots during routine check-ups.
Reading signs of stress by erosion of DNA
“Studies on humans suggest that people who have experienced high levels of social stress and deprivation have shorter telomeres,” says Dustin Penn from the Konrad Lorenz Institute of Ethology at the Vetmeduni Vienna. “But this study is the first to examine the effects of social isolation on telomere length in any species.”
Co-author, Franz Schwarzenberger from the Department of Biomedical Sciences at the Vetmeduni Vienna, points out that their results are exciting because they suggest, “telomere length may be useful as a ‘biomarker’ that enables to assess an individual’s exposure to chronic social stress.”
Comments Off on Loneliness affects DNA
Dress and behavior of mass shooters as factors to predict and prevent future attacks
April 6th, 2014By Alton Parrish.

In the article “Costuming, Misogyny, and Objectification as Risk Factors in Targeted Violence,” Brian Van Brunt, EdD and W. Scott Lewis, The NCHERM Group, LLC (Malvern, PA), suggest reasons why persons who commit mass shootings are drawn to dark popular culture imagery, how these cultural factors may contribute to the violence, and what risk factors could be useful to law enforcement and behavioral investigation teams seeking to identify individuals who might be preparing for an attack.
“‘Objectification’ of victims and ‘costuming’ are specific offender behaviors that will give threat assessment teams throughout the world greater insights into the motivation of mass shooters and just how ceremonial their preparations are,” says Mary Ellen O’Toole, PhD, Editor-in-Chief of Violence and Gender and Senior FBI Profiler/Criminal Investigative Analyst (ret.). “The value of this information in being able to identify these offenders beforehand based on their behavior so that we can prevent future acts of mass murder is very significant.”
Violence and Gender is the only peer-reviewed journal focusing on the understanding, prediction, and prevention of acts of violence. Through research papers, roundtable discussions, case studies, and other original content, the Journal critically examines biological, genetic, behavioral, psychological, racial, ethnic, and cultural factors as they relate to the gender of perpetrators of violence. Led by Editor-in-Chief Mary Ellen O’Toole, PhD, Forensic Behavioral Consultant and Senior FBI Profiler/Criminal Investigative Analyst (ret.), Violence and Gender explores the difficult issues that are vital to threat assessment and prevention of the epidemic of violence. Violence and Gender is published quarterly online with Open Access options and in print, and is the official journal of The Avielle Foundation.
Comments Off on Dress and behavior of mass shooters as factors to predict and prevent future attacks
Regolith of small asteroids formed by thermal fatigue
April 3rd, 2014By Alton Parrish.
Previous studies suggested that the regolith of asteroids one kilometer wide and smaller was made from material falling to the surface after impacts and from boulders that were pulverized by micrometeoroid impacts. Recent laboratory experiments and impact modeling conducted by a team of researchers from Observatoire de la Côte d’Azur, Hopkins Extreme Materials Institute at Johns Hopkins University, Institut Supérieur de l’Aéronautique et de l’Espace and Southwest Research Institute (SwRI) have shown that the debris from large impacts reaches escape velocities and breaks free from the gravitational pull of these asteroids, indicating this mechanism is not the dominant process for regolith creation.
This picture of Eros, the first of an asteroid taken from an orbiting spacecraft, is a mosaic of four images obtained by NASA’s NEAR mission immediately after the spacecraft’s insertion into orbit.
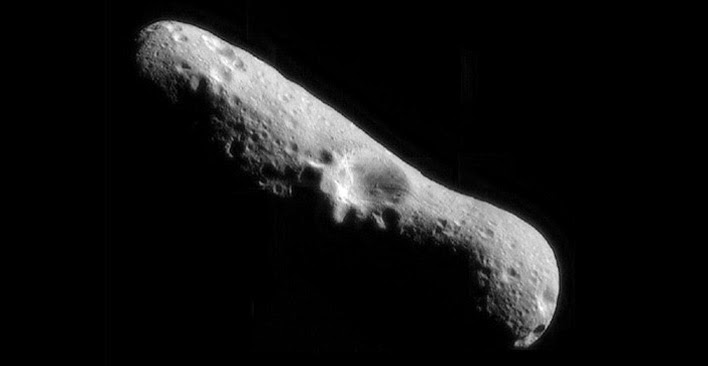
The team’s research showed that thermal fragmentation, which is induced by mechanical stresses caused by temperature variations of the rapidly spinning asteroid’s short night and day, to be the process primarily responsible for breaking up rocks larger than a few centimeters on asteroids.
“We took meteorites as the best analog of asteroid surface materials that we have on the Earth,” said Dr. Marco Delbo of the Observatoire de la Côte d’Azur. “We then submitted these meteorites to temperature cycles similar to those that rocks experience on the surfaces of near-Earth asteroids and we found that microcracks grow inside these meteorites quickly enough to entirely break them on timescales much shorter than the typical lifetime of asteroids.”
Model extrapolation of these experiments also showed that thermal fragmentation caused rocks to break down an order of magnitude faster than from micrometeoroid impacts, particularly at distances of 1 astronomical unit (about 93 million miles) with the speed of breakdown slowing at distances further from the Sun.
“Even asteroids significantly farther from the Sun showed thermal fatigue fragmentation to be a more relevant process for rock breakup than micrometeoroid impacts,” said Dr. Simone Marchi, a scientist in the SwRI Space Science and Engineering Division.
The results of this study suggest that thermal fragmentation, combined with solar radiation pressures that sweep away surface particles, could completely erode small asteroids at distances closer to the Sun (about 28 million miles) in about 2 million years.
The French Agence National de la Recherche SHOCKS, BQR of the Observatoire de la Côte d’Azur, the University of Nice-Sophia Antipolis, the Laboratory GeoZur, the French National Program of Planetology, and NASA’s Solar System Exploration Research Virtual Institute funded this research.
Comments Off on Regolith of small asteroids formed by thermal fatigue
World’s oldest weather report found could revise bronze age
April 3rd, 2014By Alton Parrish.
A new translation of a 40-line inscription on the 6-foot-tall calcite block called the Tempest Stela describes rain, darkness and “the sky being in storm without cessation, louder than the cries of the masses.”
A new translation of a 6-foot-tall calcite block called the Tempest Stela suggests the Egyptian pharaoh Ahmose ruled at a time 30 to 50 years earlier than previously thought—a finding that could change scholars’ understanding of a critical juncture in the Bronze Age.

Courtesy of Metropolitan Museum of Art
The new translation suggests the Egyptian pharaoh Ahmose ruled at a time closer to the Thera eruption than previously thought—a finding that could change scholars’ understanding of a critical juncture in human history as Bronze Age empires realigned. The research from the Oriental Institute’s Nadine Moeller and Robert Ritner appears in the spring issue of the Journal of Near Eastern Studies.
The Tempest Stela dates back to the reign of the pharaoh Ahmose, the first pharaoh of the 18th Dynasty. His rule marked the beginning of the New Kingdom, a time when Egypt’s power reached its height. The block was found in pieces in Thebes, modern Luxor, where Ahmose ruled.
If the stela does describe the aftermath of the Thera catastrophe, the correct dating of the stela itself and Ahmose’s reign, currently thought to be about 1550 B.C., could actually be 30 to 50 years earlier.
“This is important to scholars of the ancient Near East and eastern Mediterranean, generally because the chronology that archaeologists use is based on the lists of Egyptian pharaohs, and this new information could adjust those dates,” said Moeller, assistant professor of Egyptian archaeology at the Oriental Institute, who specializes in research on ancient urbanism and chronology.
In 2006, radiocarbon testing of an olive tree buried under volcanic residue placed the date of the Thera eruption at 1621-1605 B.C. Until now, the archeological evidence for the date of the Thera eruption seemed at odds with the radiocarbon dating, explained Oriental Institute postdoctoral scholar Felix Hoeflmayer, who has studied the chronological implications related to the eruption. However, if the date of Ahmose’s reign is earlier than previously believed, the resulting shift in chronology “might solve the whole problem,” Hoeflmayer said.
The revised dating of Ahmose’s reign could mean the dates of other events in the ancient Near East fit together more logically, scholars said. For example, it realigns the dates of important events such as the fall of the power of the Canaanites and the collapse of the Babylonian Empire, said David Schloen, associate professor in the Oriental Institute and Near Eastern Languages & Civilizations on ancient cultures in the Middle East.
“This new information would provide a better understanding of the role of the environment in the development and destruction of empires in the ancient Middle East,” he said.
For example, the new chronology helps to explain how Ahmose rose to power and supplanted the Canaanite rulers of Egypt—the Hyksos—according to Schloen. The Thera eruption and resulting tsunami would have destroyed the Hyksos’ ports and significantly weakened their sea power.
In addition, the disruption to trade and agriculture caused by the eruption would have undermined the power of the Babylonian Empire and could explain why the Babylonians were unable to fend off an invasion of the Hittites, another ancient culture that flourished in what is now Turkey.
‘A TEMPEST OF RAIN’
Some researchers consider the text on the Tempest Stela to be a metaphorical document that described the impact of the Hyksos invasion. However, Ritner’s translation shows that the text was more likely a description of weather events consistent with the disruption caused by the massive Thera explosion.
Ritner said the text reports that Ahmose witnessed the disaster—the description of events in the stela text is frightening.
The stela’s text describes the “sky being in storm” with “a tempest of rain” for a period of days. The passages also describe bodies floating down the Nile like “skiffs of papyrus.”
Importantly, the text refers to events affecting both the delta region and the area of Egypt further south along the Nile. “This was clearly a major storm, and different from the kinds of heavy rains that Egypt periodically receives,” Ritner said.
In addition to the Tempest Stela, a text known as the Rhind Mathematical Papyrus from the reign of Ahmose also makes a special point of mentioning thunder and rain, “which is further proof that the scholars under Ahmose paid close and particular attention to matters of weather,” Ritner said.
Marina Baldi, a scientist in climatology and meteorology at the Institute of Biometeorology of the National Research Council in Italy, has analyzed the information on the stela along with her colleagues and compared it to known weather patterns in Egypt.
A dominant weather pattern in the area is a system called “the Red Sea Trough,” which brings hot, dry air to the area from East Africa. When disrupted, that system can bring severe weather, heavy precipitation and flash flooding, similar to what is reported on the Tempest Stela.
“A modification in the atmospheric circulation after the eruption could have driven a change in the precipitation regime of the region. Therefore the episode in the Tempest Stela could be a consequence of these climatological changes,” Baldi explained.
Other work is underway to get a clearer idea of accurate dating around the time of Ahmose, who ruled after the Second Intermediate period when the Hyksos people seized power in Egypt. That work also has pushed back the dates of his reign closer to the explosion on Thera, Moeller explained.
Comments Off on World’s oldest weather report found could revise bronze age
‘Cosmic barometer’ could reveal violent evens in universe’s past
March 31st, 2014By Alton Parrish.
Exploding stars, random impacts involving comets and meteorites, and even near misses between two bodies can create regions of great heat and high pressure.

Researchers from Imperial College London have now developed a method for analysing the pressure experienced by tiny samples of organic material that may have been ejected from dying stars before making a long journey through the cosmos. The researchers have investigated a type of aromatic hydrocarbon called dimethylnaphthalene, which should enable them to identify violent events in the history of the universe.
Samples of dimethylnaphthalene are found in meteorites. Previously, scientists have only had the ability to investigate how they have been affected by heat. The Imperial researchers say their method for detecting periods when dimethylnaphthalenes have experienced high pressure will now allow for a much more comprehensive analysis of organic materials.
Dr Wren Montgomery, co-author from the Department of Earth Science and Engineering at Imperial CollegeLondon, says: “The ability to detect high pressure environments in space has tremendous implications for our ability to learn more about the formation of our solar system and the universe. Dimethylnaphthalenes are like microscopic barometers and thermometers recording changes in pressure and heat as they travel through space. Understanding these changes lets us probe their history, and with that, the history of the galaxy.”
In the study, the researchers placed a sample of dimethylnaphthalene, the width of a human hair, between the vice like grip of two anvils made out of gem-quality diamonds in a laboratory at the Swiss Light Source. They then applied pressure, recreating the type of high pressure environment that dimethylnaphthalene could experience in space. Using an infrared light from the synchrotron at the facility, Dr Montgomery and her colleagues were able to clearly determine the alterations that happen to the molecular structure of dimethylnaphthalene when experiencing high pressure.
By applying different pressures, the team were able to vary the change in the molecular structure of dimethylnaphthalene, giving an insight into how different types of pressures in space would alter the molecular structure of the organic material.
The researchers also recreated the experiments at the Paul Scherrer Institut in Switzerland and SOLEIL Synchrotron in France to verify their research.
The next step will see the team carrying out more lab work where they will be subjecting other types of aromatic hydrocarbons to a range of pressures experienced in space. Dimethylnaphthalene may not always be present in rock samples, so the researchers say it is important to build up a comprehensive catalogue of all aromatic hydrocarbons to understand more about high pressure zones.
This catalogue would be used by scientists in the field to detect molecular markers in their samples that indicate a particular pressure range. Combined with data about the mineralogy and chemistry of the space rock that the aromatic hydrocarbons are encased in, scientists could then deduce the types of violent eventsthat the sample may have been exposed to many millions or billions of years ago on its way to Earth.
The team also believe that their new technique could be applied on Mars, potentially using the existing technology on-board roving laboratories such as the one on the Mars Science Laboratory Mission to gleaninformation about sources of organic matter on the red planet. Recognising the pressures recorded in the aromatic hydrocarbons can help to reveal whether it came from processes generated from ancient living organisms.
Professor Mark Sephton, co-author from the Department of Earth Science and Engineering at Imperial, says: “We now have another instrument to add to our celestial toolbox, which will help us to learn more about high pressure environments in space. Massive heat and pressure waves arcing out through space from cataclysmic events leave an indelible record in these cosmic barometers. It is really exciting to know that we now have a technique at our disposal that will help to reveal pivotal moments in the universe’s history.”
The research is published tomorrow in The Astrophysical Journal.
Comments Off on ‘Cosmic barometer’ could reveal violent evens in universe’s past
Is it safe to pee in the pool?
March 28th, 2014
By Alton Parrish.
Sanitary-minded pool-goers who preach “no peeing in the pool,” despite ordinary and Olympic swimmers admitting to the practice, now have scientific evidence to back up their concern.
Researchers are reporting that when mixed, urine and chlorine can form substances that can cause potentialhealth problems. Their study appears in ACS’ journal Environmental Science & Technology.
Though competitive swimmers have admitted to peeing in the pool, the common practice should be a no-no, a new study finds.

Credit: Purestock/Thinkstock
Jing Li, Ernest Blatchley, III, and colleagues note that adding chlorine to pool water is the most common way to kill disease-causing microbes and prevent swimmers from getting sick. But as people swim, splash, play — and pee — in the pool, chlorine mixes with sweat and urine and makes other substances. Two of these compounds, including trichloramine (NCl3) and cyanogen chloride (CNCl), are ubiquitous in swimming pools.
The first one is associated with lung problems, and the second one can also affect the lungs, as well as the heart and central nervous system. But scientists have not yet identified all of the specific ingredients in sweat and urine that could cause these potentially harmful compounds to form. So Li’s team looked at how chlorine interacts with uric acid, a component of sweat and urine.
They mixed uric acid and chlorine, and within an hour, both NCl3 and CNCl formed. Though some uric acid comes from sweat, the scientists calculated that more than 90 percent of the compound in pools comes from urine. They conclude that swimmers can improve pool conditions by simply urinating where they’re supposed to — in the bathrooms.
The authors acknowledge funding from the Chinese Universities Scientific Fund, the National Natural Science Foundation of China and the National Swimming Pool Foundation.
Comments Off on Is it safe to pee in the pool?
Computer better than people at spotting false faces
March 24th, 2014By Alton Parrish.
“The computer system managed to detect distinctive dynamic features of facial expressions that people missed,” said Marian Bartlett, research professor at UC San Diego’s Institute for Neural Computation and lead author of the study. “Human observers just aren’t very good at telling real from faked expressions of pain.”

Senior author Kang Lee, professor at the Dr. Eric Jackman Institute of Child Study at the University of Toronto, said “humans can simulate facial expressions and fake emotions well enough to deceive most observers. The computer’s pattern-recognition abilities prove better at telling whether pain is real or faked.”
The research team found that humans could not discriminate real from faked expressions of pain better than random chance – and, even after training, only improved accuracy to a modest 55 percent. The computersystem attains an 85 percent accuracy.
“In highly social species such as humans,” said Lee, “faces have evolved to convey rich information, including expressions of emotion and pain. And, because of the way our brains are built, people can simulate emotions they’re not actually experiencing – so successfully that they fool other people. The computer is much better at spotting the subtle differences between involuntary and voluntary facial movements.”
“By revealing the dynamics of facial action through machine vision systems,” said Bartlett, “our approach has the potential to elucidate ‘behavioral fingerprints’ of the neural-control systems involved in emotional signalling.
The single most predictive feature of falsified expressions, the study shows, is the mouth, and how and when it opens. Fakers’ mouths open with less variation and too regularly.
“Further investigations,” said the researchers, “will explore whether over-regularity is a general feature of fake expressions.”
In addition to detecting pain malingering, the computer-vision system might be used to detect other real-world deceptive actions in the realms of homeland security, psychopathology, job screening, medicine, and law, said Bartlett.
“As with causes of pain, these scenarios also generate strong emotions, along with attempts to minimize, mask, and fake such emotions, which may involve ‘dual control’ of the face,” she said. “In addition, ourcomputer-vision system can be applied to detect states in which the human face may provide important clues as to health, physiology, emotion, or thought, such as drivers’ expressions of sleepiness, students’ expressions of attention and comprehension of lectures, or responses to treatment of affective disorders.”
Comments Off on Computer better than people at spotting false faces
Revolutionary nuclear radiation detector hits market
March 21st, 2014By Alton Parrish.
The new ‘Polaris-H’ detector lays a gamma-ray map over an image of a room, pinpointing radiation sources with unprecedented precision. At least four U.S. nuclear power plants are using versions of the camera, which is now available commercially through the U-M spinoff company H3D.

“This technology enables people to ‘see’ radiation,” said Zhong He, a professor of nuclear engineering and radiological sciences at U-M and CEO of H3D. “This should enable the early detection of leaks by locating abnormal radiation, a much better understanding of radiation sources to protect workers, and it could be a tool for the cleanup effort of nuclear waste and fallout, such as in Fukushima in Japan.”
Radiation safety professionals have called the device revolutionary. They say it could become the new standard.
“We can find things now in 30 minutes that could take weeks to find before,” said Robert Hite, radiationprotection manager at the Cook Nuclear Plant near St. Joseph, Mich., and early adopter of Polaris-H. “All of our technology that we have—that I’ve worked with for 30 years—doesn’t touch what this shows us.”
A radiation imager offers plant managers like Hite a quicker way to identify and locate problems, including radioactive buildup in pipes, stray radioactive particles in otherwise clean areas and leaky fuel rods. Also, in the event of an accident, an imager could monitor radiation plumes and point out contaminated areas.
The imaging capabilities of Polaris-H can be used to locate the primary source(s) of radiation in areas before work will be performed. These pictures were taken at the side of a reactor cavity before work was performed in it. In the first measurement (first picture), the drain in the far left corner was identified as a primary contributor to the source term. Moving Polaris-H to the other side of the cavity, which shields the system from the drain direction, another, unexpected, source term of the wall of cavity was identified. Polaris-H can also determine the isotopic composition of each hot spot. Thus, the pit could be cleaned before work progressed.

The gamma camera operates at room temperature, which is an improvement for the many plants that currently work with cumbersome, cryogenically cooled detectors. Room-temperature radiation imagers have been poor performers in the past, so many nuclear power plants in the U.S. rely on non-imaging detectors to find contamination. Locating the source of the problem often means moving the non-imaging detector around the contaminated area to find areas with high radiation counts.
To use Polaris-H, though, an operator can simply set the camera in the contaminated area, switch it on and then leave the room while it reveals the radiation hotspots and identifies the radioactive elements present. A 15-foot cord connects the detector and an external touchscreen controller so the operator can give commands and download data remotely. The camera stores radiation detection data on a USB drive that operators can transfer to a computer for in-depth analysis.
While traditional imagers cost upwards of $200,000, the new cameras are priced below $100,000.
The technology grew out of a project in He’s lab. The original briefcase-sized Polaris was developed for catching terrorists, but the team quickly realized that the nuclear energy industry could put the technology to use for safety. Five of He’s former graduate students making up the bulk of the company’s staff.
Prototype models are in use at the Cook plant and South Korea’s Institute for Basic Science in Daejeon. Based on feedback from these users over the past year, the team made it possible to operate the camera using a simple red button to start and end measurements.
“Our demonstrations used to last 20 minutes,” said H3D president William Kaye, a recent doctoral graduate in nuclear engineering and radiological sciences. “Now we just switch on the machine and say, ‘Okay, these are all the isotopes, this is where they are, any questions?'”
Kaye said that this level of information hasn’t been available in the past, so the H3D team hopes to educate customers about how it can be used. For instance, sometimes the radiation source is ambiguous after detector measurements. A set of pipes might appear to be radioactive, but an image could clearly show whether the radiation was uniform, or whether some pipes were more radioactive than others.
Comments Off on Revolutionary nuclear radiation detector hits market
Chernobyl’s radiation damage of microbes has far reaching effects
March 20th, 2014
By University of South Carolina.
Radiological damage to microbes near the site of the Chernobyl disaster has slowed the decomposition of fallen leaves and other plant matter in the area, according to a study just published in the journal Oecologia. The resulting buildup of dry, loose detritus is a wildfire hazard that poses the threat of spreading radioactivity from the Chernobyl area.
Tim Mousseau, a professor of biology and co-director of the Chernobyl and Fukushima Research Initiatives at the University of South Carolina, has done extensive research in the contaminated area surrounding the Chernobyl nuclear facility, which exploded and released large quantities of radioactive compounds in the Ukraine region of the Soviet Union in 1986. He and frequent collaborator Anders Møller of Université Paris-Sud noticed something unusual in the course of their work in the Red Forest, the most contaminated part of the Chernobyl Exclusion Zone.
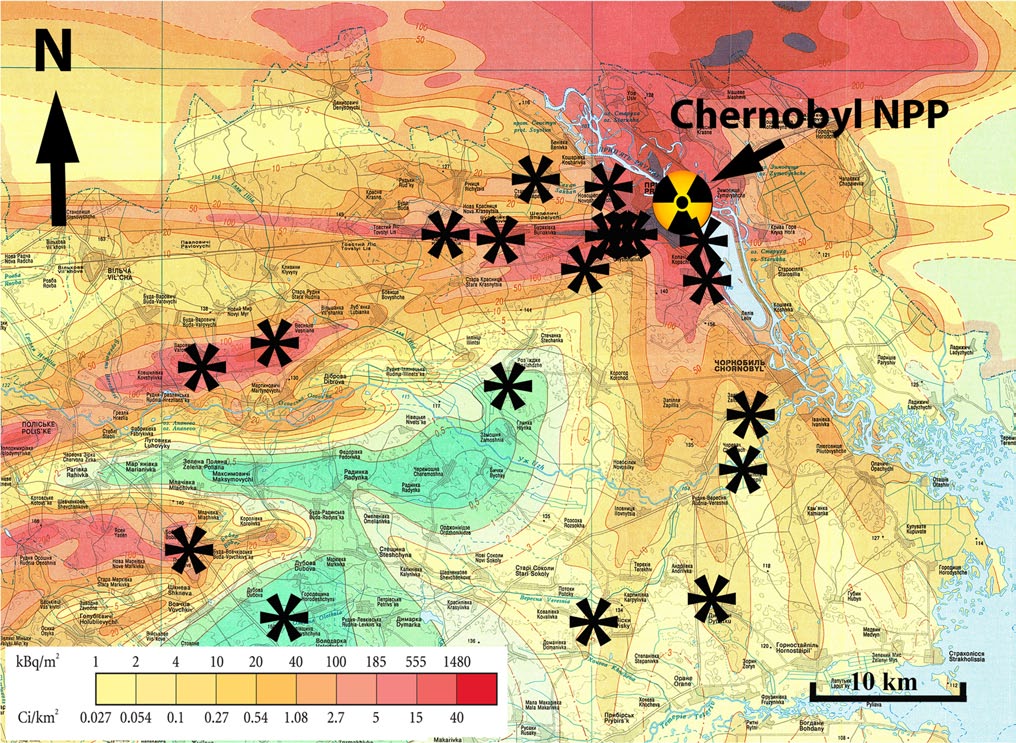
Image: Oecologia
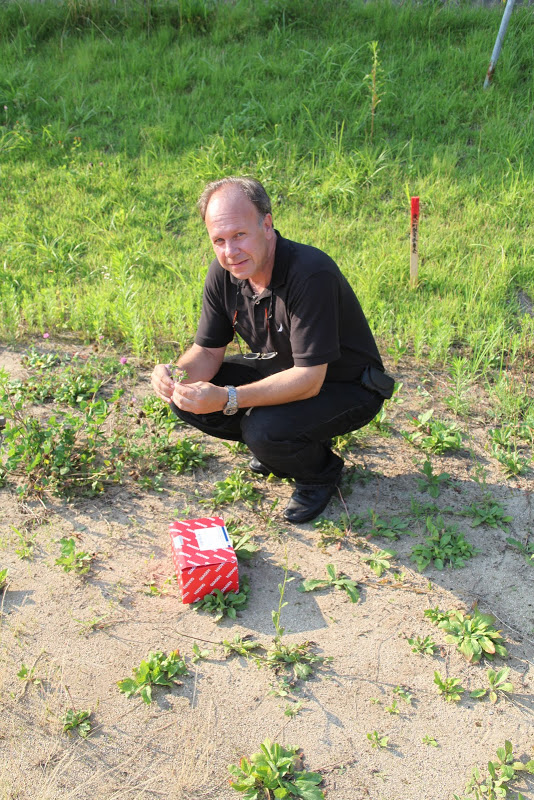
They set out to assess the rate at which plant material decomposed as a function of background radiation, placing hundreds of samples of uncontaminated leaf litter (pine needles and oak, maple and birch leaves) in mesh bags throughout the area. The locations were chosen to cover a range of radiation doses, and the samples were retrieved after nine months outdoors.
A statistical analysis of the weight loss of each leaf litter sample after those nine months showed that higher background radiation was associated with less weight loss. The response was proportional to radiation dose, and in the most contaminated regions, the leaf loss was 40 percent less than in control regions in Ukraine with normal background radiation levels.
They also measured the thickness of the forest floor in the same areas where samples were placed. They found that it was thicker in places with higher background radiation.
The team concluded that the bacteria and fungi that decompose plant matter in healthy ecosystems are hindered by radioactive contamination. They showed a smaller effect for small invertebrates, such as termites, that also contribute to decomposition of plant biomass.
According to Mousseau, slower decomposition is likely to indirectly slow plant growth, too, given that the products of decomposition are nutrients for new plants. The team recently reported diminished tree growth near Chernobyl, which he says likely results both from direct radiation effects and indirect effects such as reduced nutrient supply.
“It’s another facet of the impacts of low-dose-rate radioactive contaminants on the broader ecosystem,” Mousseau says. “We’ve looked at many other components, namely the populations of animals in the area, and this was an opportunity for broadening our range of interests to include the plant and microbial communities.”
The results also show the potential for further spread of radioactivity.
“There’s been growing concern by many different groups of the potential for catastrophic forest fires to sweep through this part of the world and redistribute the radioactive contamination that is in the trees and the plant biomass,” Mousseau says. “That would end up moving radio-cesium and other contaminants via smoke into populated areas.
“This litter accumulation that we measured, which is likely a direct consequence of reduced microbial decomposing activity, is like kindling. It’s dry, light and burns quite readily. It adds to the fuel, as well as makes it more likely that catastrophically sized forest fires might start.”
Comments Off on Chernobyl’s radiation damage of microbes has far reaching effects
Frozen in ice for 1,500 years, moss brought back to life
March 17th, 2014By Alton Parrish.
Researchers from the British Antarctic Survey and Reading University have demonstrated that, after over 1,500 years frozen in Antarctic ice, moss can come back to life and continue to grow. For the first time, this vital part of the ecosystem in both polar regions has been shown to have the ability to survive century to millennial scale ice ages. This provides exciting new insight into the survival of life on Earth.

The team, reporting in Current Biology this week, observed moss regeneration after at least 1,530 years frozen in permafrost. This is the first study to show such long-term survival in any plant; similar timescales have only been seen before in bacteria. Mosses are known to survive environmental extremes in the short-term with previous evidence confirming up to a 20 year timescale for survival. Their potential to survive much longer timescales had not previously been examined.
Mosses are an important part of the biology of both polar regions. They are the dominant plants over large areas and are a major storer of fixed carbon, especially in the north.

Credit: Esme Roads

The team took cores of moss from deep in a frozen moss bank in the Antarctic. This moss would already have been at least decades old when it was first frozen. They sliced the frozen moss cores very carefully, keeping them free from contamination, and placed them in an incubator at a normal growth temperature and light level. After only a few weeks, the moss began to grow. Using carbon dating, the team identified the moss to be at least 1,530 years of age, and possibly even older, at the depth where the new growth was seen.
According to Professor Convey:
“This experiment shows that multi-cellular organisms, plants in this case, can survive over far longer timescales than previously thought. These mosses, a key part of the ecosystem, could survive century to millennial periods of ice advance, such as the Little Ice Age in Europe.
“If they can survive in this way, then recolonisation following an ice age, once the ice retreats, would be a lot easier than migrating trans-oceanic distances from warmer regions. It also maintains diversity in an area that would otherwise be wiped clean of life by the ice advance.
“Although it would be a big jump from the current finding, this does raise the possibility of complex life forms surviving even longer periods once encased in permafrost or ice.”
Comments Off on Frozen in ice for 1,500 years, moss brought back to life
Largest yellow star ever found, 1300 times the Sun’s diameter
March 16th, 2014By Alton Parrish.

Credit: ESO/Digitized Sky Survey 2
The astronomers made use of a technique called interferometry to combine the light collected from multipleindividual telescopes, effectively creating a giant telescope up to 140 metres in size. The new results prompted the team to thoroughly investigate older observations of the star spanning more than sixty years, to see how it had behaved in the past [3].

Credit: ESO
Despite its great distance of nearly 12 000 light-years from Earth, the object can just about be seen with the naked eye [4] by the keen-sighted. HR 5171 A has been found to be getting bigger over the last 40 years, cooling as it grows, and its evolution has now been caught in action. Only a few stars are caught in this very brief phase, where they undergo a dramatic change in temperature as they rapidly evolve.
By analysing data on the star’s varying brightness, using observations from other observatories, the astronomers confirmed the object to be an eclipsing binary system where the smaller component passes in front and behind the larger one as it orbits. In this case HR 5171 A is orbited by its companion star every 1300 days. The smaller companion is only slightly hotter than HR 5171 A’s surface temperature of 5000 degrees Celsius.
Chesneau concludes “The companion we have found is very significantas it can have an influence on the fate of HR 5171 A, for example, stripping off its outer layers and modifying its evolution.”
This new discovery highlights the importance of studying these huge and short-lived yellow hypergiants, and could provide a means of understanding the evolutionary processes of massive stars in general.
This zoom sequence takes us from a wide view of the spectacular southern Milky Way into a closeup view of one of its biggest and rarest stars — the yellow hypergiant star HR 5171. This monster stars has a radius over 1300 times that of the Sun — it is one of the largest ten stars found so far. Observations with ESO’s Very Large Telescope Interferometer have shown that it is actually a double star, with the companion in contact with the main star.
)
Credit: ESO/Nick Risinger (skysurvey.org)/Digitized Sky Survey 2. Music: movetwo
Comments Off on Largest yellow star ever found, 1300 times the Sun’s diameter
Vast oceans hundreds of miles beneath Earth’s surface
March 13th, 2014By Alton Parrish.
An international team of scientists led by Graham Pearson, Canada Excellence Research Chair in Arctic Resources at the U of A, has discovered the first-ever sample of a mineral called ringwoodite. Analysis of the mineral shows it contains a significant amount of water—1.5 per cent of its weight—a finding that confirms scientific theories about vast volumes of water trapped 410 to 660 kilometres beneath the Earth, between the upper and lower mantle.

Credit: Richard Siemens/University of Alberta
Ringwoodite is a form of the mineral peridot, believed to exist in large quantities under high pressures in the transition zone. Ringwoodite has been found in meteorites but, until now, no terrestrial sample has ever been unearthed because scientists haven’t been able to conduct fieldwork at extreme depths.
Pearson’s sample was found in 2008 in the Juina area of Mato Grosso, Brazil, where artisan miners unearthed the host diamond from shallow river gravels. The diamond had been brought to the Earth’s surface by a volcanic rock known as kimberlite—the most deeply derived of all volcanic rocks.
![]()
The first terrestrial discovery of ringwoodite by University of Alberta scientist Graham Pearson confirms the presence of massive amounts of water 400 to 700 km beneath the Earth’s surface.

Credit: University of Alberta
The discovery that almost wasn’t
Pearson said the discovery was almost accidental in that his team had been looking for another mineral when they purchased a three-millimetre-wide, dirty-looking, commercially worthless brown diamond. The ringwoodite itself is invisible to the naked eye, buried beneath the surface, so it was fortunate that it was found by Pearson’s graduate student, John McNeill, in 2009.
“It’s so small, this inclusion, it’s extremely difficult to find, never mind work on,” Pearson said, “so it was a bit of a piece of luck, this discovery, as are many scientific discoveries.”
The sample underwent years of analysis using Raman and infrared spectroscopy and X-ray diffraction before it was officially confirmed as ringwoodite. The critical water measurements were performed at Pearson’s Arctic Resources Geochemistry Laboratory at the U of A. The laboratory forms part of the world-renowned Canadian Centre for Isotopic Microanalysis, also home to the world’s largest academic diamond research group.
The study is a great example of a modern international collaboration with some of the top leaders from various fields, including the Geoscience Institute at Goethe University, University of Padova, Durham University, University of Vienna, Trigon GeoServices and Ghent University.
For Pearson, one of the world’s leading authorities in the study of deep Earth diamond host rocks, the discovery ranks among the most significant of his career, confirming about 50 years of theoretical and experimental work by geophysicists, seismologists and other scientists trying to understand the makeup of the Earth’s interior.
Scientists have been deeply divided about the composition of the transition zone and whether it is full of water or desert-dry. Knowing water exists beneath the crust has implications for the study of volcanism and plate tectonics, affecting how rock melts, cools and shifts below the crust.
“One of the reasons the Earth is such a dynamic planet is the presence of some water in its interior,” Pearson said. “Water changes everything about the way a planet works.”
Comments Off on Vast oceans hundreds of miles beneath Earth’s surface
What could have happened to Malaysia airlines flight MH370
March 12th, 2014Alton Parrish.

Credit: Malaysia Airlines
No radio calls were received from the flight crew indicating that the plane had any sort of problem before it disappeared somewhere over the Gulf of Thailand 2:40am local time (5:40am AEDT) on Saturday.
The plane might have suffered catastrophic and immediate destruction, or at least lost all of its electronics and communications. If that was the case, it might have descended rapidly to the sea surface in the general area of its last reported flight location.
But if some systems remained operating so as to allow the pilots to glide down, the area where the plane may have crashed would be much wider.
Assuming a typical gliding angle of say 10:1 from a height of 10 kilometres above sea level, descending in an unknown direction, the possible area of search would be more than 30,000 square kilometres – an area roughly the size of Belgium. That is a vast area to search thoroughly, and is possibly the reason no debris has yet been found.
Probable causes
There are various possible causes:
Weather and environment – very unlikely, as the weather seemed benign. Space junk or asteroid strike are also very remote possibilities.
Pilot error – very unlikely in cruise unless some serious malfunctions occurred (although that was what happened to Air France Flight. AF447)
Technical failures – probably more likely than 1 or 2
Illegal interference – probably more likely than 1 or 2.
In the case of the 2009 loss of Air France 447 into the Altantic ocean, pilots received erroneous airspeed data due to icing of instrumentation while the plane, an Airbus A330-200, was flying straight and level.
The pilot(s) responded poorly, and their plane stalled and fell to the sea from nearly 38,000 feet. Poor training was held to be a contributing factor, and the captain was apparently not in the cockpit at the time.
Severe malfunctions such as a double engine failure or inflight structural failure would likely still leave the pilots time to issue a mayday call. With Malaysia Airline flight MH370, it appears that the individual plane, a Boeing B777-200ER, did suffer wing tip damage in a ground collision in 2012, although failure of this repair would appear to be an unlikely cause of communications failure as well.
Even with both engine generators unserviceable, the B777 has back-up emergency power systems, certainly capable of allowing pilots to transmit a radio call.
So we are left with the conclusion that all radio systems were rendered unserviceable. In addition the B777 is equipped with ACARS (Aircraft Communications Addressing and Reporting System) that would have allowed the crew to send a “text” message back to base.
Aeroplane and base ACARS systems are not usually in constant communication as this increases the costs for satellite communication substantially. So we are left with the probability that all major electronics systems were disabled, to the extent that no communications were possible, and the aeroplane could not continue to fly.
What might cause this? Maybe an explosion and/or fire in the electronics compartment because of electronics failures, but how this might occur is not at all obvious.
Terrorists?
A fourth possibility is illegal interference, and the passengers holding false passports might be complicit, or might be irrelevant.
But even with bad intent, some planning would be necessary. A terrorist passenger might have packed sufficient plastic explosives, then set these off in the area just rear of the cockpit, with the result being both loss of systems and possibly pilots.
Explosives in the cargo compartment or in checked baggage also cannot be ruled out. As of the time of writing, no group appears to have claimed responsibility.
Recovering the lost plane
So now what happens? All of the above possibilities and some I have not thought of here will be considered in minute detail by the accident investigators. The Gulf of Thailand is less than 100 metres deep in the region of the flight path, so finding the wreckage in the ocean may take some time, but will be straightforward.
The so-called “black box” flight data recorder (it is actually orange in colour) will have recorded the entire flight data from the departure gate at Kuala Lumpur, and will most likely be found intact, with readable data.
It is capable of withstanding far greater depths than 100m, and of withstanding fires and even a mild explosion. It has internal battery power, and will emit sonar “pings” to enable location under water.
The Cockpit Voice Recorder (CVR), also water-proof and having a locator pinger, will have recorded the last minutes of conversation between the pilots, and will also be recovered. Together with detailed forensic studies of all retrieved components, the accident investigators will be able to reconstruct the physical cause of the accident.
With international law enforcement on the case, it is most likely that any illegal activities will ultimately be uncovered. The meta-data bases of telephone contacts that we consider to be a major intrusion on our privacy may in fact prove to be highly valuable here.
While the Malaysian accident investigators will lead the investigation, many stakeholders will contribute by providing specialists, including Malaysia Airlines, Boeing Airplane Company, Rolls Royce and Honeywell. Ultimately the truth will emerge, and hopefully the causes of the tragedy will provide important lessons to make flying even safer in future.
Comments Off on What could have happened to Malaysia airlines flight MH370
Fracking Earthquakescan trigger larger earthquakes
March 11th, 2014By Alton Parrish.
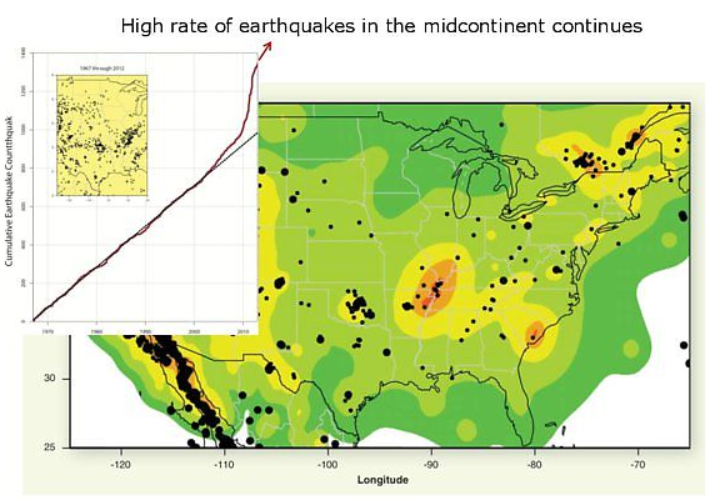
“The observation that a human-induced earthquake can trigger a cascade of earthquakes, including a larger one, has important implications for reducing the seismic risk from wastewater injection,” said USGS seismologist and coauthor of the study Elizabeth Cochran.

Credit: USGS
The 2011 Oklahoma earthquake sequence included the November 6, 2011, M5.7 earthquake that ruptured a part of the Wilzetta fault system, a complex fault zone about 200 km (124 mi) in length near Prague, Oklahoma. Less than 24 hours prior to the M5.7 earthquake, a M5.0 foreshock occurred on November 5, 2011. That foreshock occurred near active waste-water disposal wells, and was linked in a previously published study to fluid injection in those wells. The earthquakes have not been directly linked to hydrofracturing.
The research published this week suggests that the foreshock, by increasing stresses where M5.7 mainshock ruptured, may have triggered the mainshock, which in turn, triggered thousands of aftershocks along the Wilzetta fault system, including a M5.0 aftershock on November 8, 2011. If this hypothesis is correct, the M5.7 earthquake would be the largest and most powerful earthquake ever associated with wastewater injection. All three earthquakes of magnitude 5.0 and greater along the Wilzetta fault exhibited strike-slip motion at three independent locations along the fault, suggesting that three separate portions of the Wilzetta fault system were activated.
Credit: USGS
The paper, “Observations of Static Coulomb Stress Triggering of the November 2011 M5.7 Oklahoma Earthquake Sequence,” by D.F. Sumy, E.S. Cochran, K.M. Keranen, M. Wei, G.A. Abers, from the University of Southern California, USGS, Cornell University, Brown University, and the Lamont Doherty Earth Observatory at Columbia University, was published in the “Journal of Geophysical Research” this week.
Comments Off on Fracking Earthquakescan trigger larger earthquakes
Americans spend $100 Billion annually on illegal drugs says report
March 11th, 2014
By Alton Parrish.
The use of cocaine dropped sharply across the United States from 2006 to 2010, while the amount of marijuana consumed increased significantly during the same period, according to a new report.
Studying illegal drug use nationally from 2000 to 2010, researchers found the amount of marijuana consumed by Americans increased by more than 30 percent from 2006 to 2010, while cocaine consumption fell by about half. Meanwhile, heroin use was fairly stable throughout the decade.
Retail Expenditures on Illicit Drugs, 2000–2010 (in billions of 2010 dollars)

Methamphetamine consumption dramatically increased during the first half of the decade and then declined, but researchers did not have enough information to make a credible estimate of the drug’s use from 2008 to 2010.
The findings come from a report compiled for the White House Office of National Drug Control Policy by researchers affiliated with the RAND Drug Policy Research Center.
“Having credible estimates of the number of heavy drug users and how much they spend is critical for evaluating policies, making decisions about treatment funding and understanding the drug revenues going to criminal organizations,” said Beau Kilmer, the study’s lead author and co-director of the RAND Drug Policy Research Center. “This work synthesizes information from many sources to present the best estimates to date for illicit drug consumption and spending in the United States.”
Consumption of Illicit Drugs, 2000–2010 (in pure metric tons, except marijuana)

Because the project only generated estimates through 2010, researchers say the report does not address the recent reported spike in heroin use or the consequences of marijuana legalization in Colorado and Washington. The report also does not try to explain the causes behind changes in drug use or evaluate the effectiveness of drug control strategies.
The study, published on the website of the Office of National Drug Control Policy, provides estimates of the amount of cocaine, heroin, marijuana and methamphetamine used each year from 2000 to 2010. The study includes estimates of retail spending on illicit drugs and the number of chronic users, who account for a majority of drug consumption.
Researchers say that drug users in the United States spent on the order of $100 billion annually on cocaine, heroin, marijuana and methamphetamine throughout the decade. While the amount remained stable from 2000 to 2010, the spending shifted. While much more was spent on cocaine than on marijuana in 2000, the opposite was true by 2010.
“Our analysis shows that Americans likely spent more than one trillion dollars on cocaine, heroin, marijuana and methamphetamine between 2000 and 2010,” Kilmer said.
The surge in marijuana use appears to be related to an increase in the number of people who reported using the drug on a daily or near-daily basis.
Number of Marijuana Users, by Intensity of Use (NSDUH)
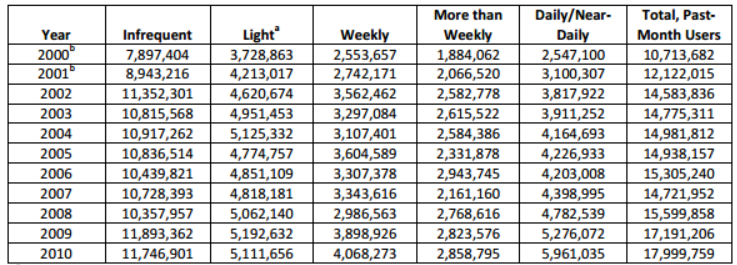
The estimates for marijuana are rooted in the National Survey on Drug Use and Health, which surveys nearly 70,000 individuals each year. Estimates for cocaine, heroin and methamphetamine are largely based on information from the Arrestee Drug Abuse Monitoring Program, or ADAM. The final estimates also incorporated information from other data sources
However, since the federal government recently halted funding for ADAM, researchers say it will be considerably harder to track the abuse of cocaine, heroin, and methamphetamine in the future.
“The ADAM program provided unique insights about those who abused hard drugs and how much they spent on these substances,” said Jonathan Caulkins, a study co-author and the Stever Professor of Operations Research and Public Policy at Carnegie Mellon University. “It’s a tragedy that 2013 was the last year for ADAM. It is such an important data system for understanding drug problems.”
To improve future estimates, the report recommends investments in programs like ADAM that collect detailed data from heavy users. It also recommends that federal agencies revise some of the questions on existing self-report surveys.
The study, “What America’s Users Spend on Illegal Drugs, 2000–2010,” can be found athttp://www.whitehouse.gov/ondcp. Other authors of the report are Susan Everingham, Greg Midgette, Rosalie Pacula, Rachel Burns, Bing Han and Russell Lundberg, all of RAND, and Peter Reuter of the University of Maryland.
Since 1989, the RAND Drug Policy Research Center has conducted research to help policymakers in the United States and throughout the world address issues involving alcohol and other drugs. In doing so, the center brings an objective and data-driven perspective to an often emotional and fractious policy arena.
Comments Off on Americans spend $100 Billion annually on illegal drugs says report
Public could travel to space for £40 through new project
March 8th, 2014
By University of Surrey.
Researchers from the University of Surrey have launched a unique campaign that will enable the public to ‘travel’ to space for the cost of a pair of trainers.
Virtual Ride to Space will use cutting-edge virtual technology and a specially designed spacecraft to deliver a three-dimensional, immersive experience, allowing everyone to see what astronauts experience on an ascent to space.
The experience will be created by capturing HD footage of space, via a weather balloon which will carry a cluster of twenty-four HD video cameras to a height of 20km – twice the height of a commercial airplane. During ascent these cameras will capture panoramic footage of the balloon’s journey to space.
Following the flight, specialised software will stitch this footage together to recreate a panoramic view of the space trip. The subsequent space ride will then be viewed using Oculus Rift, a state-of-the-art virtual reality, head-mounted display. The system is designed to deliver high definition 3D virtual environments that can be explored by the wearer, as if they are in space themselves.

The project team are also developing a smartphone application that will allow users to experience the journey using the phones’ built-in gyroscope and accelerometer data, as well as a computer programme that will allow users to experience space via their PCs.
Investment for Ride to Space is being sought via Kickstarter. Please visit the Virtual Ride to Space page for more information.
https://www.kickstarter.com/projects/1592839372/virtual-ride-to-space-using-the-oculus-rift
Comments Off on Public could travel to space for £40 through new project
New dinosaur found in Portugal
March 7th, 2014By Alton Parrish.

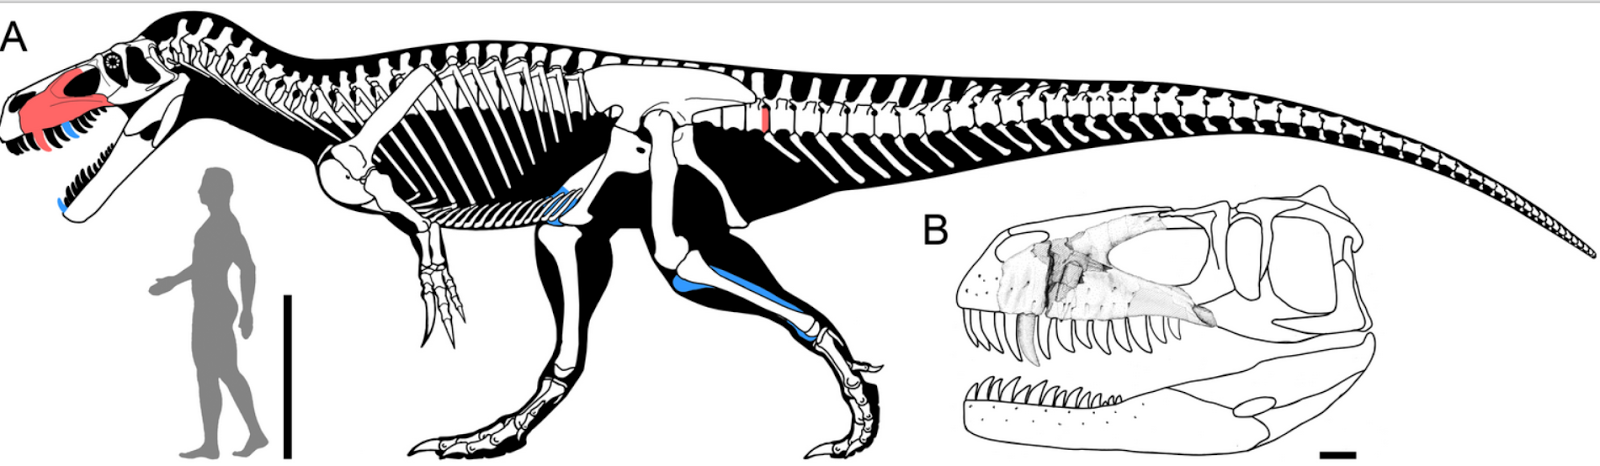
Credit: Christophe Hendrickx

Credit: PLOS

Credit: Wikipedia
“This is not the largest predatory dinosaur we know. Tyrannosaurus,Carcharodontosaurus, and Giganotosaurus from the Cretaceous were bigger animals,” said Christophe Hendrickx. “With a skull of 115 cm, Torvosaurus gurneyi was however one of the largest terrestrial carnivores at this epoch, and an active predator that hunted other large dinosaurs, as evidenced by blade shape teeth up to 10 cm.” Fossil evidences of closely related dinosaurs suggest that this large predator may have already been covered with proto-feathers. Recently described dinosaur embryos from Portugal are also ascribed to the new species of Torvosaurus.
Comments Off on New dinosaur found in Portugal