September 19th, 2016
When roboticists create behaviors for teams of robots, they first build algorithms that focus on the intended task. Then they wrap safety behaviors around those primary algorithms to keep the machines from running into each other. Each robot is essentially given an invisible bubble that other robots must stay away from. As long as nothing touches the bubble, the robots move around without any issues. But that’s where the problems begin.
“When you have too many robots together, they get so focused on not colliding with each other that they eventually just stop moving,” said Georgia Tech roboticist Magnus Egerstedt, director of Georgia Tech’sInstitute of Robotics and Intelligent Machines. “Their safety behaviors take over and the robots freeze. It’s impossible for them to go anywhere because any movement would cause their bubbles to pop.”
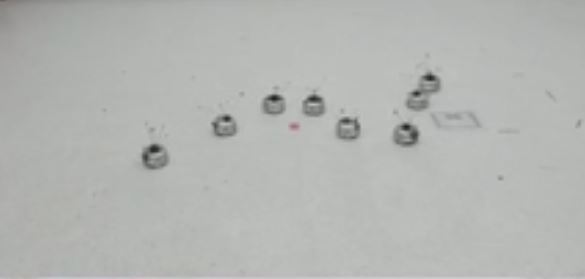
Swarm of robots might collide with each other when performing complicated tasks. It’s often hard to plan swarm behavior with non-intrusive collision avoidance. This video shows how a minimally invasive safety controller can be added in order for safety and higher-level objectives to be achieved simultaneously.
Egerstedt has created a solution. His team’s new algorithms allow any number of robots to move within inches of each other, without colliding, to complete their task — swapping locations on his lab floor. They are the first researchers to create such minimally invasive safety algorithms.In technical speak, the bots are using a set of safe states and barrier certificates to ensure each stays in its own safe set throughout the entire maneuver.
“In everyday speak, we’ve shrunk the size of each robot’s bubble to make it as small as possible,” said Egerstedt, who is also the Julian T. Hightower Chair in the School of Electrical and Computer Engineering. “Our system allows the robots to make the minimum amount of changes to their original behaviors in order to accomplish the task and not smack into each other.”

Credit: Georgia Tech
In a demo with four robots, the lab’s machines approach from four different areas, meet in the middle, circle counterclockwise within inches of each other, then fan out into opposite directions. In another demonstration, eight robots perform the same task, this time circling clockwise before dispersing. Instead of keeping their distance and taking the long way around their neighbors, the robots move very independently wherever they wish.
Avoiding collisions isn’t anything new in robotics. And Google’s self-driving cars are almost crash-free.
“But we haven’t seen thousands of autonomous cars on the road together yet,” Egerstedt said.
“Robots are very conservative — they want to make sure they’re safe. You couldn’t pack the interstate with self-driving cars with today’s technology.”
Egerstedt also said something similar to these algorithms could be used for the next generation of air traffic control. Instead of people directing the flow, planes will be given the authority in airspaces.
“They’ll have to be safer if we plan to pack the airspace more densely.”
The paper about the project, “Multi-objective Compositions for Collision-Free Connectivity Maintenance in Teams of Mobile Robots,” has been accepted at this year’sIEEE Conference on Decision and Control in Las Vegas.
The work is supported in part by the National Science Foundation (grant numbers 1544332 and 1239055). Any opinions, findings, and conclusions or recommendations expressed in this material are those of the authors and do not necessarily reflect the views of the sponsors.
Comments Off on Swarm of robots learns to work together without colliding
September 19th, 2016
Alton Parrish.
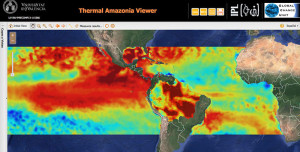
A study led by researchers at the Global Change Unit at the Universitat de València (UV) shows the impact the current 2015/2016 El Niño is having in Amazonia. Areas of extreme drought and changes to their typical distribution in the region are among the most evident consequences.
The El Niño effect is part of a cycle of global heating and cooling associated with the changing temperatures of a band of ocean water in the central and east-central equatorial Pacific ocean. Repeating every three to five years, it is one of the main drivers of climate variability. Although its consequences are felt at the global level, its impact on tropical forests – particularly the Amazon rainforests – are considered particularly significant, since this ecosystem is considered one of the planet’s main carbon sinks.
El Niño, Thermal Imaging, Amazonia,
Credit: Universitat de València
Some El Niño events, like those of 1982/1983 and, especially, 1997/1998, are stronger than average. In 2014 alarm bells started ringing at the possibility of another such ‘Mega Niño’, as they are known, though ultimately not all of the necessary conditions converged. However, in 2015 they all fell into place, leading to the current 2015/2016 event, which, coupled with the trend of global warming, is proving more extreme than any on record.
The study, by researchers at the Universitat de València and published in Scientific Reports, shows how the current El Niño event is associated with an unprecedented heating of Amazonia, reaching the highest temperature in the last forty years and, probably, the last century. Additionally, extreme drought has hit a much larger area of this region than usual and is distributed atypically, with extremely dry conditions in the northeast and unusual wetting in the southeast (something which occurred in 2009/2010, though to a lesser extent).
According to the UV scientists, this fact, not observed in the 1982/1983 and 1997/1998 events, implies that, the more the central equatorial Pacific is heated, the more marked the difference between and distribution of the wet zones and areas of extreme drought in the Amazon rainforest.
Some studies associate the current context of global warming to a greater frequency of these stronger El Niño event, although no clear consensus exists among scientists. The severity of the impact of these extreme drought events on tropical forests has to do with the lower absorption rate of atmospheric CO2, as well as an increased risk of fires and the consequent loss of biomass.
Currently the temperature of the Pacific ocean is neutral, with odds at slightly over 50% of entering La Niña, the cold phase of this natural global climate cycle. However, the drought is expected to continue over the coming months.
The research behind this study was carried out using climate data and temperature and rainfall records generated by the European Centre of Medium Range Weather Forecasts, the Met Office Hadley Centre and the University of East Anglia’s Climate Research Unit, as well as satellite imagery. Some of these data are available on the Termal Amazoni@, developed by the UV’s Global Change Unit.
Taking part in this research were: Juan Carlos Jiménez Muñoz and José Antonio Sobrino, from the Global Change Unit, based at the Image Processing Lab at the University’s Science Park. They were joined by scientists from the University of Chile, University of Leeds, University of Maryland, Geophysical Institute of Peru, University of Oxford and Royal Netherlands Meteorological Institute (KNMI).
The study was published in Scientific Reports, from the Nature publishing group.
Comments Off on El Niño and global warming combine to cause extreme drought in the amazon rain forest
September 14th, 2016
Computers are important tools in everyday life, whether as PC or smartphone. In the future, they will increasingly be incorporated in everyday objects and support users wearing the smart watches, display goggles, sensor clothing, among other things. This trend of digitization will be discussed by scientists, product vendors, fashion designers, and users at the ISWC/UBICOMP conference that will be co-organized by KIT from September 12 to 16, 2016, in Heidelberg.
Luminous fibers produce changing tartan patterns on clothing.
Photo: L. Fraguada/E. Bigger
“Computer systems are part of our everyday life,” Professor Michael Beigl of KIT emphasizes. He is co-organizer of the ISWC/UBICOMP conference. “In the future, computers will be increasingly incorporated in objects and in the environment and will open up a variety of uses.” A well-known example is the “sensor screw” for Industry 4.0. It monitors the status of machines, plans maintenance intervals, and provides advice with respect to repairs. “Such technologies in our households might reduce the costs of repairing a toaster instead of throwing it away and buying a new one.”
Ubiquitous computers are in the focus of both conferences ISWC (International Symposium on Wearable Computers) and UbiComp (ACM International Joint Conference on Pervasive and Ubiquitous Computing). These conferences are deemed the internationally leading event for computer systems worn on the body and in clothing and integrated into objects. ISWC/UBICOMP will bring together about 800 experts from science, industry, and fashion design. The accompanying gadget show will present latest ideas, technologies, and prototypes. At the industry exhibition, Microsoft, TekGear, and Telekom, among others, will exhibit marketable technologies.
The conference will deal among others on the following topics: Displays, indoor location, augmented reality, virtual reality, augmenting human cognition, internet of things, telemedicine, and many more.
Comments Off on Computer clothing?
September 14th, 2016
Yesterday Rice University computer scientist Dan Wallach warned that the American election systems face “credible cyber-threats” and urged the need for a contingency plan during a testimony before the U.S. House Committee on Science, Space and Technology in Washington, D.C.
Dab Wallach
The hearing “Protecting the 2016 Elections from Cyber and Voting Machine Attacks” reviewed the current voluntary guidelines for protecting voting and election systems and whether such guidelines and protections are being effectively implemented in advance of the upcoming elections.
“We must ask ourselves the same sorts of questions that arise in any security analysis,” Wallach said. “Does the adversary have the means, motive and opportunity to have their desired effect, and do we have the necessary defenses and/or contingency plans to mitigate them?”
Wallach, who is a professor of computer science and of electrical and computer engineering and a scholar at Rice’s Baker Institute for Public Policy, is an expert on voting machine security. He has vocalized his viewpointin the media in recent months following allegations of Russian intrusions into the United States election systems.
“We’ve learned that Russia may have been behind leaked Democratic National Committee emails, explicitly to manipulate our elections,” Wallach said. “And they need not attack every county in every state. It’s sufficient for them to go after ‘battleground’ states, where a small nudge can have a large impact.”
While the hearing aimed to address the current voter-database security landscape as well as future protection developments, Wallach warned that the current systems for voter registration, casting and tabulation cannot be replaced before November to make a difference.
“It’s far too late to change the technologies upon which we will cast our votes,” Wallach said. “My best advice is that we need contingency planning.”
In his testimony, Wallach also addressed his proposed technology solution for future elections.
“New hybrid voting systems, with electronic user interfaces and printed paper ballots … have the potential to substantially reduce costs and improve the security of our elections,” he said.
After providing remarks, Wallach took questions from the committee.
Wallach was joined to testify before the committee by Charles Romine, director of the Information Technology Laboratory at the National Institute of Standards and Technology; Tom Schedler, Louisiana secretary of state; and David Becker, executive director of the Center for Election Innovation and Research.
Lamar Smith, R-Texas, chairs the Committee on Science, Space and Technology; the committee’s ranking member is Eddie Bernice Johnson, D-Texas.
Wallach’s research includes computer security topics, ranging from web browsers, servers and networks to electronic voting systems security and smartphones.
Comments Off on American Election Systems Face “Credible Cyber-Threats” Expert Tells Congress
September 7th, 2016
By Alton Parrish.
Shrink rays may exist only in science fiction, but similar effects are at work in the real world at the National Institute of Standards and Technology (NIST).
After successfully miniaturizing both clocks and magnetometers based on the properties of individual atoms, NIST physicists have now turned to precision gyroscopes, which measure rotation.
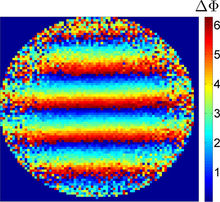
NIST’s compact gyroscope measures rotation by analyzing patterns of interfering matter waves in an expanding cloud of atoms transitioning between two energy states. Each atom’s speed determines both its final position in the cloud and the size of the rotational signal that shifts the interference patterns. Thus, rotations generate interfering bands of atoms across images of the final cloud. The color coding indicates how much the interference patterns shift in radians, the standard unit of angular measure. The orientation of the interfering bands (horizontal in the image) indicates the rotation axis. The rotation rate, determined by an analysis of the band spacing, is 44 milliradians per second.

The NIST team has demonstrated(link is external) a compact atomic gyroscope design that could, with further development, be portable, low power, and accurate enough to be used for navigation. Gyroscopes, traditionally based on mechanical components that spin or vibrate, are common in navigation applications and are increasingly used in consumer electronics such as smartphones. The new NIST device might find uses in applications requiring ultra-precise navigation with extreme size, weight and power limits, such as on spacecraft or submarines.
As a bonus, the NIST gyroscope can also simultaneously measure acceleration. A combination gyro/accelerometer enables navigation by “dead reckoning,” without reference to external landmarks or stars.
The NIST gyro’s glass atom chamber is just 3.5 cubic centimeters in size. The entire experimental setup, including low-power lasers and optics, is currently tabletop sized, but NIST researchers aim to shrink the whole apparatus down to a portable cube about the size of a mini refrigerator.
Described in Applied Physics Letters(link is external), the NIST gyro is an atom interferometer. It is based on an expanding cloud of laser-cooled atoms, a technique originally demonstrated at Stanford University in a 10-meter-high “fountain” of atoms. Traditional optical interferometry involves combining or “interfering” the electromagnetic waves in light and then extracting information about the original light paths from the resulting wave patterns. Similarly, atom interferometers—taking advantage of the fact atoms act as both particles and waves—interfere these waves to measure the forces on atoms. When atoms speed up or rotate, their matter waves shift and interfere in predictable ways, visible in interference patterns.
The heart of the NIST gyroscope is a small glass chamber containing a sample of about 8 million cold rubidium atoms that are trapped and released. While the atoms fall under gravity, a laser beam causes them to transition between two energy states. This process involves absorption and emission of light particles, which gives the atoms momentum and causes their matter waves to separate and later recombine to interfere.
The cold atom cloud expands to as much as 5 times its initial size during the 50 millisecond (thousandths of a second) measurement sequence, which creates a correlation between each atom’s speed and its final position. Rotations are simulated by tilting a mirror below the chamber. The interference effect on an atom depends on its speed, so rotations generate interfering bands of atoms across images of the final cloud.
The atoms are imaged by shining a second, weak laser beam through the cloud. Because atoms in different energy states absorb light of different frequencies, the final energy state of the atoms can be detected. The resulting images show interference bands of atom populations in the two different energy states. The rotation rate and rotation axis are measured by analyzing the spacing and direction of the interference bands across the atom cloud. Acceleration is deduced from changes in the central band. The interferometer is sensitive to acceleration along the direction of the light and sensitive to rotations perpendicular to the light.
“Usually, a combination gyroscope/accelerometer requires two separate sources of atoms,” project leader Elizabeth Donley said. “The NIST version gets both signals simultaneously from a single expanding cloud of atoms, an approach that may ultimately lead to dramatically simpler devices.”
Atomic gyroscopes generate less bias (or signal when not rotating, a type of error) than conventional precision gyroscopes, which use ring lasers. The NIST system is not only smaller but also simpler than other similar atom interferometers.
The NIST research group has been working on various mini-gyroscope designs for a decade. In years past, they have fielded interest in mini-gyroscopes for use in locations where satellite navigation is compromised due to unintentional interference or intentional jamming.
Comments Off on Atomic gyroscope design enables navigation by dead reckoning
September 7th, 2016
Alton Parrish.
American alligators and South African crocodiles populate waterways a third of the globe apart, and yet both have detectable levels of long-lived industrial and household compounds for nonstick coatings in their blood, according to two studies from researchers at the Hollings Marine Laboratory (HML) in Charleston, South Carolina, and its affiliated institutions, which include the National Institute of Standards and Technology (NIST).
Production of some compounds in this family of environmentally persistent chemicals—associated with liver toxicity, reduced fertility and a variety of other health problems in studies of people and animals—has been phased out in the United States and many other nations. Yet all blood plasma samples drawn from 125 American alligators across 12 sites in Florida and South Carolina contained at least six of the 15 perfluorinated alkyl acids (PFAAs) that were tracked in the alligator study.
This crocodile inhabits waters around Flag Boshielo Dam, a reservoir on the Oliphants River, just upstream from South Africa’s Kruger National Park. Researchers from the Hollings Marine Laboratory reported at least four types of perfluorinated alkyl acids in plasma samples drawn from 45 crocodiles at five sites in and around the park. The highest levels were found in animals living in the reservoir.Credit:

John Bowden/HML
The two studies are first-of-their-kind examinations of PFAA levels in “sentinel” reptile species, especially useful for investigating the impacts of long-lived chemicals in the environment. PFAAs have been used in products that include water-repellent clothes, stain repellents, waxes, nonstick pans and fire-suppressing foams.
In alligators, plasma levels of perfluorooctane sulfonate (PFOS) ranged from 1,360 to 452,000 parts per trillion. In May 2016, the Environmental Protection Agency issued a drinking-water health advisory(link is external)for PFOS and another PFAA, recommending a maximum exposure level of 70 parts per trillion for one of the PFAAs or the sum of the two. High PFOS levels reported for alligators at several sites may suggest the need to test drinking water for contamination at those locations, according to the researchers.
In a separate study, researchers report that all samples drawn from 45 crocodiles at five sites in and around South Africa’s Kruger National Park contained detectable levels of four PFAAs, often in different combinations with other of the 15 fluorinated organic compounds tracked. Present in all plasma samples, PFOS levels ranged from 776 to 118,000 parts per trillion.
“Alligators and crocodiles play a dominant role in their ecosystems,” said Jacqueline Bangma, of the Medical University of South Carolina in Charleston. “Similar to humans, they are long-lived top predators. They stay in a select territory—waterways where runoff from human activities accumulates— and their PFAA burden increases through the consumption of fish.”
To date, field studies of PFAA levels and health effects in reptiles have been few, focusing mostly on sea turtles. Across studies of animals—from rats to frogs to marine mammals—plasma levels, time required to eliminate PFAAs from the body, and health effects vary greatly, making it difficult to extrapolate from one species to another.
The landmark studies were initiated by the Hollings Marine Laboratory, a partnership including NIST, NOAA’s National Ocean Service, the South Carolina Department of Natural Resources, the College of Charleston, and the Medical University of South Carolina. Plans are to continue PFAA monitoring on both continents, according to NIST research chemist Jessica Reiner.
Both studies identified “hot spots,” where PFAA levels were significantly higher than in animals tested at other sites, an indication that the contaminants were emitted by a nearby source. In the U.S. study, median plasma levels of certain PFAAs were highest in alligators on Kiawah Island, an Atlantic Ocean barrier island southwest of Charleston, South Carolina, and on Merritt Island in Florida.
Past use of PFAA-containing foams such as those employed in firefighting training may account for the higher levels, the researchers suggest. High environmental concentrations have been reported at fire-training sites and at manufacturing plants.
In contrast, alligators at two sites in the Florida Everglades exhibited some of the lowest levels of the two “highest burden” PFAAs reported across all adult alligators sampled in the U.S. study. The result was somewhat unexpected, Reiner said, because Everglade’s alligators have been reported to have some of the highest levels of mercury, a toxic heavy metal, among Florida alligators.
Among the South African crocodiles tested, PFAA levels were highest for animals tested from Flag Boshielo Dam, a reservoir on the Oliphants River, just upstream from Kruger National Park.
Among the American alligators studied, some PFAA levels tended to be higher among males, regardless of locations. Levels also tended to increase with age, as determined by snout length. Age- and sex-related associations with PFAA levels were not found in the crocodiles sampled.
Comments Off on American alligators and South African crocodiles contaminated with chemicals
August 27th, 2016
By Alton Parrish.
Every year, humans advance climate change and global warming – and quite likely our own eventual extinction – by injecting about 30 billion tonnes of carbon dioxide into the atmosphere.
A team of scientists from the University of Toronto (U of T) believes they’ve found a way to convert all these emissions into energy-rich fuel in a carbon-neutral cycle that uses a very abundant natural resource: silicon. Silicon, readily available in sand, is the seventh most-abundant element in the universe and the second most-abundant element in the earth’s crust.

The idea of converting carbon dioxide emissions to energy isn’t new: there’s been a global race to discover a material that can efficiently convert sunlight, carbon dioxide and water or hydrogen to fuel for decades. However, the chemical stability of carbon dioxide has made it difficult to find a practical solution.
“A chemistry solution to climate change requires a material that is a highly active and selective catalyst to enable the conversion of carbon dioxide to fuel. It also needs to be made of elements that are low cost, non-toxic and readily available,” said Geoffrey Ozin, a chemistry professor in U of T’s Faculty of Arts & Science, the Canada Research Chair in Materials Chemistry and lead of U of T’s Solar Fuels Research Cluster.
Geoffrey Ozin and his colleagues believe they have found a way to convert CO₂ emissions into energy-rich fuel
In an article in Nature Communications published August 23, Ozin and colleagues report silicon nanocrystals that meet all the criteria. The hydride-terminated silicon nanocrystals – nanostructured hydrides for short – have an average diameter of 3.5 nanometres and feature a surface area and optical absorption strength sufficient to efficiently harvest the near-infrared, visible and ultraviolet wavelengths of light from the sun together with a powerful chemical-reducing agent on the surface that efficiently and selectively converts gaseous carbon dioxide to gaseous carbon monoxide.
The potential result: energy without harmful emissions.
“Making use of the reducing power of nanostructured hydrides is a conceptually distinct and commercially interesting strategy for making fuels directly from sunlight,” said Ozin.
The U of T Solar Fuels Research Cluster is working to find ways and means to increase the activity, enhance the scale, and boost the rate of production. Their goal is a laboratory demonstration unit and, if successful, a pilot solar refinery
Comments Off on Scientists Solve Puzzle of Converting Gaseous Carbon Dioxide to Fuel with Nanotechnology
August 27th, 2016
By Alton Parrish.
Astronomers have used data from NASA’s Chandra X-ray Observatory to make a discovery that may have profound implications for understanding how the magnetic field in the Sun and stars like it are generated.
Researchers have discovered that four old red dwarf stars with masses less than half that of the Sun are emitting X-rays at a much lower rate than expected.
X-ray emission is an excellent indicator of a star’s magnetic field strength so this discovery suggests that these stars have much weaker magnetic fields than previously thought.

Since young stars of all masses have very high levels of X-ray emission and magnetic field strength, this suggests that the magnetic fields of these stars weakened over time. While this is a commonly observed property of stars like our Sun, it was not expected to occur for low-mass stars, as their internal structure is very different.
The Sun and stars like it are giant spheres of superheated gas. The Sun’s magnetic field is responsible for producing sunspots, its 11-year cycle, and powerful eruptions of particles from the solar surface. These solar storms can produce spectacular auroras on Earth, damage electrical power systems, knock out communications satellites, and affect astronauts in space.
“We have known for decades that the magnetic field on the Sun and other stars plays a huge role in how they behave, but many details remain mysterious,” said lead author Nicholas Wright of Keele University in the United Kingdom. “Our result is one step in the quest to fully understand the Sun and other stars.”
The rotation of a star and the flow of gas in its interior both play a role in producing its magnetic field. The rotation of the Sun and similar stars varies with latitude (the poles versus the equator) as well as in depth below the surface. Another factor in the generation of magnetic field is convection. Similar to the circulation of warm air inside an oven, the process of convection in a star distributes heat from the interior of the star to its surface in a circulating pattern of rising cells of hot gas and descending cooler gas.

Convection occurs in the outer third (by radius) of the Sun, while the hot gas closer to the core remains relatively still. There is a difference in the speed of rotation between these two regions. Many astronomers think this difference is responsible for generating most of the magnetic field in the Sun by causing magnetic fields along the border between the convection zone and the core to wind up and strengthen. Since stars rotate more slowly as they age, this also plays a role in how the magnetic field of such stars weakens with time
“In some ways you can think of the inside of a star as an incredibly complicated dance with many, many dancers,” said co-author Jeremy Drake of the Harvard-Smithsonian Center for Astrophysics in Cambridge, Mass. “Some dancers move with each other while others move independently. This motion generates magnetic field, but how it works in detail is extremely challenging to determine.”
For stars much less massive than the Sun, convection occurs all the way into the core of the star. This means the boundary between regions with and without convection, thought to be crucial for generating magnetic field in the Sun, does not exist. One school of thought has been that magnetic field is generated mostly by convection in such stars. Since convection does not change as a star ages, their magnetic fields would not weaken much over time.
By studying four of these low-mass red dwarf stars in X-rays, Wright and Drake were able to test this hypothesis. They used NASA’s Chandra X-ray Observatory to study two of the stars and data from the ROSAT satellite to look at two others.
“We found that these smaller stars have magnetic fields that decrease as they age, exactly as it does in stars like our Sun,” said Wright. “This really goes against what we would have expected.”
These results imply that the interaction along the convection zone-core boundary does not dominate the generation of magnetic field in stars like our Sun, since the low mass stars studied by Wright and Drake lack such a region and yet their magnetic properties are very similar.
A paper describing these results by Wright and Drake appears in the July 28th issue of the journal Nature. NASA’s Marshall Space Flight Center in Huntsville, Alabama, manages the Chandra program for NASA’s Science Mission Directorate in Washington. The Smithsonian Astrophysical Observatory in Cambridge, Massachusetts, controls Chandra’s science and flight operations.
An interactive image, a podcast, and a video about the findings are available at:
http://chandra.si.edu
Headquartered in Cambridge, Mass., the Harvard-Smithsonian Center for Astrophysics (CfA) is a joint collaboration between the Smithsonian Astrophysical Observatory and the Harvard College Observatory. CfA scientists, organized into six research divisions, study the origin, evolution and ultimate fate of the universe.
Comments Off on New Insight into Magnetic Field of Our Sun and its Kin
August 26th, 2016
By Alton Parrish.
Ecole Polytechnique Fédérale De Lausanne (EPFL) scientists have invented a new type of “acoustic prism” that can split a sound into its constituent frequencies. Their acoustic prism has applications in sound detection.
Almost 400 years ago, Newton showed that a prism could split white light into the colors of the rainbow, with each colour corresponding to a different wave frequency. Such an “optical prism” relies on a physical phenomenon (refraction) to split light into its constituent frequencies.
Now, a prism exists for sound. Hervé Lissek and his team at EPFL have invented an “acoustic prism” that splits sound into its constituent frequencies using physical properties alone. Its applications in sound detection are published in the Journal of the Acoustical Society of America.

The acoustic prism is entirely man-made, unlike optial prisms, which occur naturally in the form of water droplets. Decomposing sound into its constituent frequencies relies on the physical interaction between a sound wave and the structure of the prism. The acoustic prism modifies the propagation of each individual frequency of the sound wave, without any need of computations or electronic components.
The acoustic prism
The acoustic prism looks like a rectangular tube made of aluminum, complete with ten, perfectly aligned holes along one side. Each hole leads to an air-filled cavity inside the tube, and a membrane is placed between two consecutive cavities.
When sound is directed into the tube at one end, high-frequency components of the sound escape out of the tube through the holes near the source, while low frequencies escape through the holes that are further away, towards the other end of the tube. Like light through an optical prism, the sound is dispersed, with the dispersion angle depending on the wave’s frequency.
The membranes are key, since they vibrate and transmit the sound to the neighboring cavities with a delay that depends on frequency. The delayed sound then leaks through the holes and towards the exterior, dispersing the sound.

To take the concept a step further, the researchers realized that they could use the acoustic prism as an antenna to locate the direction of a distant sound by simply measuring its frequency. Since each dispersion angle corresponds to a particular frequency, it’s enough to measure the main frequency component of an incoming sound to determine where it is coming from, without actually moving the prism.
The principle of the acoustic prism relies on the design of cavities, ducts and membranes, which can be easily fabricated and even miniaturized, possibly leading to cost-effective angular sound detection without resorting to expensive microphone arrays or moving antennas.
Comments Off on Acoustic Prism Invented, Can Split a Sound into Its Constituent Frequencies
August 26th, 2016
By Alton Parrish.
A new look at the debris from an exploded star in our galaxy has astronomers re-examining when the supernova actually happened. Recent observations of the supernova remnant called G11.2-0.3 with NASA’s Chandra X-ray Observatory have stripped away its connection to an event recorded by the Chinese in 386 CE.

Historical supernovas and their remnants can be tied to both current astronomical observations as well as historical records of the event. Since it can be difficult to determine from present observations of their remnant exactly when a supernova occurred, historical supernovas provide important information on stellar timelines. Stellar debris can tell us a great deal about the nature of the exploded star, but the interpretation is much more straightforward given a known age.

New Chandra data on G11.2-0.3 show that dense clouds of gas lie along the line of sight from the supernova remnant to Earth. Infrared observations with the Palomar 5-meter Hale Telescope had previously indicated that parts of the remnant were heavily obscured by dust. This means that the supernova responsible for this object would simply have appeared too faint to be seen with the naked eye in 386 CE. This leaves the nature of the observed 386 CE event a mystery.
A new image of G11.2-0.3 is being released in conjunction with this week’s workshop titled “Chandra Science for the Next Decade” being held in Cambridge, Massachusetts. While the workshop will focus on the innovative and exciting science Chandra can do in the next ten years, G11.2-0.3 is an example of how this “Great Observatory” helps us better understand the complex history of the Universe and the objects within it

Taking advantage of Chandra’s successful operations since its launch into space in 1999, astronomers were able to compare observations of G11.2-0.3 from 2000 to those taken in 2003 and more recently in 2013. This long baseline allowed scientists to measure how fast the remnant is expanding. Using this data to extrapolate backwards, they determined that the star that created G11.2-0.3 exploded between 1,400 and 2,400 years ago as seen from Earth.
Previous data from other observatories had shown this remnant is the product of a “core-collapse” supernova, one that is created from the collapse and explosion of a massive star. The revised timeframe for the explosion based on the recent Chandra data suggests that G11.2-0.3 is one of the youngest such supernovas in the Milky Way. The youngest, Cassiopeia A, also has an age determined from the expansion of its remnant, and like G11.2-0.3 was not seen at its estimated explosion date of 1680 CE due to dust obscuration. So far, the Crab nebula, the remnant of a supernova seen in 1054 CE, remains the only firmly identified historical remnant of a massive star explosion in our galaxy.
This latest image of G11.2-0.3 shows low-energy X-rays in red, the medium range in green, and the high-energy X-rays detected by Chandra in blue. The X-ray data have been overlaid on an optical field from the Digitized Sky Survey, showing stars in the foreground.
Although the Chandra image appears to show the remnant has a very circular, symmetrical shape, the details of the data indicate that the gas that the remnant is expanding into is uneven. Because of this, researchers propose that the exploded star had lost almost all of its outer regions, either in an asymmetric wind of gas blowing away from the star, or in an interaction with a companion star. They think the smaller star left behind would then have blown gas outwards at an even faster rate, sweeping up gas that was previously lost in the wind, forming the dense shell. The star would then have exploded, producing the G11.2-0.3 supernova remnant seen today.
The supernova explosion also produced a pulsar – a rapidly rotating neutron star – and a pulsar wind nebula, shown by the blue X-ray emission in the center of the remnant. The combination of the pulsar’s rapid rotation and strong magnetic field generates an intense electromagnetic field that creates jets of matter and anti-matter moving away from the north and south poles of the pulsar, and an intense wind flowing out along its equator.
A paper describing this result appeared in the March 9th, 2016 issue of The Astrophysical Journal and is available online. The authors are Kazimierz Borkowski and Stephen Reynolds, both of North Carolina State University, as well as Mallory Roberts from New York University. NASA’s Marshall Space Flight Center in Huntsville, Alabama, manages the Chandra program for NASA’s Science Mission Directorate in Washington. The Smithsonian Astrophysical Observatory in Cambridge, Massachusetts, controls Chandra’s science and flight operations.
Comments Off on Historic Supernova Booted from the Pages of History, Too Faint To Be Seen by Naked Eye by Chinese in 386 CE
August 25th, 2016
By Alton Parrish.
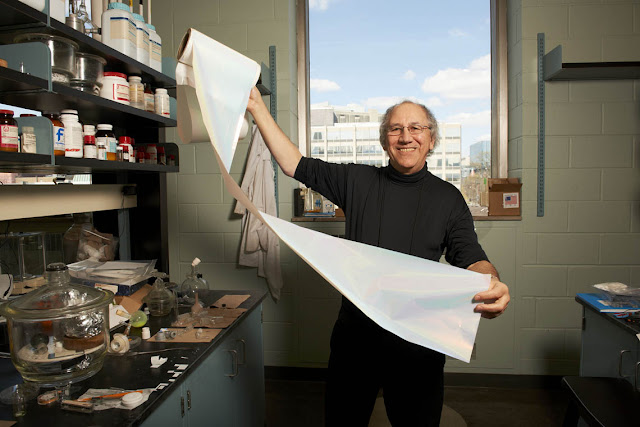
Canada’s tissue manufacturers are now much closer to producing the perfect paper, thanks to new UBC research.
A team working with UBC mechanical engineering professors Sheldon Green and Srikanth Phani have created what is likely the first complete mathematical model of creping, the crinkling process that helps make tissue paper soft and resilient.

“The new model provides a significantly better understanding of the dynamics of the creping process, allowing manufacturers to tailor the process to a greater degree than before,” said Green. “It’s the most accurate model of creping to date.”
During tissue manufacture, pulp is dried on a chemical-coated rotating drum until it’s 95 per cent dry. It’s then pushed off at very high speeds by a sharp creping blade, creating hundreds of microscopic folds that give tissue its softness, flexibility, tearing resistance and strength.
UBC mechanical engineering researchers Srikanth Phani, Kui Pan and Sheldon Green

“With our model, manufacturers can better manipulate the different elements—the chemicals, the pulp, the creping blade angle, the paper speed and so on—to produce the exact product grade they want, from standard grade toilet paper to ultra-premium bathroom rolls,” said Green.
“Previous simulation models were static and didn’t consider the velocity and impact of the dryer,” said Kui Pan, the PhD student who led the mathematical analysis.
The search for the ideal tissue paper is a top concern for the paper industry. Pan’s supervisor, Srikanth Phani, believes their discovery can help paper firms in this quest.

“Canada is a strong player in the billion-dollar global market for tissue products including bathroom rolls, facial tissues, and hygiene products. This new research can contribute to the growth of that industry,” added Phani.
The UBC team worked with scientists from Canadian research organization FPInnovations. The project has received support from the Natural Sciences and Engineering Research Council (NSERC) and, more recently, from Kruger Products, Canada’s leading tissue manufacturer, and creping chemicals manufacturer Solenis.
The research was presented at the 24th International Congress of Theoretical and Applied Mechanics in Montreal on August 21-26.
Comments Off on Seeking the Perfect Toilet Paper
August 25th, 2016
By Alton Parrish.
In less than a week, the spacecraft Juno will arrive at Jupiter, the culmination of a five-year, billion-dollar journey. It’s mission: to peer deep inside the gas giant and unravel its origin and evolution. One of the biggest mysteries surrounding Jupiter is how it generates its powerful magnetic field, the strongest in the solar system.
One theory is that about halfway to Jupiter’s core, the pressures and temperatures become so intense that the hydrogen that makes up 90 percent of the planet — molecular gas on Earth — looses hold of its electrons and begins behaving like a liquid metal. Oceans of liquid metallic hydrogen surrounding Jupiter’s core would explain its powerful magnetic field.
Harvard researchers observed evidence of the transition of hydrogen to metallic hydrogen by squeezing a sample of liquid hydrogen between two diamond tips.

But how and when does this transition from gas to liquid metal occur? How does it behave? Researchers hope that Juno will shed some light on this exotic state of hydrogen — but one doesn’t need to travel all the way to Jupiter to study it.
Four hundred million miles away, in a small, windowless room in the basement of Lyman Laboratory on Oxford Street in Cambridge, Massachusetts, there was, for a fraction of a fraction of a second, a small piece of Jupiter.
Earlier this year, in an experiment about five-feet long, Harvard University researchers say they observed evidence of the abrupt transition of hydrogen from liquid insulator to liquid metal. It is one of the first times such a transition has ever been observed in any experiment.
They published their research in Physical Review B.
“This is planetary science on the bench,” said Mohamed Zaghoo, the NASA Earth & Space Science Fellow at the Harvard John A. Paulson School of Engineering and Applied Sciences (SEAS). “The question of how hydrogen transitions into a metallic state — whether that is an abrupt transition or not — has huge implications for planetary science. How hydrogen transitions inside Jupiter, for example, says a lot about the evolution, the temperature and the structure of these gas giants interiors.”
In the experiment, Zaghoo, Ashkan Salamat, and senior author Isaac Silvera, the Thomas D. Cabot Professor of the Natural Sciences, recreated the extreme pressures and temperatures of Jupiter by squeezing a sample of hydrogen between two diamond tips, about 100 microns wide, and firing short bursts of lasers of increasing intensity to raise the temperature.
This experimental setup is significantly smaller and cheaper than other current techniques to generate metallic hydrogen, most of which rely on huge guns or lasers that generate shock waves to heat and pressurize hydrogen.
The transition of the liquid to metallic hydrogen happens too quickly for human eyes to observe and the sample lasts only a fraction of a second before it deteriorates. So, instead of watching the sample itself for evidence of the transition, the team watched lasers pointed at the sample. When the phase transition occurred, the lasers abruptly reflected.
“At some point, the hydrogen abruptly transitioned from an insulating, transparent state, like glass, to a shiny metallic state that reflected light, like copper, gold or any other metal,” Zaghoo said. “Because this experiment, unlike shock wave experiments, isn’t destructive, we could run the experiment continuously, doing measurements and monitoring for weeks and months to learn about the transition.”
“This is the simplest and most fundamental atomic system, yet modern theory has large variances in predictions for the transition pressure,” Silvera said. “Our observation serves as a crucial guide to modern theory.”
The results represent a culmination of decades of research by the Silvera group. The data collected could begin to answer some of the fundamental questions about the origins of solar systems.
Metallic hydrogen also has important ramifications here on Earth, especially in energy and materials science.
“A lot of people are talking about the hydrogen economy because hydrogen is combustibly clean and it’s very abundant,” said Zaghoo. “If you can compress hydrogen into high density, it has a lot of energy compacted into it.”
“As a rocket fuel, metallic hydrogen would revolutionize rocketry as propellant an order of magnitude more powerful than any known chemical,” said Silvera. “This could cut down the time it takes to get to Mars from nine months to about two months, transforming prospects of human space endeavors.”
Metallic hydrogen could be used to make room temperature or even higher than room temperature super-conductors.
The Juno mission goes hand-in-hand with laboratory experiments into metallic hydrogen, Zaghoo said.
“The measurements of Jupiter’s magnetic field that Juno will be collecting is directly related to our data,” he said. “We’re not in competition with NASA but, in some ways, we got to Jupiter first.”
Comments Off on Oceans of Liquid Metallic Hydrogen Create Jupiter’s Powerful Magnetic Field
August 24th, 2016
By Alton Parrish.
Scientists may be closing in on a way to let consumers savor the sweet taste of cake, cookies and other culinary delights without the sugar rush. In preliminary tests using a new device developed in-house that allows them to screen for odor compounds in real foods, they have isolated several natural aromatic molecules that could be used to trick our brains into believing that desserts and other foods contain more fat, sugar or salt than they actually do.
“Most consumers know that they should be eating more healthful foods made with reduced amounts of fat, sugar and salt. But this is problematic because these are the very ingredients that make many of the foods we like taste so delicious,” says Thierry Thomas-Danguin, Ph.D. “Based on our lab work, we’ve come to believe that aromas can help compensate for the reduction of fat, sugar and salt in healthful foods and make them more appealing to consumers.”
Adding certain aromas to foods made with less fat, sugar or salt could make these products more appealing to consumers.

Aroma plays a vital role in how we perceive food (just try pinching your nose closed while you eat — odds are you won’t taste anything). Based on this fact, food scientists have long used chemical aromatics, essential oils and botanical extracts to enhance the flavor of food and beverages to boost sales.
Recently, scientists have turned their attention to using aromas to improve the taste of foods made with reduced amounts of fat, sugar and salt, which many consumers avoid because of their notoriously bland flavor.
“If you buy a product made with 30 percent less salt, and you don’t like it because it isn’t very tasty, what do you do?” Thomas-Danguin asks. “You’ll probably reach for the table salt and put some into the product. So the target is missed. Our goal is to optimize the reformulation process, so the food industry can produce more healthful products that consumers will like as they are and will choose to eat them regularly.”
In earlier work, Thomas-Danguin set out to prove that if the right aroma is added in the right amount in the right places in the right food, the brain can be fooled into thinking there is more fat, sugar or salt in it. Study participants were asked to taste flan, a type of custard, made in layers containing varying amounts of ham aroma and salt. The researchers found that the ham aroma, even though it contained no salt, increased the perception of saltiness of the flan. In fact, some participants thought one variation of the custard made with ham aroma and salt distributed unevenly in layers throughout it tasted the same as a flan made in the traditional way with 40 percent more salt.
In their latest study, Thomas-Danguin and his colleagues at the Centre des Sciences du Goût de l’Alimentation in France, sought to find a new way to isolate aroma molecules associated with sweet tastes. So they created a first-of-its-kind device called a Gas Chromatograph-Olfactometry Associated Taste (GC-OAT) and used it in conjunction with an olfactoscan, which delivers a continuous stream of aromas through a tube to a subject’s nose.
Participants were asked to smell real fruit juice aroma through the olfactoscan. Meanwhile, the researchers used the GC-OAT to isolate molecules from the juice. Then, they added the molecules one at a time into the olfactoscan tube. As the participants smelled each of these mixtures, they were asked if the molecule contributed to their perceived sweetness of the fruit juice. Thomas-Danguin says the preliminary results suggest that this new technique could eventually help food manufacturers better formulate more healthful foods without sacrificing taste, aroma or texture of the original products.
The researchers presented their work on August 22 at the 252nd National Meeting & Exposition of the American Chemical Society (ACS). ACS, the world’s largest scientific society, is holding the meeting here through Thursday. It features more than 9,000 presentations on a wide range of science topics.
Thomas-Danguin acknowledges funding from EU-FP7, EU-ERDF, EU-MSCA,Unilever R & D Vlaardingen, L.D.C. Group, INRA, Carnot Institute Qualiment andRegional Council of Burgundy.
The American Chemical Society is a nonprofit organization chartered by the U.S. Congress. With nearly 157,000 members, ACS is the world’s largest scientific society and a global leader in providing access to chemistry-related research through its multiple databases, peer-reviewed journals and scientific conferences. Its main offices are in Washington, D.C., and Columbus, Ohio.
Comments Off on Delicious Trick: Machine To Infuse Sweet, Fat and Salty Tastes and Aromas in Healthy Foods to Fool the Brain
August 24th, 2016
By Alton Parrish.
Astronomers studying distant galaxies powered by monster black holes have uncovered an unexpected link between two very different wavelengths of the light they emit, the mid-infrared and gamma rays. The discovery, which was accomplished by comparing data from NASA’s Wide-field Infrared Survey Explorer (WISE) and Fermi Gamma-ray Space Telescope, has enabled the researchers to uncover dozens of new blazar candidates.
Francesco Massaro at the University of Turin in Italy and Raffaele D’Abrusco at the Harvard-Smithsonian Center for Astrophysics in Cambridge, Massachusetts, show for the first time that the mid-infrared colors of blazars in WISE data correlate to an equivalent measurement of their gamma-ray output.
“This connection links two vastly different forms of light over an energy range spanning a factor of 10 billion,” said Massaro. “Ultimately, it will help us decipher how supermassive black holes in these galaxies manage to convert the matter around them into vast amounts of energy.”
Black-hole-powered galaxies called blazars are the most common sources detected by NASA’s Fermi Gamma-ray Space Telescope. As matter falls toward the supermassive black hole at the galaxy’s center, some of it is accelerated outward at nearly the speed of light along jets pointed in opposite directions. When one of the jets happens to be aimed in the direction of Earth, as illustrated here, the galaxy appears especially bright and is classified as a blazar.

Blazars constitute more than half of the discrete gamma-ray sources seen by Fermi’s Large Area Telescope (LAT). At the heart of a blazar lies a supersized black hole with millions of times the sun’s mass surrounded by a disk of hot gas and dust. As material in the disk falls toward the black hole, some of it forms dual jets that blast subatomic particles straight out of the disk in opposite directions at nearly the speed of light. A blazar appears bright to Fermi for two reasons. Its jets produce many gamma rays, the highest-energy form of light, and we happen to be viewing the galaxy face on, which means one of its jets is pointing in our direction.
From January to August 2010, NASA’s WISE mapped the entire sky in four infrared wavelengths, cataloging more than half a billion sources. In 2011, Massaro, D’Abrusco and their colleagues began using WISE data to investigate Fermi blazars.
“WISE made it possible to explore the mid-infrared colors of known gamma-ray blazars,” said D’Abrusco. “We found that when we plotted Fermi blazars by their WISE colors in a particular way, they occupied a distinctly different part of the plot than other extragalactic gamma-ray sources.”
An analysis of blazar properties observed by the Wide-field Infrared Survey Explorer (WISE) and Fermi’s Large Area Telescope (LAT) reveal a correlation in emissions from the mid-infrared to gamma rays, an energy range spanning a factor of 10 billion. When plotted by gamma-ray and mid-infrared colors, confirmed Fermi blazars (gold dots) form a unique band not shared by other sources beyond our galaxy. A blue line marks the best fit of these values. The relationship allows astronomers to identify potential new gamma-ray blazars by studying WISE infrared data.

The scientists detail new aspects of the infrared/gamma-ray connection in a paper published in The Astrophysical Journal on Aug. 9. They say the electrons, protons and other particles accelerated in blazar jets leave a specific “fingerprint” in the infrared light they emit. This same pattern is also clearly evident in their gamma rays. The relationship effectively connects the dots for blazars across an enormous swath of the electromagnetic spectrum.
About a thousand Fermi sources remain unassociated with known objects at any other wavelength. Astronomers suspect many of these are blazars, but there isn’t enough information to classify them. The infrared/gamma-ray connection led the authors to search for new blazar candidates among WISE infrared sources located within the positional uncertainties of Fermi’s unidentified gamma-ray objects. When the researchers applied this relationship to Fermi’s unknown sources, they quickly found 130 potential blazars. Efforts are now under way to confirm the nature of these objects through follow-up studies and to search for additional candidates using the WISE connection.
“About a third of the gamma-ray objects seen by Fermi remained unknown in the most recent catalog, and this result represents an important advance in understanding their natures,” said David Thompson, a Fermi deputy project scientist at NASA’s Goddard Space Flight Center in Greenbelt, Maryland.
Comments Off on NASA’s WISE, Fermi Missions Reveal A Surprising Blazar Connection
August 23rd, 2016
By Alton Parrish.
A future of soft robots that wash your dishes or smart T-shirts that power your cell phone may depend on the development of stretchy power sources. But traditional batteries are thick and rigid — not ideal properties for materials that would be used in tiny malleable devices. In a step toward wearable electronics, a team of researchers has produced a stretchy micro-supercapacitor using ribbons of grapheme.
“Most power sources, such as phone batteries, are not stretchable. They are very rigid,” says Xiaodong Chen, Ph.D. “My team has made stretchable electrodes, and we have integrated them into a supercapacitor, which is an energy storage device that powers electronic gadgets.”
This stretchy supercapacitor made from graphene could spur the development of wearable electronics.
(1)
(2)
Supercapacitors, developed in the 1950s, have a higher power density and longer life cycle than standard capacitors or batteries. And as devices have shrunk, so too have supercapacitors, bringing into the fore a generation of two-dimensional micro-supercapacitors that are integrated into cell phones, computers and other devices. However, these supercapacitors have remained rigid, and are thus a poor fit for soft materials that need to have the ability to elongate.
In this study, Chen of Nanyang Technological University, Singapore, and his team sought to develop a micro-supercapacitor from graphene. This carbon sheet is renowned for its thinness, strength and conductivity. “Graphene can be flexible and foldable, but it cannot be stretched,” he says. To fix that, Chen’s team took a cue from skin. Skin has a wave-like microstructure, Chen says. “We started to think of how we could make graphene more like a wave.”
The researchers’ first step was to make graphene micro-ribbons. Most graphene is produced with physical methods — like shaving the tip of a pencil — but Chen uses chemistry to build his material. “We have more control over the graphene’s structure and thickness that way,” he explains. “It’s very difficult to control that with the physical approach. Thickness can really affect the conductivity of the electrodes and how much energy the supercapacitor overall can hold.”
The next step was to create the stretchable polymer chip with a series of pyramidal ridges. The researchers placed the graphene ribbons across the ridges, creating the wave-like structure. The design allowed the material to stretch without the graphene electrodes of the superconductor detaching, cracking or deforming. In addition, the team developed kirigami structures, which are variations of origami folds, to make the supercapacitors 500 percent more flexible without decaying their electrochemical performance. As a final test, Chen has powered an LCD from a calculator with the stretchy graphene-based micro-supercapacitor. Similarly, such stretchy supercapacitors can be used in pressure or chemical sensors.
In future experiments, the researchers hope to increase the electrode’s surface area so it can hold even more energy. The current version only stores enough energy to power LCD devices for a minute, he says.
The researchers presented their work August 23rd at the 252nd National Meeting & Exposition of the American Chemical Society (ACS). ACS, the world’s largest scientific society, is holding the meeting here through August 25th. It features more than 9,000 presentations on a wide range of science topics.
Chen acknowledges funding from the National Research Foundation, Prime Minister’s Office, Singapore, under its Campus for Research Excellence and Technological Enterprise (CREATE) Programme of Nanomaterials for Energy and Water Management.
The American Chemical Society is a nonprofit organization chartered by the U.S. Congress. With nearly 157,000 members, ACS is the world’s largest scientific society and a global leader in providing access to chemistry-related research through its multiple databases, peer-reviewed journals and scientific conferences. Its main offices are in Washington, D.C., and Columbus, Ohio.
Comments Off on Stretchable Supercapacitors Power Smart Wearable Electronics That Can Power Other Gadgets
August 23rd, 2016
By Alton Parrish.
New NASA-funded research suggests that Jupiter’s Great Red Spot may be the mysterious heat source behind Jupiter’s surprisingly high upper atmospheric temperatures.
Here on Earth, sunlight heats the atmosphere at altitudes well above the surface—for example, at 250 miles above our planet where the International Space Station orbits. Scientists have been stumped as to why temperatures in Jupiter’s upper atmosphere are comparable to those found at Earth, yet Jupiter is more than five times the distance from the sun. They wanted to know: if the sun isn’t the heat source, then what is?

Researchers from Boston University’s Center for Space Physics set out to solve the mystery by mapping temperatures well above Jupiter’s cloud tops using observations from Earth. They analyzed data from the SpeX spectrometer at NASA’s Infrared Telescope Facility (IRTF) on Mauna Kea, Hawaii, a 3-meter infrared telescope operated for NASA by the University of Hawaii. By observing non-visible infrared light hundreds of miles above the gas giant, scientists found temperatures to be much higher in certain latitudes and longitudes in Jupiter’s southern hemisphere, where the spot is located.
“We could see almost immediately that our maximum temperatures at high altitudes were above the Great Red Spot far below—a weird coincidence or a major clue?” said Boston University’s James O’Donoghue, lead author of the study.
The study, in the July 27 issue of the journal Nature, concludes that the storm in the Great Red Spot produces two kinds of turbulent energy waves that collide and heat the upper atmosphere. Gravity waves are much like how a guitar string moves when plucked, while acoustic waves are compressions of the air (sound waves). Heating in the upper atmosphere 500 miles (800 kilometers) above the Great Red Spot is thought to be caused by a combination of these two wave types “crashing,” like ocean waves on a beach.
“The extremely high temperatures observed above the storm appear to be the ‘smoking gun’ of this energy transfer,” said O’Donoghue. “This tells us that planet-wide heating is a plausible explanation for the ‘energy crisis,’ a problem in which upper-atmospheric temperatures are measured hundreds of degrees hotter than can be explained by sunlight alone.”
This effect has been observed over the Andes Mountains here on Earth and may also be happening elsewhere in the outer solar system, though it has not been directly observed. Scientists believe this phenomenon also occurs on giant exoplanets orbiting other stars.
The Great Red Spot (GRS) has delighted and mystified since its discovery in the 17th Century. With its swirl of reddish hues, it’s 2-3 times as wide as Earth and is seen by many as a “perpetual hurricane,” with winds peaking at about 400 miles an hour.
NASA’s Juno spacecraft, which recently arrived at Jupiter, will have several opportunities during its 20-month mission to observe the Great Red Spot and the turbulent region surrounding it. Juno will peer hundreds of miles downward into the atmosphere with its microwave radiometer, which passively senses heat coming from within the planet. This capability will enable Juno to reveal the deep structure of the Great Red Spot, along with other prominent Jovian features, such as the colorful cloud bands.
Comments Off on The Great Red Spot on Jupiter Is Mysteriously Hot
August 22nd, 2016
By Alton parrish.
New research suggests that it is possible to create a new form of light by binding light to a single electron, combining the properties of both.
According to the scientists behind the study, from Imperial College London, the coupled light and electron would have properties that could lead to circuits that work with packages of light – photons – instead of electrons.
It would also allow researchers to study quantum physical phenomena, which govern particles smaller than atoms, on a visible scale.
(1)

Artistic image of light trapped on the surface of a nanoparticle topological insulator.
In normal materials, light interacts with a whole host of electrons present on the surface and within the material. But by using theoretical physics to model the behaviour of light and a recently-discovered class of materials known as topological insulators, Imperial researchers have found that it could interact with just one electron on the surface.
This would create a coupling that merges some of the properties of the light and the electron. Normally, light travels in a straight line, but when bound to the electron it would instead follow its path, tracing the surface of the material.
In the study, published today in Nature Communications, Dr Vincenzo Giannini and colleagues modelled this interaction around a nanoparticle – a small sphere below 0.00000001 metres in diameter – made of a topological insulator.
Their models showed that as well as the light taking the property of the electron and circulating the particle, the electron would also take on some of the properties of the light.
Normally, as electrons are travelling along materials, such as electrical circuits, they will stop when faced with a defect. However, Dr Giannini’s team discovered that even if there were imperfections in the surface of the nanoparticle, the electron would still be able to travel onwards with the aid of the light.
If this could be adapted into photonic circuits, they would be more robust and less vulnerable to disruption and physical imperfections.

Dr Giannini said: “The results of this research will have a huge impact on the way we conceive light. Topological insulators were only discovered in the last decade, but are already providing us with new phenomena to study and new ways to explore important concepts in physics.”
Dr Giannini added that it should be possible to observe the phenomena he has modelled in experiments using current technology, and the team is working with experimental physicists to make this a reality.
He believes that the process that leads to the creation of this new form of light could be scaled up so that the phenomena could observed much more easily. Currently, quantum phenomena can only be seen when looking at very small objects or objects that have been super-cooled, but this could allow scientists to study these kinds of behaviour at room temperature
Comments Off on New Form of Light Possible by Binding Light to Single Electrons
August 22nd, 2016
By Alton Parrish.
A solar storm that jammed radar and radio communications at the height of the Cold War could have led to a disastrous military conflict if not for the U.S. Air Force’s budding efforts to monitor the sun’s activity, a new study finds.
A view of the Sun on May 23, 1967, in a narrow visible wavelength of light called Hydrogen-alpha. The bright region in the top center region of brightness shows the area where the large flare occurred.

On May 23, 1967, the Air Force prepared aircraft for war, thinking the nation’s surveillance radars in polar regions were being jammed by the Soviet Union. Just in time, military space weather forecasters conveyed information about the solar storm’s potential to disrupt radar and radio communications. The planes remained on the ground and the U.S. avoided a potential nuclear weapon exchange with the Soviet Union, according to the new research.
Retired U.S. Air Force officers involved in forecasting and analyzing the storm collectively describe the event publicly for the first time in a new paper accepted for publication in Space Weather, a journal of the American Geophysical Union.
The storm’s potential impact on society was largely unknown until these individuals came together to share their stories, said Delores Knipp, a space physicist at the University of Colorado in Boulder and lead author of the new study. Knipp will give a presentation about the event on August 10, 2016 at the High Altitude Observatory at the National Center for Atmospheric Research in Boulder, Colorado.
The storm is a classic example of how geoscience and space research are essential to U.S. national security, she said.
“Had it not been for the fact that we had invested very early on in solar and geomagnetic storm observations and forecasting, the impact [of the storm] likely would have been much greater,” Knipp said. “This was a lesson learned in how important it is to be prepared.”
Keeping an eye on the sun
The U.S. military began monitoring solar activity and space weather – disturbances in Earth’s magnetic field and upper atmosphere – in the late 1950s. In the 1960s, a new branch of the Air Force’s Air Weather Service (AWS) monitored the sun routinely for solar flares – brief intense eruptions of radiation from the sun’s atmosphere. Solar flares often lead to electromagnetic disturbances on Earth, known as geomagnetic storms, that can disrupt radio communications and power line transmissions.
The AWS employed a network of observers at various locations in the U.S. and abroad who provided regular input to solar forecasters at the North American Aerospace Defense Command (NORAD), a U.S. and Canadian organization that defends and controls airspace above North America. By 1967, several observatories were sending daily information directly to NORAD solar forecasters.
On May 18, 1967, an unusually large group of sunspots with intense magnetic fields appeared in one region of the sun. By May 23, observers and forecasters saw the sun was active and likely to produce a major flare. Observatories in New Mexico and Colorado saw a flare visible to the naked eye while a solar radio observatory in Massachusetts reported the sun was emitting unprecedented levels of radio waves.
A significant worldwide geomagnetic storm was forecast to occur within 36-48 hours, according to a bulletin from NORAD’s Solar Forecast Center in Colorado Springs, Colorado on May 23.
Notes on the region of the sun where the May 1967 solar flare occurred, from May 18, 20, 21, 23, and 28.

Radar ‘jamming’
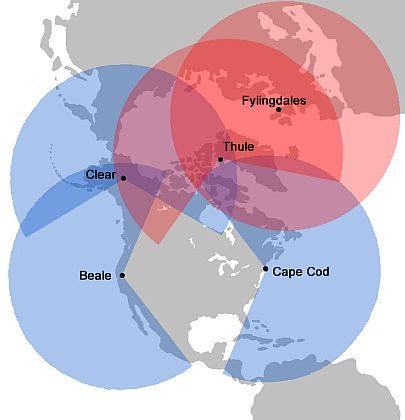
As the solar flare event unfolded on May 23, radars at all three Ballistic Missile Early Warning System (BMEWS) sites in the far Northern Hemisphere were disrupted. These radars, designed to detect incoming Soviet missiles, appeared to be jammed. Any attack on these stations – including jamming their radar capabilities – was considered an act of war.
A map of the three BMEWS sites (Clear Air Force Station, Alaska; Thule Air Base, Greenland; Fylingdales, United Kingdom) designed to detect incoming ballistic missiles. Two PAVE Phased Array Warning System sites (Beale Air Force Base, California and Cape Cod Air Force Station, Massachusetts) are also shown but were not operational during the May 1967 event.
Retired Colonel Arnold L. Snyder, a solar forecaster at NORAD’s Solar Forecast Center, was on duty that day. The tropospheric weather forecaster told him the NORAD Command Post had asked about any solar activity that might be occurring.
“I specifically recall responding with excitement, ‘Yes, half the sun has blown away,’ and then related the event details in a calmer, more quantitative way,” Snyder said.
Along with the information from the Solar Forecast Center, NORAD learned the three BMEWS sites were in sunlight and could receive radio emissions coming from the sun. These facts suggested the radars were being ‘jammed’ by the sun, not the Soviet Union, Snyder said. As solar radio emissions waned, the ‘jamming’ also waned, further suggesting the sun was to blame, he said.
During most of the 1960s, the Air Force flew continuous alert aircraft laden with nuclear-weapons. But commanders, thinking the BMEWS radars were being jammed by the Russians and unaware of the solar storm underway, put additional forces in a “ready to launch” status, according to the study.
“This is a grave situation,” Knipp said. “But here’s where the story turns: things were going horribly wrong, and then something goes commendably right.”
The Air Force did not launch additional aircraft, and the study authors believe information from the Solar Forecasting Center made it to commanders in time to stop the military action, including a potential deployment of nuclear weapons. Knipp, quoting public documents, noted that information about the solar storm was most likely relayed to the highest levels of government – possibly even President Johnson.
The geomagnetic storm, which began about 40 hours after the solar flare and radio bursts, went on to disrupt U.S. radio communications in almost every conceivable way for almost a week, according to the new study. It was so strong that the Northern Lights, usually only seen in or near the Arctic Circle, were visible as far south as New Mexico.
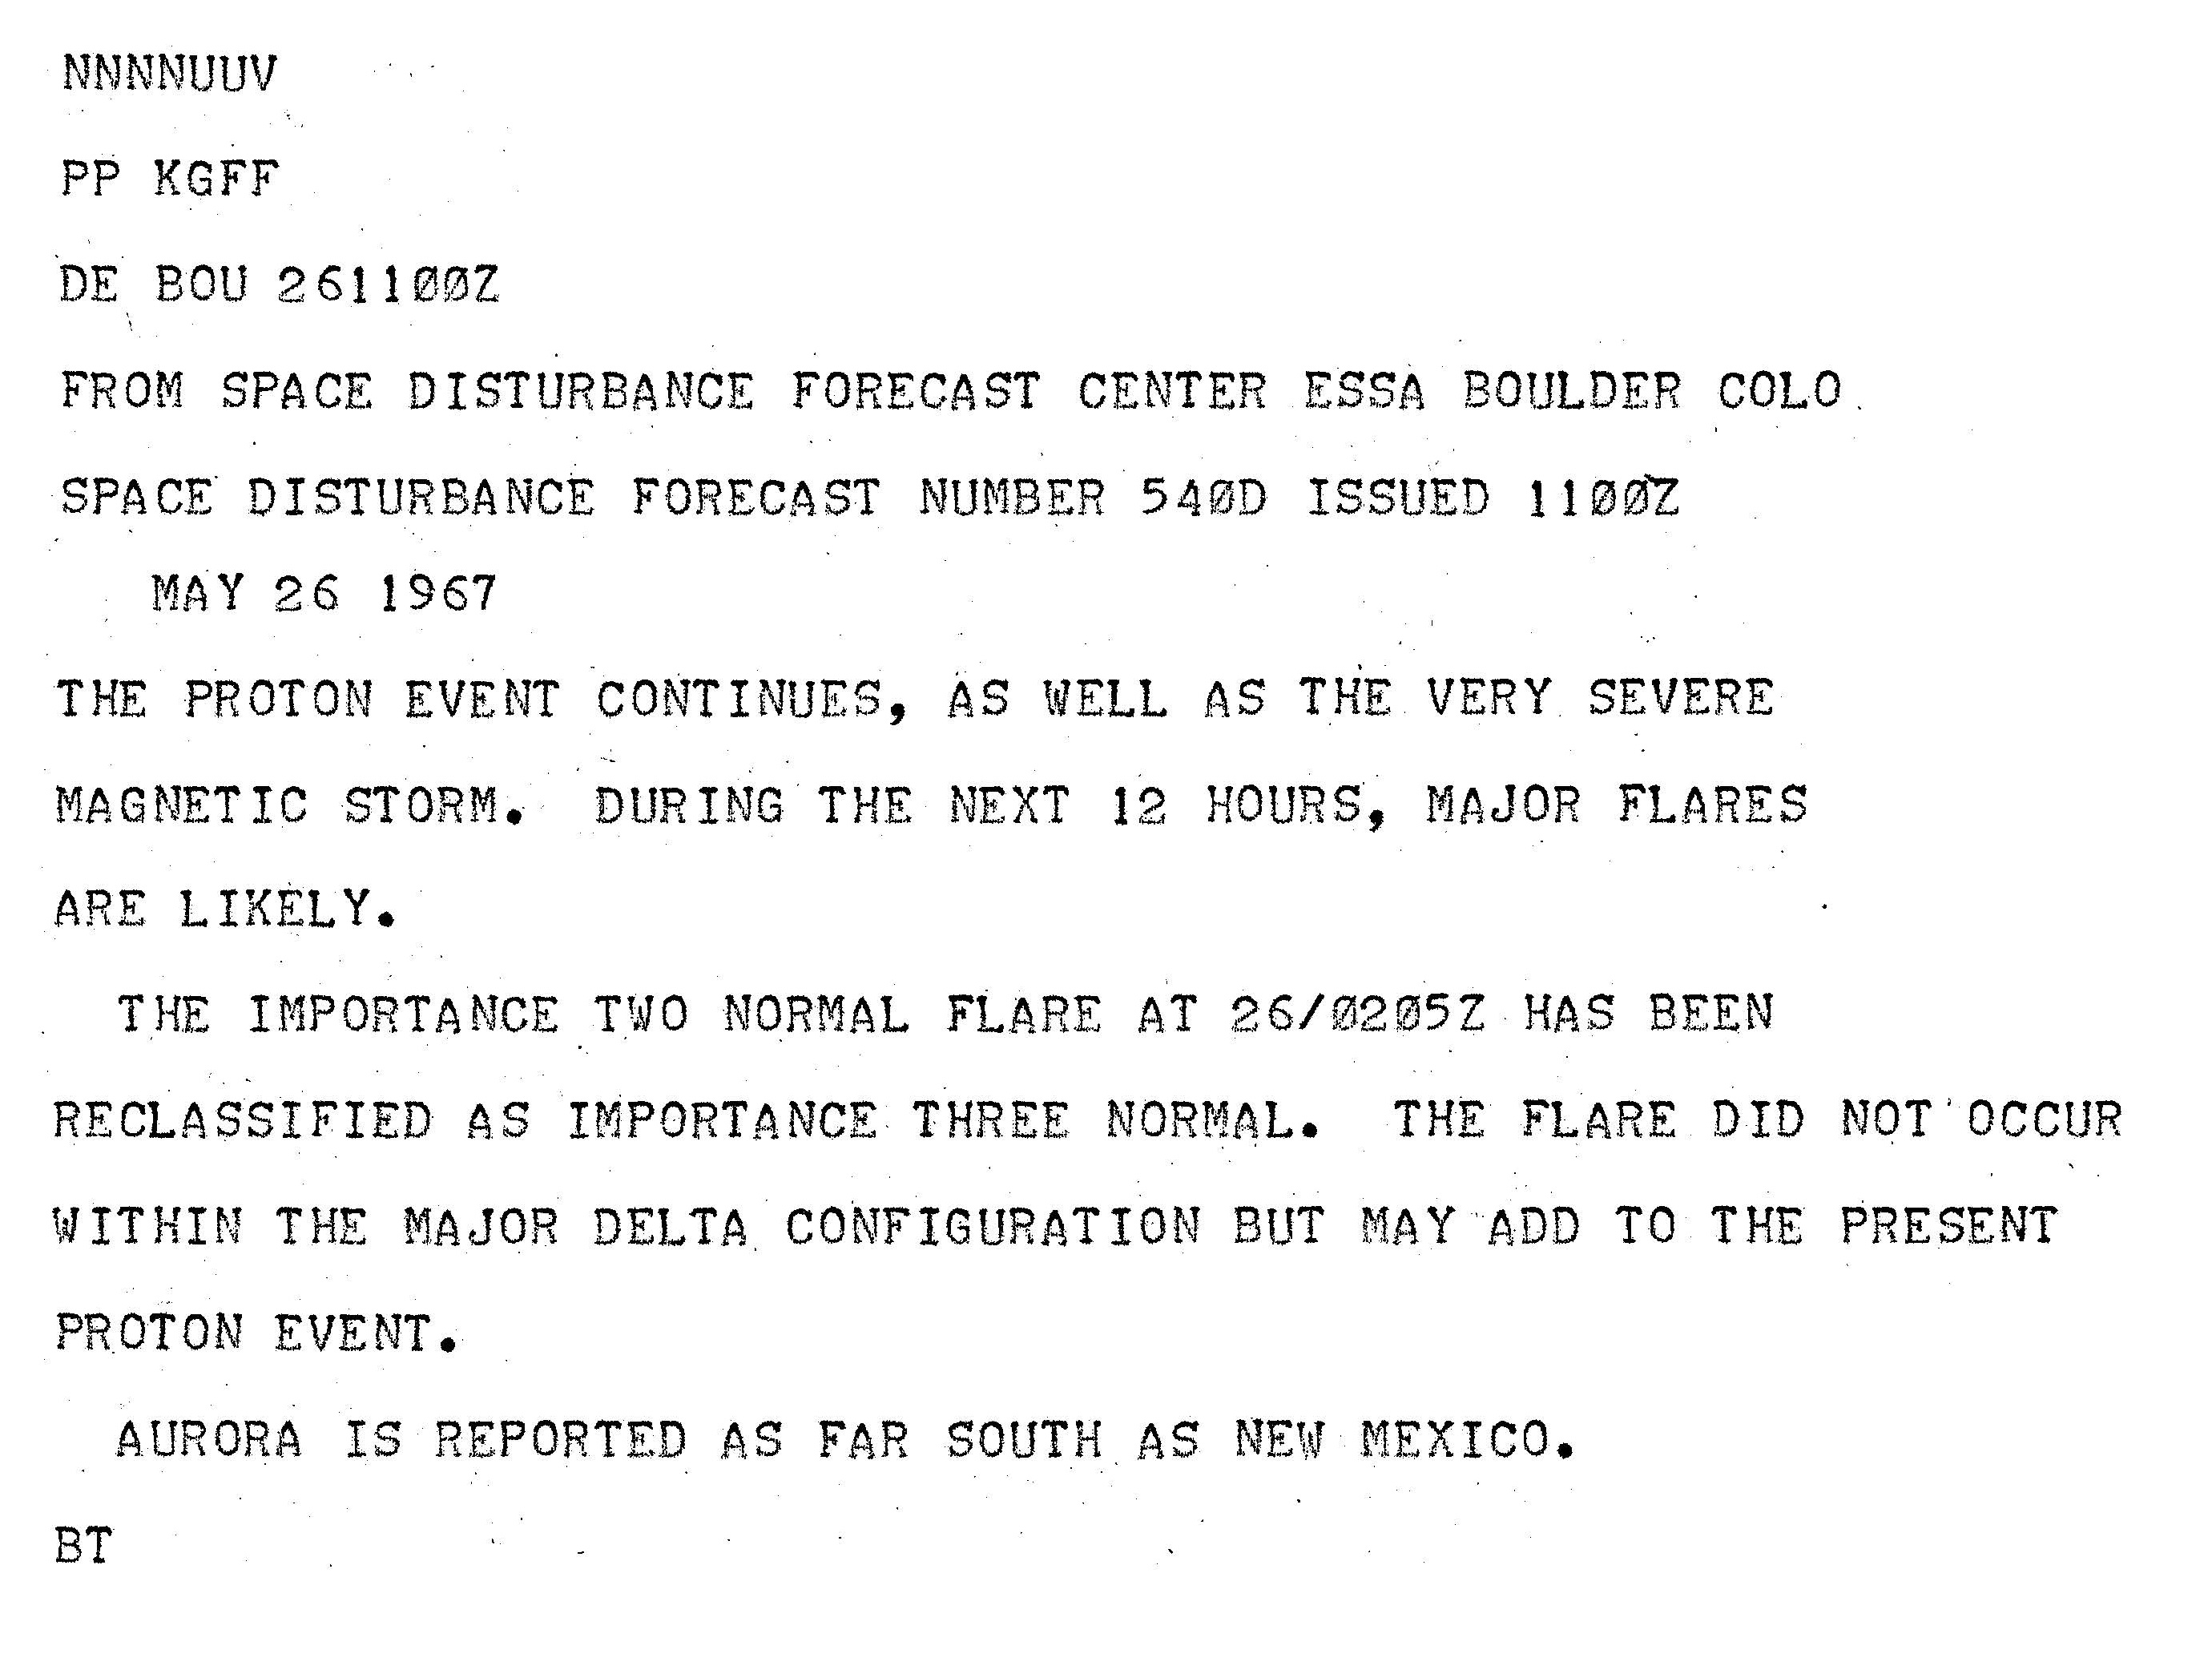
A report of solar activity on May 26 from the Space Disturbance Forecast Center, a civilian forecasting center at the Environmental Science Services Administration (now NOAA).
According to Snyder and the study authors, it was the military’s correct diagnosis of the solar storm that prevented the event from becoming a disaster. Ultimately, the storm led the military to recognize space weather as an operational concern and build a stronger space weather forecasting system, he said.
The public is likely unaware that natural disasters could potentially trick contemporary military forces into thinking they are under attack, said Morris Cohen, an electrical engineer and radio scientist at Georgia Institute of Technology in Atlanta who was not involved in the new study.
“I thought it was fascinating from a historical perspective,” he said of the new study.
The May 1967 storm brought about change as a near miss rather than a full-blown catastrophe, according to Cohen.
“Oftentimes, the way things work is something catastrophic happens and then we say, ‘We should do something so it doesn’t happen again,’” he said. “But in this case there was just enough preparation done just in time to avert a disastrous result.”
Comments Off on The Solar Storm That Nearly Caused World War Three
August 21st, 2016
By Alton Parrish.
Ransomware – what hackers use to encrypt your computer files and demand money in exchange for freeing those contents – is an exploding global problem with few solutions, but a team of University of Florida researchers says it has developed a way to stop it dead in its tracks.
The answer, they say, lies not in keeping it out of a computer but rather in confronting it once it’s there and, counterintuitively, actually letting it lock up a few files before clamping down on it.

“Our system is more of an early-warning system. It doesn’t prevent the ransomware from starting … it prevents the ransomware from completing its task … so you lose only a couple of pictures or a couple of documents rather than everything that’s on your hard drive, and it relieves you of the burden of having to pay the ransom,” said Nolen Scaife, a UF doctoral student and founding member of UF’s Florida Institute for Cybersecurity Research.
Scaife is part of the team that has come up with the ransomware solution, which it calls CryptoDrop.
Ransomware attacks have become one of the most urgent problems in the digital world. The FBI issued a warning in May saying the number of attacks has doubled in the past year and is expected to grow even more rapidly this year.

It said it received more than 2,400 complaints last year and estimated losses from such attacks at $24 million last year for individuals and businesses.
Attackers are typically shadowy figures from other countries lurking on the Dark Web and difficult, if not impossible, to find. Victims include not only individuals but also governments, industry, health care providers, educational institutions and financials entities.
Attacks most often show up in the form of an email that appears to be from someone familiar. The recipient clicks on a link in the email and unknowingly unleashes malware that encrypts his or her data. The next thing to appear is a message demanding the ransom, typically anywhere from a few hundred to a few thousand dollars.
“It’s an incredibly easy way to monetize a bad use of software,” said Patrick Traynor, an associate professor in UF’s department of computer and information science and engineering at UF and also a member of the Florida Institute for Cybersecurity Research. He and Scaife worked together on developing CryptoDrop.
Some companies have simply resigned themselves to that inevitability and budgeted money to cover ransoms, which usually must be paid in Bitcoin, a digital currency that defies tracing.
Ransomware attacks are effective because, quite simply, they work.
Antivirus software is successful at stopping them when it recognizes ransomware malware, but therein lies the problem.
“These attacks are tailored and unique every time they get installed on someone’s system,” Scaife said. “Antivirus is really good at stopping things it’s seen before … That’s where our solution is better than traditional anti-viruses. If something that’s benign starts to behave maliciously, then what we can do is take action against that based on what we see is happening to your data. So we can stop, for example, all of your pictures form being encrypted.”
Scaife, Traynor and colleagues Kevin Butler at UF and Henry Carter at Villanova University lay out the solution in a paper accepted for publication at the IEEE International Conference on Distributed Computing Systems and presented June 29 in Nara, Japan.
The results, they said, were impressive.
“We ran our detector against several hundred ransomware samples that were live,” Scaife said, “and in those case it detected 100 percent of those malware samples and it did so after only a median of 10 files were encrypted.”
And CryptoDrop works seamlessly with antivirus software.
“About one-tenth of 1 percent of the files were lost,” Traynor said, “but the advantage is that it’s flexible. We don’t have to wait for that anti-virus update. If you have a new version of your ransomware, our system can detect that.”
The team currently has a functioning prototype that works with Windows-based systems and is seeking a partner to commercialize it and make it available publicly.
Comments Off on Ransomware Counter-Intuitive Solution
August 21st, 2016
By Alton Parrish.
This year’s melt season in the Arctic Ocean and surrounding seas started with a bang, with a record low maximum extent in March and relatively rapid ice loss through May. The melt slowed down in June, however, making it highly unlikely that this year’s summertime sea ice minimum extent will set a new record.
“Even when it’s likely that we won’t have a record low, the sea ice is not showing any kind of recovery. It’s still in a continued decline over the long term,” said Walt Meier, a sea ice scientist at NASA’s Goddard Space Flight Center in Greenbelt, Maryland. “It’s just not going to be as extreme as other years because the weather conditions in the Arctic were not as extreme as in other years.”
“A decade ago, this year’s sea ice extent would have set a new record low and by a fair amount. Now, we’re kind of used to these low levels of sea ice – it’s the new normal.”

Visualization of Arctic sea ice extent on Aug. 13, 2016.
This year’s sea ice cover of the Barents and Kara seas north of Russia opened up early, in April, exposing the surface ocean waters to the energy from the sun weeks ahead of schedule. By May 31, the extent of the Arctic sea ice cover was comparable to end-of-June average levels. But the Arctic weather changed in June and slowed the sea ice loss. A persistent area of low atmospheric pressure, accompanied by cloudiness, winds that dispersed ice and lower-than-average temperatures, didn’t favor melt.
In this animation, the daily Arctic sea ice and seasonal land cover change progress through time, from the prior sea ice maximum March 24, 2016, through Aug. 13, 2016. The Arctic sea ice cover likely won’t reach its yearly minimum extent until mid-to-late September.

The rate of ice loss picked up again during the first two weeks of August, and is now greater than average for this time of the year. A strong cyclone is moving through the Arctic, similar to one that occurred in early August 2012. Four years ago, the storm caused an accelerated loss of ice during a period when the decline in sea ice is normally slowing because the sun is setting in the Arctic. However, the current storm doesn’t appear to be as strong as the 2012 cyclone and ice conditions are less vulnerable than four years ago, Meier said.
“This year is a great case study in showing how important the weather conditions are during the summer, especially in June and July, when you have 24 hours of sunlight and the sun is high in the sky in the Arctic,” Meier said. “If you get the right atmospheric conditions during those two months, they can really accelerate the ice loss. If you don’t, they can slow down any melting momentum you had. So our predictive ability in May of the September minimum is limited, because the sea ice cover is so sensitive to the early-to-mid-summer atmospheric conditions, and you can’t foresee summer weather.”
(1)
Arctic sea ice has varied terrain in the summer months, as ridges and melt ponds form and floes break apart. A new NASA satellite called ICESat-2, launching in 2018, will measure the height of sea ice year-round.

As scientists are keeping an eye on the Arctic sea ice cover, NASA is also preparing for a new method to measure the thickness of sea ice – a difficult but key characteristic to track from orbit.
“We have a good handle on the sea ice area change,” said Thorsten Markus, Goddard’s cryosphere lab chief. “We have very limited knowledge how thick it is.”
(2)
Research vessels or submarines can measure ice thickness directly, and some airborne instruments have taken readings that can be used to calculate thickness. But satellites haven’t been able to provide a complete look at sea ice thickness in particular during melting conditions, Markus said. The radar instruments that penetrate the snow during winter to measure thickness don’t work once you add in the salty water of the melting sea ice, since the salinity interferes with the radar.
The Ice, Cloud and land Elevation Satellite-2, or ICESat-2, will use lasers to try to get more complete answers of sea ice thickness. The satellite, slated to launch by 2018, will use a laser altimeter to measure the heights of Earth’s surface.

Sea ice offshore of Barrow, Alaska.
In the Arctic, it will measure the elevation of the ice floes, compared to the water level. However, only about one-tenth of sea ice is above the water surface; the other nine-tenths lie below.
To estimate the entire thickness of the ice floe, researchers will need to go beyond the above-water height measurements, and perform calculations to account for factors like the snow on top of the ice and the densities of the frozen layers. Scientists are eager to see the measurements turned into data on sea ice thickness, Markus said.
“If we want to estimate mass changes of sea ice, or increased melting, we need the sea ice thickness,” he said. “It’s critically important to understanding the changes in the Arctic.”
Comments Off on NASA “Low Levels of Sea Ice – It’s The New Normal”