


Posts by AltonParrish:
Historic Find on Mars by NASA’s Curiosity Rover, Link to Watery Past
September 28th, 2012By Alton Parrish.
NASA’s Curiosity rover found evidence for an ancient, flowing stream on Mars at a few sites, including the rock outcrop pictured here, which the science team has named “Hottah” after Hottah Lake in Canada’s Northwest Territories.
 Image credit: NASA/JPL-Caltech/MSSS
Scientists enhanced the color in this version to show the Martian scene as it would appear under the lighting conditions we have on Earth, which helps in analyzing the terrain.In this image from NASA’s Curiosity rover, a rock outcrop called Link pops out from a Martian surface that is elsewhere blanketed by reddish-brown dust.
 Image credit: NASA/JPL-Caltech/MSSS
Where Water Flowed Downslope
This image shows the topography, with shading added, around the area where NASA’s Curiosity rover landed on Aug. 5 PDT (Aug. 6 EDT). Higher elevations are colored in red, with cooler colors indicating transitions downslope to lower elevations. The black oval indicates the targeted landing area for the rover known as the “landing ellipse,” and the cross shows where the rover actually landed.
An alluvial fan, or fan-shaped deposit where debris spreads out downslope, has been highlighted in lighter colors for better viewing. On Earth, alluvial fans often are formed by water flowing downslope. New observations from Curiosity of rounded pebbles embedded with rocky outcrops provide concrete evidence that water did flow in this region on Mars, creating the alluvial fan. Water carrying the pebbly material is thought to have streamed downslope extending the alluvial fan, at least occasionally, to where the rover now sits studying its ancient history.
Elevation data were obtained from stereo processing of images from the High Resolution Imaging Science Experiment (HiRISE) camera on NASA’s Mars Reconnaissance Orbiter.  Image credit: NASA/JPL-Caltech/UofA
Curiosity’s Roadside Discoveries
This map shows the path on Mars of NASA’s Curiosity rover toward Glenelg, an area where three terrains of scientific interest converge. Arrows mark geological features encountered so far that led to the discovery of what appears to be an ancient Martian streambed. The first site, dubbed Goulburn, is an area where the thrusters from the rover’s descent stage blasted away a layer of loose material, exposing bedrock underneath. Goulburn gave scientists a hint that water might have transported the pebbly sandstone material making up the outcrop. The second feature, a naturally exposed rock outcrop named Link, stood out to the science team for its embedded, rounded gravel pieces. Such rounded shapes are strong evidence of water transport. The final feature, another naturally exposed rock outcrop named Hottah, offered the most compelling evidence yet of an ancient stream, as it contains abundant rounded pebbles. The grain sizes are also an important part of the evidence for water: the rounded pebbles, which are up to 1.6 inches (4 centimeters) in size, are too large to have been transported by wind.
The image used for the map is from an observation of the landing site by the High Resolution Imaging Science Experiment (HiRISE) instrument on NASA’s Mars Reconnaissance Orbiter. This map shows the path on Mars of NASA’s Curiosity rover toward Glenelg, an area where three terrains of scientific interest converge.

Image credit: NASA/JPL-Caltech/Univ. of Arizona
River Fans on Earth and Mars: Curiosity science team m
Rock Outcrops on Mars and Earth
This set of images compares the Link outcrop of rocks on Mars (left) with similar rocks seen on Earth (right). The image of Link, obtained by NASA’s Curiosity rover, shows rounded gravel fragments, or clasts, up to a couple inches (few centimeters), within the rock outcrop. Erosion of the outcrop results in gravel clasts that fall onto the ground, creating the gravel pile at left. The outcrop characteristics are consistent with a sedimentary conglomerate, or a rock that was formed by the deposition of water and is composed of many smaller rounded rocks cemented together. A typical Earth example of sedimentary conglomerate formed of gravel fragments in a stream is shown on the right.
An annotated version of the image highlights a piece of gravel that is about 0.4 inches (1 centimeter) across. It was selected as an example of coarse size and rounded shape. Rounded grains (of any size) occur by abrasion in sediment transport, by wind or water, when the grains bounce against each other. Gravel fragments are too large to be transported by wind. At this size, scientists know the rounding occurred in water transport in a stream.
 Image credit: NASA/JPL-Caltech/MSSS and PSIScientists are studying the images of stones cemented into a layer of conglomerate rock. The sizes and shapes of stones offer clues to the speed and distance of a long-ago stream’s flow.”From the size of gravels it carried, we can interpret the water was moving about 3 feet per second, with a depth somewhere between ankle and hip deep,” said Curiosity science co-investigator William Dietrich of the University of California, Berkeley. “Plenty of papers have been written about channels on Mars with many different hypotheses about the flows in them. This is the first time we’re actually seeing water-transported gravel on Mars. This is a transition from speculation about the size of streambed material to direct observation of it.”The finding site lies between the north rim of Gale Crater and the base of Mount Sharp, a mountain inside the crater. Earlier imaging of the region from Mars orbit allows for additional interpretation of the gravel-bearing conglomerate. The imagery shows an alluvial fan of material washed down from the rim, streaked by many apparent channels, sitting uphill of the new finds.The rounded shape of some stones in the conglomerate indicates long-distance transport from above the rim, where a channel named Peace Vallis feeds into the alluvial fan. The abundance of channels in the fan between the rim and conglomerate suggests flows continued or repeated over a long time, not just once or for a few years.
The discovery comes from examining two outcrops, called “Hottah” and “Link,” with the telephoto capability of Curiosity’s mast camera during the first 40 days after landing. Those observations followed up on earlier hints from another outcrop, which was exposed by thruster exhaust as Curiosity, the Mars Science Laboratory Project’s rover, touched down.
“Hottah looks like someone jack-hammered up a slab of city sidewalk, but it’s really a tilted block of an ancient streambed,” said Mars Science Laboratory Project Scientist John Grotzinger of the California Institute of Technology in Pasadena.
The gravels in conglomerates at both outcrops range in size from a grain of sand to a golf ball. Some are angular, but many are rounded.
“The shapes tell you they were transported and the sizes tell you they couldn’t be transported by wind. They were transported by water flow,” said Curiosity science co-investigator Rebecca Williams of the Planetary Science Institute in Tucson, Ariz.
The science team may use Curiosity to learn the elemental composition of the material, which holds the conglomerate together, revealing more characteristics of the wet environment that formed these deposits. The stones in the conglomerate provide a sampling from above the crater rim, so the team may also examine several of them to learn about broader regional geology.
The slope of Mount Sharp in Gale Crater remains the rover’s main destination. Clay and sulfate minerals detected there from orbit can be good preservers of carbon-based organic chemicals that are potential ingredients for life.
“A long-flowing stream can be a habitable environment,” said Grotzinger. “It is not our top choice as an environment for preservation of organics, though. We’re still going to Mount Sharp, but this is insurance that we have already found our first potentially habitable environment.”
During the two-year prime mission of the Mars Science Laboratory, researchers will use Curiosity’s 10 instruments to investigate whether areas in Gale Crater have ever offered environmental conditions favorable for microbial life.
NASA’s Jet Propulsion Laboratory, a division of Caltech, built Curiosity and manages the Mars Science Laboratory Project for NASA’s Science Mission Directorate, Washington.
Contacts and sources:
Guy Webster / D.C. Agle
Jet Propulsion Laboratory, Pasadena,Calif.
Dwayne Brown
NASA Headquarters, Washington
The Universe’s Exit Door, The Point of No Return Measured for the First Time
September 28th, 2012By Alton Parrish.
For the first time, an international team has measured the radius of a black hole.

Image: Avery E. Broderick (Perimeter Institute & University of Waterloo)Now, an international team, led by researchers at MIT’s Haystack Observatory, has for the first time measured the radius of a black hole at the center of a distant galaxy — the closest distance at which matter can approach before being irretrievably pulled into the black hole.The scientists linked together radio dishes in Hawaii, Arizona and California to create a telescope array called the “Event Horizon Telescope” (EHT) that can see details 2,000 times finer than what’s visible to the Hubble Space Telescope. These radio dishes were trained on M87, a galaxy some 50 million light years from the Milky Way. M87 harbors a black hole 6 billion times more massive than our sun; using this array, the team observed the glow of matter near the edge of this black hole — a region known as the “event horizon.”
“Once objects fall through the event horizon, they’re lost forever,” says Shep Doeleman, assistant director at the MIT Haystack Observatory and research associate at the Smithsonian Astrophysical Observatory. “It’s an exit door from our universe. You walk through that door, you’re not coming back.”
Doeleman and his colleagues have published the results of their study this week in the journal Science.
Jets at the edge of a black hole
Supermassive black holes are the most extreme objects predicted by Albert Einstein’s theory of gravity — where, according to Doeleman, “gravity completely goes haywire and crushes an enormous mass into an incredibly close space.” At the edge of a black hole, the gravitational force is so strong that it pulls in everything from its surroundings. However, not everything can cross the event horizon to squeeze into a black hole. The result is a “cosmic traffic jam” in which gas and dust build up, creating a flat pancake of matter known as an accretion disk. This disk of matter orbits the black hole at nearly the speed of light, feeding the black hole a steady diet of superheated material. Over time, this disk can cause the black hole to spin in the same direction as the orbiting material.
An accretion disk (orange) of gas and dust surrounds super-massive black holes at the center of most galaxies. These disks of galactic matter emit magnetic beams (pink lines) that spew out from the center of the black hole, drawing matter out from both ends in high-powered jets.

Image: NASA and Ann Field (Space Telescope Science Institute)
Caught up in this spiraling flow are magnetic fields, which accelerate hot material along powerful beams above the accretion disk The resulting high-speed jet, launched by the black hole and the disk, shoots out across the galaxy, extending for hundreds of thousands of light-years. These jets can influence many galactic processes, including how fast stars form.
‘Is Einstein right?’
A jet’s trajectory may help scientists understand the dynamics of black holes in the region where their gravity is the dominant force. Doeleman says such an extreme environment is perfect for confirming Einstein’s theory of general relativity — today’s definitive description of gravitation.
“Einstein’s theories have been verified in low-gravitational field cases, like on Earth or in the solar system,” Doeleman says. “But they have not been verified precisely in the only place in the universe where Einstein’s theories might break down — which is right at the edge of a black hole.”
According to Einstein’s theory, a black hole’s mass and its spin determine how closely material can orbit before becoming unstable and falling in toward the event horizon. Because M87’s jet is magnetically launched from this smallest orbit, astronomers can estimate the black hole’s spin through careful measurement of the jet’s size as it leaves the black hole. Until now, no telescope has had the magnifying power required for this kind of observation.
“We are now in a position to ask the question, ‘Is Einstein right?’” Doeleman says. “We can identify features and signatures predicted by his theories, in this very strong gravitational field.”
The team used a technique called Very Long Baseline Interferometry, or VLBI, which links data from radio dishes located thousands of miles apart. Signals from the various dishes, taken together, create a “virtual telescope” with the resolving power of a single telescope as big as the space between the disparate dishes. The technique enables scientists to view extremely precise details in faraway galaxies.
Using the technique, Doeleman and his team measured the innermost orbit of the accretion disk to be only 5.5 times the size of the black hole event horizon. According to the laws of physics, this size suggests that the accretion disk is spinning in the same direction as the black hole — the first direct observation to confirm theories of how black holes power jets from the centers of galaxies.
The team plans to expand its telescope array, adding radio dishes in Chile, Europe, Mexico, Greenland and Antarctica, in order to obtain even more detailed pictures of black holes in the future.
Christopher Reynolds, a professor of astronomy at the University of Maryland, says the group’s results provide the first observational data that will help scientists understand how a black hole’s jets behave.
“The basic nature of jets is still mysterious,” Reynolds says. “Many astrophysicists suspect that jets are powered by black hole spin … but right now, these ideas are still entirely in the realm of theory. This measurement is the first step in putting these ideas on a firm observational basis.”
 Credit: Perimeter Institute for Theoretical Physics
 Credit: NASA and the Hubble Heritage Team
“The first thing we learned is that the launching region is quite small,” says Broderick. The jets are coming from quite close to the black hole’s event horizon: the point of no return where even the light from objects tumbling into the black hole is lost. While this is not quite enough to rule out the idea that jets might be powered by accretion physics, it is clear that energy is coming either from the black hole or from the accretion processes happening right next to the black hole.
“We are now beginning to see that spin is playing a role in jet production,” says Broderick. “That is, not only can we say that the jets originate near the black hole, but because the emission region is so small, it must be coming from a rotating black hole.”
“The black hole is really the engine that drives the jet,” he adds. “It’s an extraordinary thing.”
Contacts and sources:
Sarah McDonnell
Massachusetts Institute of Technology
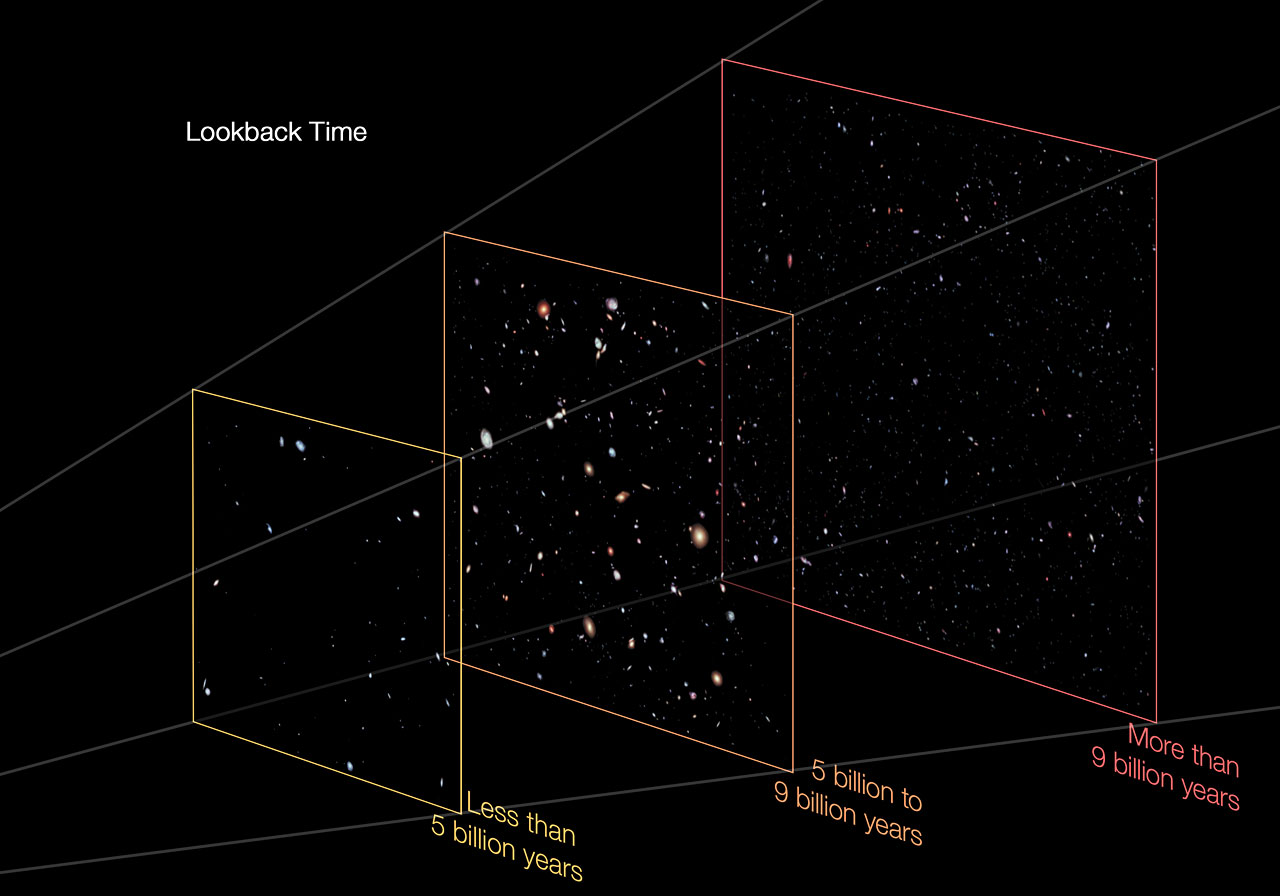
The Deepest Ever View Of The Universe: Hubble Goes To The Extreme
September 27th, 2012
Supernova Primo, at a redshift of 1.55, the most distant type Ia supernova ever observed
UDFy-38135539, at a redshift of 8.6, is the most distant galaxy to have had its distance independently corroborated with spectroscopy
UDFy-33435698, at a redshift of 8.6
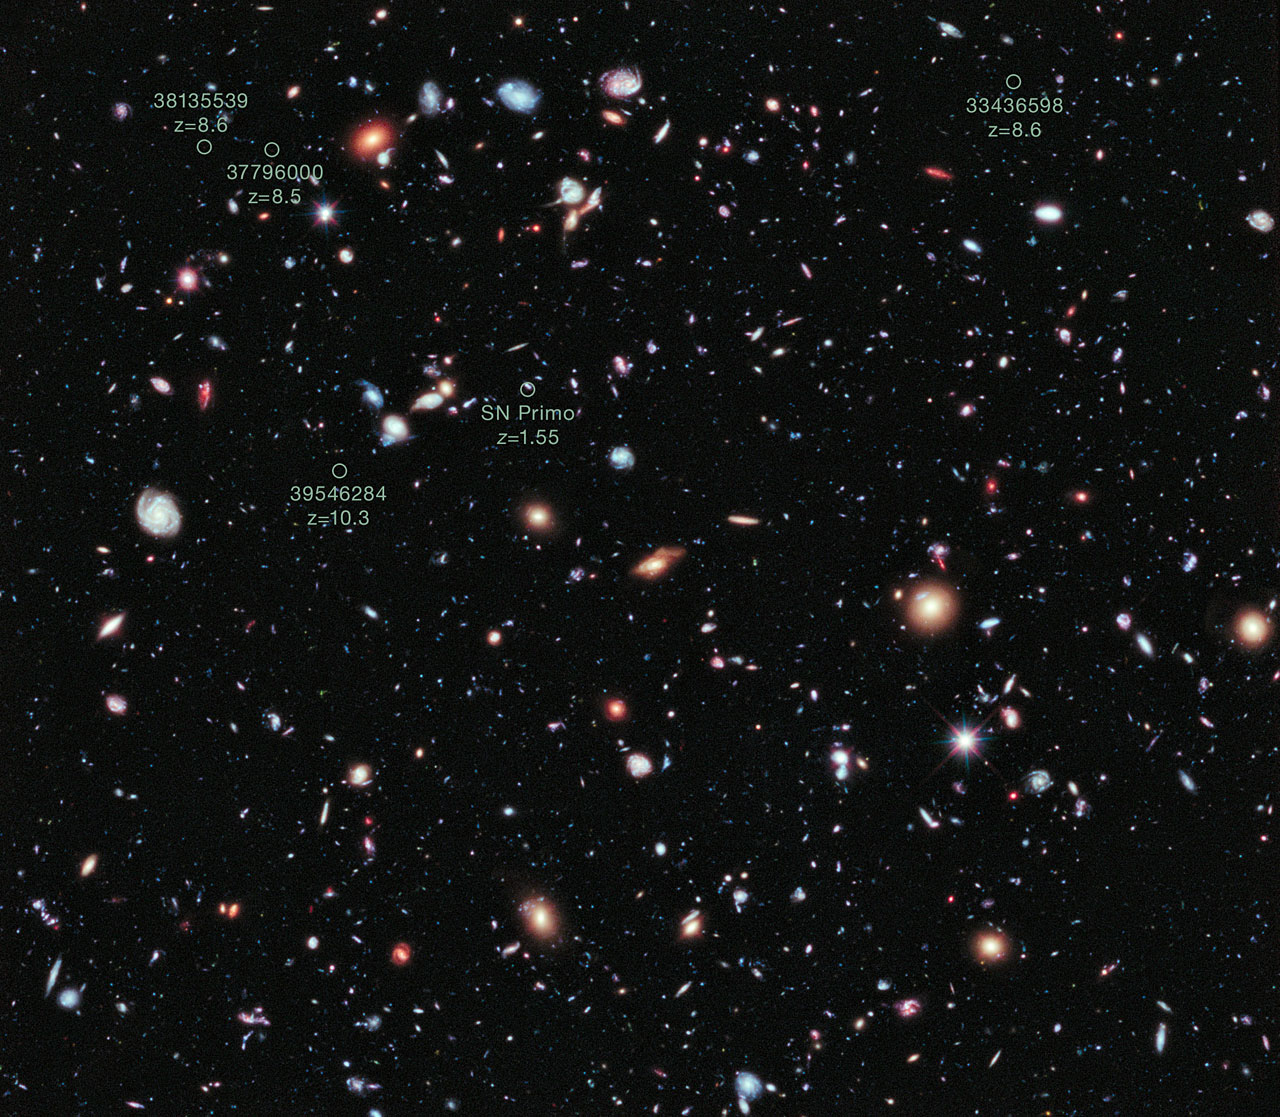
Credit: NASA, ESA, G. Illingworth, D. Magee, and P. Oesch (University of California, Santa Cruz), R. Bouwens (Leiden University), and the HUDF09 Team
Credit: NASA, ESA, Z. Levay (STScI), T. Rector, I. Dell’Antonio/NOAO/AURA/NSF, G. Illingworth, D. Magee, and P. Oesch (University of California, Santa Cruz), R. Bouwens (Leiden University) and the HUDF09 Team
Undersea Volcano Erupting In Ring Of Fire: Tune In Live To Robot Camera
September 23rd, 2012By Alton Parrish.

High resolution (Credit: NOAA)

“The Lau Basin is one of Earth’s most geologically active areas, with ocean plates colliding and separating at some of the highest rates on the planet,” said Resing. “Our preliminary surveys between 2008 and 2011 revealed the Northeast Lau Basin as one of the most concentrated areas of active submarine volcanism and hot springs found anywhere on Earth.”Scientists from the United States, New Zealand, and Australia are working closely with a team led by Volker Ratmeyer, Ph.D., from the MARUM Center for Marine Environmental Sciences at the University of Bremen (Federal Republic of Germany), using the remotely operated vehicle (ROV) Quest 4000 to explore and characterize the unique ecosystems of the Northeast Lau basin. During the first hour of each dive, the ROV dives to the seafloor and the final hour of each dive has the ROV rising to the ship. The ROV operates to a depth of 4,000 meters and can map volcanic geology, sample chemical fluids, and collect macro- and micro- biological samples. Scientists are deploying the ROV from the research vessel (R/V) Roger Revelle, operated by Scripps Institution of Oceanography.
.jpg)
High resolution (Credit: Image courtesy of NSF and NOAA)
The cruise is a project of NOAA’s Office of Ocean Exploration and Research and NOAA’s Pacific Marine Environmental Laboratory. The National Science Foundation provided additional funding for ROV dives and for research conducted by Brad Tebo, Ph.D. Support has also been provided by Nautilus Minerals in Canada and by New Zealand’s Institute of Geological and Nuclear Sciences.Video highlights, daily mission logs, interactive maps, mission scientists’ biographies, background essays, 3D bathymetric virtual “fly-throughs” of the Lau Basin, and education materials are all availableonline. Visitors there can also participate in Office of Ocean Exploration and Research social media sites, and in the online inquiry “Ask an Explorer” program.
The mission began on September 9 from Suva, Fiji, and the mission, as well as live video feeds, will conclude upon entering the port of Apia, Samoa on September 25.
Other hydrothermal activity may be viewed online.
NOAA’s Office of Ocean Exploration and Research is the only federal program that systematically explores Earth’s largely unknown ocean for the purpose of discovery and the advancement of knowledge.
NOAA’s mission is to understand and predict changes in the Earth’s environment, from the depths of the ocean to the surface of the sun, and to conserve and manage our coastal and marine resources. Visit us atwww.noaa.gov and join us on Facebook, Twitter and our other social media channels.
Lau Basin – East Mata – Sonar image of the East Mata volcano. Image is looking toward the north. According to Lau Basin studies in Nov. 2008 and May 2010, CTD casts indicated that East Mata is hydrothermally active, but probably not erupting.

Download here. (Credit: Image courtesy of Submarine Ring of Fire 2012 Exploration, NOAA Vents Program)

Download here. (Credit:Image courtesy of Submarine Ring of Fire 2012 Exploration, NOAA Vents Program )Northern Northeast Lau Spreading Center – Sonar image of the Northern Northeast Lau spreading center. Image looks toward the northeast.

Download here. (Credit: Image courtesy of Submarine Ring of Fire 2012 Exploration, NOAA Vents Program)
Download here. (Credit: Image courtesy of Submarine Ring of Fire 2012 Exploration, NOAA Vents Program)North Mata Group – Sonar image of the North Mata group of volcanoes. Image looks toward the northeast. Six of these seven seamounts were found to have hydrothermal activity during an expedition in 2010.
Download here. (Credit: Image courtesy of Submarine Ring of Fire 2012 Exploration, NOAA Vents Program)
.jpg)
Download here. (Credit:Image courtesy of Submarine Ring of Fire 2012 Exploration, NOAA Vents Program mal activity during an expedition in 2010 )
Ten New Dwarf Planets and Candidates in Our Solar System
September 15th, 2012By Alton Parrish.
Do you know how many planets and dwarf planets are in our solar system. I thought I did, but I didn’t.
Credit: NASA
Astronomers have detected over 500 bodies orbiting the sun well beyond the orbit of Neptune. Among these Trans-Neptunian Bodies (TNOs) are a growing number that rival Pluto in size. This caused astronomers to rethink how they should define the term planet.
In 2006 Pluto was demoted from a planet to a dwarf planet, joining the large asteroid Ceres in that new group. Several other TNOs also joined that group, which now includes five bodies shown highlighted in the table. A number of other large objects, called Plutoids, are also listed. The AU (astronomical unit) distance from the Earth to the Sun is one or 93 million miles (92,955,807.273 miles to be exact). Ceres which is between Jupiter and Mars was once considered the largest asteroid but is now considered a dwarf planet like Pluto.
Name AU Distance Years For Orbit

Credit: NASA
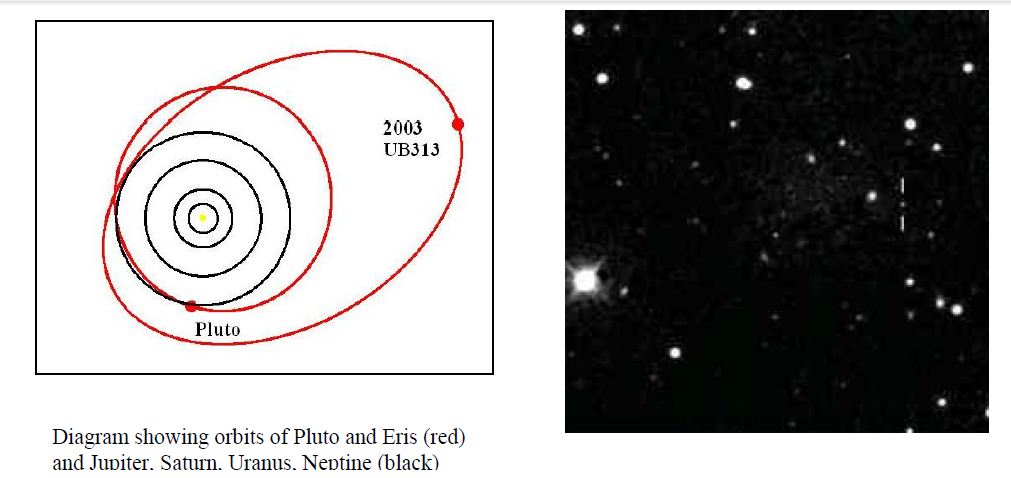
For the first time, in 2005 NASA’s Hubble Space Telescope distinctly saw the “tenth planet,” then nicknamed “Xena,” after the warrior princess in the TV show of the same name and found that it’s only slightly larger than Pluto. The announcement was made on March 11th, 2006. The name was later officially changed to Eris.
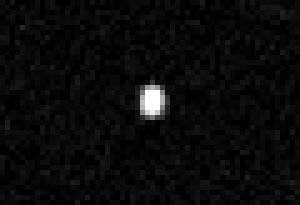
Eris, formerly known as Xena

Credit: NASA, ESA, and A. Schaller (for STScI)
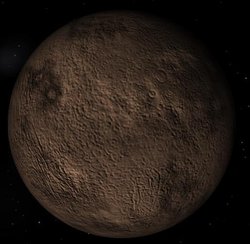
Currently, Eris is more than three times farther from the Sun than Pluto. It is so cold out there that the dwarf planet’s atmosphere has frozen onto the surface as a frosty glaze. The coating gleams brightly, reflecting as much sunlight as fresh fallen snow. The path Eris takes around the Sun is shaped like an oval rather than a circle. In about 290 years, Eris will move close enough to the Sun to partially thaw. Its icy veneer will melt away revealing a rocky, speckled landscape similar to Pluto’s.
This is an artist’s concept of Kuiper Belt object Eris and its tiny satellite Dysnomia. Eris is the large object at the bottom of the illustration. A portion of its surface is lit by the Sun, located in the upper left corner of the image. Eris’s moon, Dysnomia, is located just above and to the left of Eris. The Hubble Space Telescope and Keck Observatory took images of Dysnomia’s movement from which astronomer Mike Brown (Caltech) precisely calculated Eris to be 27 percent more massive than Pluto.

Artwork Credit: NASA, ESA, Adolph Schaller (for STScI)
Aptly named after the Greek goddess of conflict, the icy dwarf planet Eris has rattled the general model of our solar system. The object was discovered by astronomer Mike Brown of Caltech in the outer reaches of the Kuiper belt in 2005. Its detection provoked debate about Pluto’s classification as a planet. Eris is slightly larger than Pluto. 
“Hubble is the only telescope capable of getting a clean visible-light measurement of the actual diameter of Eris,” said Mike Brown, planetary scientist at the California Institute of Technology in Pasadena, Calif. Brown’s research team discovered Eris, officially cataloged as 2003 UB313, and its results have been accepted for publication in the Astrophysical Journal.
Only a handful of images were required to determine Eris’ diameter. Located 10 billion miles from Earth with a diameter a little more than half the width of the United States, the object is 1.5 pixels across in Hubble’s view. That’s enough to make a precise size measurement.
Pluto’s diameter, as measured by Hubble, is 1,422 miles.
Located 10 billion miles away, but with a diameter that is a little more than half the width of the United States, Xena is only 1.5 picture elements across in Hubble’s Advanced Camera for Surveys’ view.

Eris’ bright reflectivity is possibly due to fresh methane frost on its surface. The object may have had an atmosphere when it was closer to the sun, but as it moved to its current location farther away this atmosphere would have “frozen out,” settling on the surface as frost.
Another possibility is that Eris leaks methane gas continuously from its warmer interior. When this methane reaches the cold surface, it immediately freezes solid, covering craters and other features to make it uniformly bright to Hubble’s telescopic eye.
Eris takes about 560 years to orbit the sun, and it is now very close to aphelion (the point on its orbit that is farthest from the sun). Brown next plans to use Hubble and other telescopes to study other recently discovered Kuiper Belt objects that are almost as large as Pluto and Eris. The Kuiper Belt is a vast ring of primordial icy comets and larger bodies encircling Neptune’s orbit.


Sedna Mystery Deepens With Hubble Images Of Farthest Planetoid
Astronomers studying 35 NASA Hubble Space Telescope (HST) images of the solar system’s farthest known object, unofficially named Sedna, are surprised the object does not appear to have a companion moon of any substantial size.
This unexpected result might offer new clues to the origin and evolution of objects on the far edge of the solar system.
Sedna’s existence was announced on March 15. Its discoverer, Mike Brown of the California Institute of Technology, Pasadena, Calif., was so convinced it had a satellite, that an artist’s concept of Sedna released to the media included a hypothetical moon.

Even with Hubble’s crisp view, it may just be barely resolving the disk of mysterious Sedna, Brown said. It’s equivalent to trying to see a soccer ball 900 miles away. This would place an upper limit in the object’s size of being approximately three-quarters the size of Pluto, or about 1,000 miles across.
But Brown predicted a satellite would pop up as a companion “dot” in Hubble’s precise view. But the object is not there. There is a very small chance, it might have been behind Sedna or transiting in front of it, so it could not be seen separately from Sedna in the HST images.
Brown based this prediction on his earlier observations of apparent periodic changes in light reflecting from Sedna’s mottled surface. The resulting light curve gives a rotation period of 40 days. If true, Sedna would be the slowest rotating object in the solar system after Mercury and Venus, whose slow rotation rates are due to the tidal influence of the sun.
One easy way out of this dilemma is the possibility the rotation period is not as slow as astronomers thought. But even with a careful reanalysis, the team remains convinced the period is correct. Brown admits, “I’m completely lost for an explanation as to why the object rotates so slowly.”
Small bodies like asteroids and comets typically complete one rotation in a matter of hours. Pluto has a six-day period from being tidally locked to the revolution of its satellite Charon. The HST was the first telescope to resolve Pluto and Charon as two separate bodies. NASA’s forthcoming James Webb Space Telescope will provide a platform for further high-resolution studies of infrared light from such distant, cold bodies in our solar system.
Electronic images of Sedna and additional information are available on the Internet, at:
http://hubblesite.org/news/2004/14
Quaoar
NASA’s Hubble Space Telescope has measured the largest object in the solar system seen since the discovery of Pluto 72 years ago. The discovery was made October 7, 2002
Approximately half the size of Pluto, the icy world 2002 LM60, dubbed “Quaoar” (pronounced kwa-whar) by its discoverers, is the farthest object in the solar system ever to be resolved by a telescope. It was initially detected by a ground-based telescope as simply a dot of light, until astronomers aimed Hubble’s powerful telescope at it.
Quaoar is about 4 billion miles away from Earth, well over a billion miles farther away than Pluto. Unlike Pluto, its orbit around the Sun is circular, even more so than most of the planetary-class bodies in the solar system.
Credit: NASA/HST
Although smaller than Pluto, Quaoar is greater in volume than all the asteroids combined (though probably only one-third the mass of the asteroid belt, because it’s icy rather than rocky). Quaoar’s composition is theorized to be largely ices mixed with rock, not unlike the makeup of a comet, though 100 million times greater in volume.
This finding yields important new insights into the origin and dynamics of the planets, and the mysterious population of bodies dwelling in the solar system’s final frontier: the elusive, icy Kuiper Belt beyond Neptune.
Michael Brown and Chadwick Trujillo of the California Institute of Technology, Pasadena, Calif. are reported the findings at the 34th annual meeting of the Division for Planetary Sciences of the American Astronomical Society in Birmingham, Ala. 50000 Quaoar (“Kwawar”) is a rocky trans-Neptunian object in the Kuiper belt with one known moon. Several astronomers consider it to be a dwarf planet, although the IAU has not formally recognized it as one.
Trujillo and Brown used the Palomar Oschin Schmidt telescope to discover Quaoar as an 18.5-magnitude object creeping across the summer constellation Ophiuchus (it’s less than 1/100,000 the brightness of the faintest star seen by the human eye). Brown had to do follow-up observations using Hubble’s new Advanced Camera for Surveys on July 5 and August 1, 2002, to measure the object’s true angular size of 40 milliarcseconds, corresponding to a diameter of about 800 miles (1300 kilometers). Only Hubble has the sharpness needed to actually resolve the disk of the distant world, leading to the first-ever direct measurement of the true size of a Kuiper Belt Object (KBO).
Like Pluto, Quaoar dwells in the Kuiper Belt, an icy debris field of comet-like bodies extending 7 billion miles beyond Neptune’s orbit. Over the past decade more than 500 icy bodies have been found in the Kuiper Belt. With a few exceptions all have been significantly smaller than Pluto.
This latest large KBO is too new to have been officially named by the International Astronomical Union. Trujillo and Brown have proposed naming it after a creation god of the Native American Tongva tribe, the original inhabitants of the Los Angeles basin. According to legend, Quaoar “came down from heaven; and, after reducing chaos to order, laid out the world on the back of seven giants. He then created the lower animals, and then mankind.”
Quaoar’s “icy dwarf” cousin, Pluto, was discovered in 1930 in the course of a 15-year search for trans-Neptunian planets. It wasn’t realized until much later that Pluto actually was the largest of the known Kuiper Belt objects. The Kuiper Belt wasn’t theorized until 1950, after comet orbits provided telltale evidence of a vast nesting ground for comets just beyond Neptune. The first recognized Kuiper Belt objects were not discovered until the early 1990s. This new object is by far the “biggest fish” astronomers have snagged in KBO surveys. Brown predicts, within a few years, even larger KBOs will be found, and Hubble will be invaluable for follow-up observations to pin down sizes.
Orbits of Makemake (blue), Haumea (green), contrasted with the orbit of Pluto (red) and the ecliptic (grey). The perihelia and the aphelia (Q) are marked with the dates of passage. The positions on April 2006 are marked with the spheres illustrating relative sizes and differences in albedo and colour.
Credit: NASA
Makemake (2005 FY9)
Makemake, formally designated (136472) Makemake, is a dwarf planet and perhaps the largest Kuiper belt object (KBO) in the classical population,[nb 4] with a diameter that is probably about 2/3 the size of Pluto. Makemake has no known satellites, which makes it unique among the largest KBOs and means that its mass can only be estimated. Its extremely low average temperature, about 30 K (−243.2 °C), means its surface is covered with methane, ethane, and possibly nitrogen ices.


Keck image of Haumea and its two moons. Hiʻiaka is above Haumea (centre), and Namaka is directly below.


Haumea is the largest member of its collisional family, a group of astronomical objects with similar physical and orbital characteristics thought to have formed when a larger progenitor was shattered by an impact. This family is the first to be identified among TNOs and includes—beside Haumea and its moons
Huya
Orcus

2007 OR10
2007 OR10 is a very large trans-Neptunian object. It is the largest body in the Solar System without a name, estimated to be between Haumea and Sedna in size. Its mass has never been measured, and its diameter is not well determined. It has not been formally recognized as a dwarf planet by the IAU, although some astronomers consider it to be one and others consider it likely to be one.

Varuna
Varuna and an object called 2002 AW197 are each approximately 540 miles across (900 kilometers). Unlike dimensions derived from Hubble’s direct observations, these diameters are deduced from measuring the objects’ temperatures and calculating a size based on assumptions about the KBOs’ reflectivity, so the uncertainty in true size is much greater.

Ixion
Ixion was originally discovered on May 22, 2001, by a group of American astronomers lead by Robert L. Millis of the Lowell Observatory in Flagstaff, Arizona. (M. Buie (Lowell), E. Chiang (IAS), J. Elliot (MIT), S. Kern (MIT), D. Trilling (U. Penn.), R. M. Wagner (LBT Obs.), L. H. Wasserman (Lowell)]. Furthering this work, Finnish and Swedish astronomers, using the La Silla Observatory in Chile, calculate Ixion to have a diameter of about 1065 ±165 kilometers. Thus, Ixion is similar in size to Ceres (the largest of the four primary asteroids and also now considered a dwarf planet) and is one of the brightest of the Kuiper objects. Ixion’s orbital period is 250.05 years and it has a 19.598° orbital inclination

This diagram shows the orbits of Ixion (green), Pluto (red) and Neptune (grey). The current positions of Ixion and Pluto are indicated (as of April 2006).

Kuiper Belt objects
Finding that the largest known Kuiper Belt object is a virtual twin to Pluto may only further complicate the debate about whether to categorize the large icy worlds that populate the belt as planets. If Pluto were considered to be the minimum size for a planet, then Xena would fulfill this criterion, too. In time, the International Astronomical Union will designate the official name.
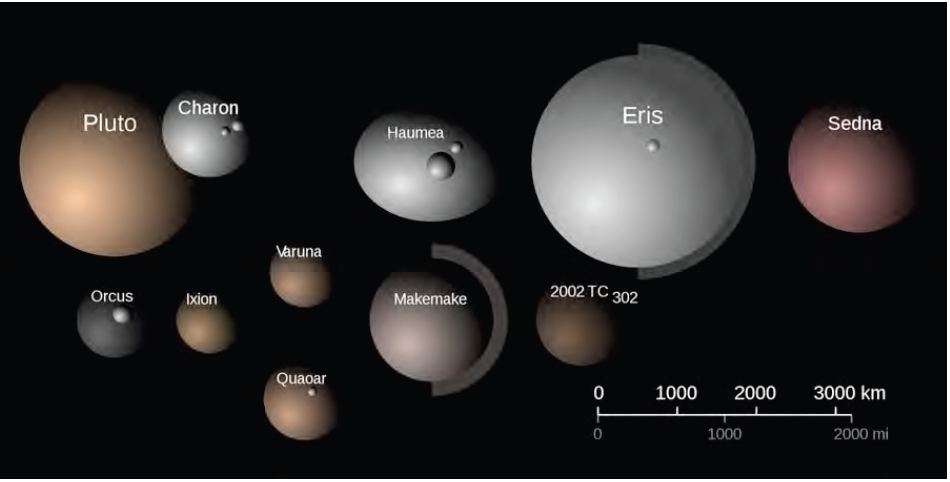
The image shows the relative sizes of the largest known Kuiper Belt Objects, including Pluto and its moon, Charon.
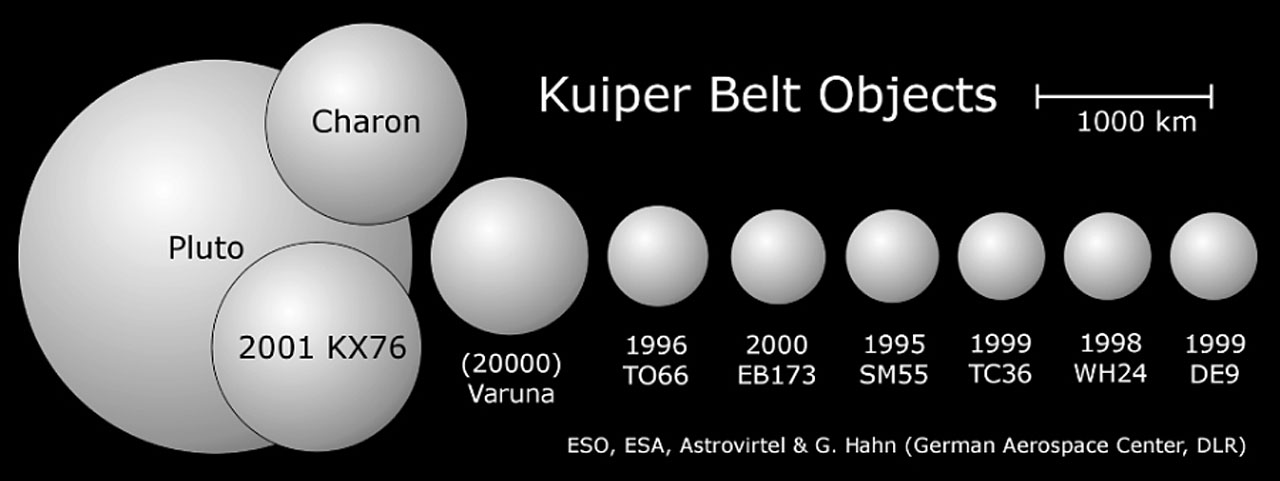
Credit: ESO
Quantum Teleportation Over 143 Kilometers A New Record
September 8th, 2012By Alton Parrish.
An international research team including several scientists from the University of Waterloo and the University of Vienna has achieved quantum teleportation over a record-breaking distance of 143 kilometres through free space.
The experiment saw the successful teleportation of quantum information — in this case, the states of light particles, or photons — between the Canary Islands of La Palma and Tenerife. The breakthrough is a crucial step toward quantum communications via satellite.
Quantum teleportation between the Canary Islands La Palma and Tenerife over both quantum and classical 143-km free-space channels. The previous record, set by researchers in China just a few months ago, was 97 km.

Credit: Nature
Unlike the teleportation of solid objects popularized in science fiction, the experiment involved the teleportation of quantum states, an essential pre-requisite of quantum computing, quantum communication and other powerful technologies under development at the Institute for Quantum Computing (IQC) at Waterloo.
The project, led by researchers from Vienna’s Institute for Quantum Optics and Quantum Information, relied on algorithms and equipment developed in Waterloo. Their results were published this week in Nature http://www.nature.com/nature/journal/vaop/ncurrent/full/nature11472.html.

Credit: Copyright: IQOQI/Vienna
Teleportation across 143 kilometres is a crucial milestone in this research, since that is roughly the minimum distance between the ground and orbiting satellites. This achievement leads to the possibility of quantum teleportation between ground stations and orbiting satellites, a key goal in the research of Professor Thomas Jennewein, an IQC faculty member and collaborator on the record-setting experiment.
For this experiment, Jennewein developed the coincidence algorithm, which synchronized and measured the transfer of photons between the two sites in the Canary Islands.
The ultra-precise clocks needed to measure the teleportation of photon states were aligned to each other to within a nanosecond, or one-billionth of a second. Such precision will be necessary in the development of satellite-based quantum communications networks.
“The experiment paves the way toward teleportation of signals over free space, or even using satellites,” said Jennewein, whose research is largely focused on the creation of large-scale quantum communications networks. “This is useful for applications in secure communication, as well as the possibility of networking full-scale quantum computers, once they exist.”
IQC research assistant professor Vadim Makarov, along with PhD student Elena Anisimova, designed the highly sensitive photon detectors, which allowed the teleportation to occur with high precision despite some hazy air conditions.
Makarov and Anisimova were recruited to help overcome inclement atmospheric conditions caused by dust whipped up from the Sahara Desert in the summer of 2011 that foiled the first attempt at the teleportation experiment. Makarov’s photon detectors, and more cooperative weather, allowed for a successful experiment last April.
Because there is less atmospheric disturbance when communicating upwards to space than between the Canary Islands, Makarov says the next logical step is to attempt teleportation between the earth and a satellite.
Makarov was in the Canary Islands for the experiment, but Jennewein stayed in Waterloo, connecting with his international colleagues via Skype to lend troubleshooting tips and scientific expertise.
Breaking the distance record wasn’t the scientists’ primary goal though. This experiment provides the basis for a worldwide information network, in which quantum mechanical effects enable the exchange of messages with greater security, and allow certain calculations to be performed more efficiently than with conventional technologies. In such a future ‘quantum internet’, quantum teleportation will be a key protocol for the transmission of information between quantum computers.
In a quantum teleportation experiment, quantum states — but not matter — are exchanged between two parties over distances that can be, in principle, arbitrarily long. The process works even if the location of the recipient is not known. Such an exchange can be used either for the transmission of messages, or as an operation in future quantum computers. In these applications the photons that encode the quantum states have to be transported reliably over long distances without compromising the fragile quantum state. The experiment of the Austrian physicists, in which they have now set up a quantum connection suitable for quantum teleportation over distances of more than 100 km, opens up new horizons.
Xiao-song Ma, one of the scientists involved in the experiment, says: “The realization of quantum teleportation over a distance of 143 km has been a huge technological challenge.” The photons had to be sent directly through the turbulent atmosphere between the two islands. The use of optical fibres is not suitable for teleportation experiments over such great distances, as signal loss would be too severe. To reach their goal, the scientists had to implement a series of technical innovations. Support came from a theory group at the Max Planck Institute for Quantum Optics in Garching (Germany) and an experimental group at the University of Waterloo (Canada). Ma also said “An important step for our successful teleportation was a method known as ‘active feed-forward’, which we have used for the first time in a long-distance experiment. It helped us to double the transfer rate”. In an active feed-forward protocol, conventional data is sent alongside the quantum information, enabling the recipient to decipher the transferred signal with a higher efficiency.
“Our experiment shows how mature ‘quantum technologies’ are today, and how useful they can be for practical applications,” says Anton Zeilinger. “The next step is satellite-based quantum teleportation, which should enable quantum communication on a global scale. We have now taken a major step in this direction and will use our know-how in an international cooperation, which involves our colleagues at the Chinese Academy of Sciences. The goal is to launch a ‘quantum satellite mission’.”
Rupert Ursin, who has been working with Zeilinger on long-distance experiments since 2002, adds: “Our latest results are very encouraging with a view to future experiments in which we either exchange signals between Earth and satellites or send messages from one satellite to another.” Satellites in ‘low-Earth orbit’ fly between 200 and 1200 km above the surface of the Earth. (The International Space Station, for example, orbits at an altitude of about 400 km.) “On the way through the atmosphere from La Palma to Tenerife, our signals have been attenuated by a factor of roughly one thousand. Nevertheless, we managed to perform a quantum teleportation experiment. In satellite-based experiments, the distances to be travelled are longer, but the signal will have to pass through less atmosphere. We have now created a sound basis for such experiments.”
Space-Warping White Dwarfs Produce Gravitational Waves
September 4th, 2012By Alton Parrish.

Credit: NASA
Gravitational waves, much like the recently discovered Higgs boson, are notoriously difficult to observe. Scientists first detected these ripples in the fabric of space-time indirectly, using radio signals from a pulsar-neutron star binary system. The find, which required exquisitely accurate timing of the radio signals, garnered its discoverers a Nobel Prize. Now a team of astronomers has detected the same effect at optical wavelengths, in light from a pair of eclipsing white dwarf stars.”This result marks one of the cleanest and strongest detections of the effect of gravitational waves,” said team member Warren Brown of the Smithsonian Astrophysical Observatory (SAO).
The team discovered the white dwarf pair last year. (White dwarfs are the remnant cores of stars like our Sun.) The system, called SDSS J065133.338+284423.37 (J0651 for short), contains two white dwarf stars so close together — one-third of the Earth-moon distance — that they make a complete orbit in less than 13 minutes.

“Every six minutes the stars in J0651 eclipse each other as seen from Earth, which makes for an unparalleled and accurate clock some 3,000 light-years away,” said study lead author J.J. Hermes, a graduate student working with Professor Don Winget at The University of Texas at Austin.
Einstein’s theory of general relativity predicts that moving objects create subtle ripples in the fabric of space-time, called gravitational waves. Gravitational waves should carry away energy, causing the stars to inch closer together and orbit each other faster and faster. The team was able to detect this effect in J0651.
“Compared to April 2011, when we discovered this object, the eclipses now happen six seconds sooner than expected,” said team member Mukremin Kilic of The University of Oklahoma.
“This is a general relativistic effect you could measure with a wrist watch,” added SAO’s Warren Brown.
The discovery of two white dwarfs about to merge allow scientists to test the General Theory of Relativity of Einstein. As shown in this picture (an artist’s view), within 900,000 years the material will start to “travel” from one to the other, which could end in a supernova explosion.

Credit: David A. Aguilar / Harvard-Smithsonian Center for Astrophysics (CfA)
J0651 will provide an opportunity to compare future direct, space-based detection of gravitational waves with those inferred from the orbital decay, providing important benchmark tests of our understanding of the workings of gravity.The team expects that the period will shrink more and more each year, with eclipses happening more than 20 seconds sooner than otherwise expected by May 2013. The stars will eventually merge, in two million years. Future observations will continue to measure the orbital decay of this system, and attempt to understand how tides affect the merger of such stars.
The team’s results will be published in The Astrophysical Journal Letters and are available online.
The confirmation of the theoretical predictions has been made with several telescopes in the United States and with the GTC, which made the observations of the system faster.
The international team has now tested the theory of Einstein’s general relativity by observing the progressive reduction of the orbit of a singular pair of stars: white dwarf binary system J0651. These two objects, remnants of Sun-like stars that have exhausted their nuclear fuel, currently completing an orbit every 13 minutes, with high accelerations and speeds that can reach over 600 miles per second, according to the group just released research in the journal Astrophysical Journal Letters.
According to the theory of Einstein’s general relativity, the acceleration of these stars in its orbital motion cause ripples in the fabric of space-time, called gravitational waves. Although not yet directly observed, the emission of these waves takes energy to binary, which causes white dwarfs gradually approach each other and getting faster orbit.
The theory of relativity predicts that the orbit of this binary system is reduced by about 0.25 milliseconds each year. Confirmation that the stars are getting closer is given by comparing themeasures taken in 2011, when the team of astrophysicists discovered this system, with those taken today.
The GTC, the largest infrared optical telescope in the world, with a primary mirror 10.4 meters, located at the Observatorio del Roque de los Muchachos on La Palma, provided the data set with the fastest rate of these objects. “Thanks to the GTC, we managed to take hundreds of pictures in a row of this interesting system without missing a beat,” said Carlos Allende Prieto, IAC researcher and one of the study authors.
For Antonio Cabrera Lavers, GTC astronomer and co-author: “This is one of those cases where we have the opportunity to use telescopes to test our understanding of the most fundamental aspects of physics.”
A peculiar system
J0651 fifth binary system is known with an orbital period of less than 15 minutes. In the other four cases, however, mass transfer occurs from one star to another, causing brightness variations and complicating observations of reduced orbital period and their interpretation in terms of gravitational waves.
This binary system is also peculiar in its orientation relative to the earth, as the orbital plane is aligned with our line of sight. “Every six minutes, one of the stars in J0651 eclipses the other, providing extremely accurate clock to 3,000 light years,” says doctoral student at the University of Texas at Austin (USA), and first author Article, JJ Hermes. “Now eclipses occur about six seconds earlier than expected from measures months ago,” says the professor of the University of Oklahoma and a member of the team, Mukremin Kilic.
The results of this study have been possible thanks to the more than 200 hours of observations, in addition to the GTC, with the 2.1-meter telescope Otto Stuve, at the McDonald Observatory in Texas, with the Gemini telescope of 8.2 meters, in Hawaii, and with the 3.5-meter telescope at Apache Point Observatory in New Mexico, all located in the U.S.
Directly detect gravitational waves is extremely difficult. Specifically, measuring the effect of gravitational waves produced by the solar system J0651 from satellites require several millions of miles and reported by lasers. Although physicists have spent years planning a system of this type, there is still no definite space mission and funding of these features.
“Thus we have an easier, albeit indirect, to detect the effects of gravitational waves,” says Allende Prieto.
Einstein’s theory of general relativity
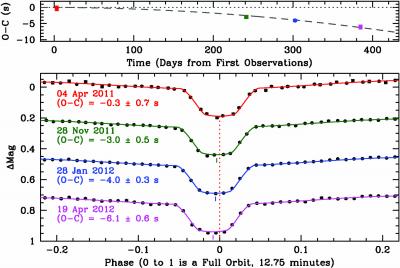
Every six minutes the stars in J0651 eclipse each other as seen from Earth, which makes for an unparalleled and accurate clock some 3,000 light-years away,” said study lead author J.J. Hermes, a graduate student working with Professor Don Winget at The University of Texas at Austin.Einstein’s theory predicts that the orbital period of this binary system loses about 0.25 milliseconds every year, less than one-thousandth of a second.
The team has just tested that prediction using more than 200 hours of observations from the 2.1-meter Otto Struve Telescope at the university’s McDonald Observatory in West Texas, the 8.2-meter Gemini North Telescope in Hawaii, the 10.4-meter Gran Telescopio Canarias in the Canary Islands of Spain, and the 3.5-meter Apache Point telescope in New Mexico.
“Compared to April 2011, when we discovered this object, the eclipses now happen six seconds sooner than expected,” said team member Mukremin Kilic of The University of Oklahoma.
This confirms that the two stars are getting closer and that the orbital period is shrinking at nearly 0.25 ms each year. By April 2013, the eclipses should happen roughly 20 seconds sooner than they did relative to the group’s first observations in April 2011.
“These compact stars are orbiting each other so closely that we have been able to observe the usually negligible influence of gravitational waves using a relatively simple camera on a 75-year-old telescope in just 13 months,” added Hermes. The Struve Telescope, which came into service in the late 1930s, was the first at McDonald Observatory.
Astronomers know of just four other binary systems with orbits under 15 minutes, and all of those systems are transferring mass from one star to the other, which complicates observations of orbital decay and the interpretation of these changes in terms of gravitational waves.
“This result marks one of the cleanest and strongest detection of the effect of gravitational waves,” said team member Warren Brown of the Smithsonian Astrophysical Observatory.
The direct detection of gravitational waves is notoriously hard. Gravitational waves from J0651 are predicted to change two points in space an inch apart by less than a billionth of a trillionth of an inch. To detect such a tiny effect requires satellites that shoot lasers at each other from millions of miles apart. No such mission is currently funded by NASA or the European Space Agency.
“Here we have an easier way to detect the effects of gravitational waves, though indirectly,” added team member Carlos Allende Prieto of the Instituto de Astrofísica de Canarias.
J0651 will provide an opportunity to compare future direct, space-based detection of gravitational waves with those inferred from the orbital decay, providing important benchmark tests of our understanding of the workings of gravity.
The team expects that the period will shrink each year, with eclipses happening more than 20 seconds sooner than expected by May 2013. The stars will eventually merge. Future observations will continue to measure the orbital decay of this system, and attempt to understand how tides affect the mergers of such stars.
“It’s exciting to confirm predictions Einstein made nearly a century ago by watching two stars bobbing in the wake caused by their sheer mass,” Hermes said. The two stars in this system are both less massive than our sun; one has half the sun’s mass and the other other a quarter.
Contact and sources:
Harvard Smithsonian Astrophysical Observatory
Instituto de Astrofisica de Canarias (IAC)
Carlos Allende Prieto (IAC)
Antonio Cabrera Lavers (GTC, IAC)
University of Texas
McDonald Observatory
Related links:
Publication: http://adsabs.harvard.edu/abs/2012arXiv1208.5051H
CaosyCiencia items (includes video): http://www.caosyciencia.com/ideas/articulo.php?id=310112
NASA Reveals Extreme Objects, Millions Of Black Holes, Hot Dog Galaxies, Space Geysers And Other Rarities In Major Press Conference, Video
August 31st, 2012By Alton Parrish.


Image credit: NASA/ESA
Starry Night Tango: This simulation, which represents a few billion years of evolution, shows two disk galaxies interacting in a graceful gravitational dance. The color represents the temperature of the gas in the galaxies. The simulation shows how gravity can rearrange the gas and stars in galaxies during these interaction events, fueling the supermassive black holes at the centers of each galaxy. Radiation from the energized black holes can heat up the gas and blow it away, causing the outbursts seen in the animation. NASA’s Wide-field Infrared Survey Explorer (WISE) is discovering some of the most active, powerful galaxies known, which in some cases may have been fueled by such mergers.
Galaxies Burn Bright Like High-Wattage ‘Light Bulbs’: NASA’s Wide-field Infrared Survey Explorer (WISE) has identified about 1,000 extremely obscured objects over the sky, as marked by the magenta symbols. These hot dust-obscured galaxies, or “hot DOGs,” are turning out to be among the most luminous, or intrinsically bright objects known, in some cases putting out over 1,000 times more energy than our Milky Way galaxy.

Image credit: NASA/JPL-Caltech/UCLA

Image credit: NASA/JPL-Caltech/UCLA

Image credit: NASA/JPL-Caltech/UCLA/STScI
Homing in on ‘Hot Dogs’: This image is a portion of the all-sky survey from NASA’s Wide-field Infrared Survey Explorer, or WISE. It highlights the first of about 1,000 “hot DOGs” found by the mission (magenta circle). Hot DOGs are hot dust-obscured galaxies and are among the most powerful galaxies known. Yellow circles are active supermassive black holes found by WISE, which are much more common.
The panels at right show the “Hot DOG” as seen in the four individual infrared bands obtained by WISE. These images are at wavelengths from 5 to 30 times redder than what our eyes can see, with the shortest wavelengths at top, and longest at bottom.
Dust affects shorter wavelengths more than longer wavelengths. These objects are so dusty that not only their visible light but also their shorter-wavelength infrared light is blocked, as evident by their apparent absence in the top two panels. Less than one in 100,000 WISE sources are similarly prominent only in the two longer-wavelength WISE infrared bands.

Image credit: NASA/JPL-Caltech/UCLA
More than 100 of these objects, located about 10 billion light-years away, have been confirmed using the W.M. Keck Observatory on Mauna Kea, Hawaii, as well as the Gemini Observatory in Chile, Palomar’s 200-inch Hale telescope near San Diego, and the Multiple Mirror Telescope Observatory near Tucson, Ariz.
The small images near the top show more familiar objects at a range of temperatures from 70 Kelvin, or minus 330 degrees Fahrenheit, for liquid nitrogen, to 1,500 Kelvin, or 2,240 degrees Fahrenheit, for lava. The energy from hotter objects peaks at shorter wavelengths.
The extreme WISE objects represented by the purple band are much brighter — and peak at much shorter, or hotter, wavelengths — than the typical infrared luminous galaxy, hence their nickname: hot dust-obscured galaxies, or Hot DOGs.

Image credit: NASA/JPL-Caltech/UCLA

› Fornax galaxy cluster › Andromeda galaxyThe three technical journal articles, including PDFs, can be found at http://arxiv.org/abs/1205.0811,http://arxiv.org/abs/1208.5517 andhttp://arxiv.org/abs/1208.5518 .
JPL manages and operates WISE for NASA’s Science Mission Directorate, Washington. The principal investigator, Edward Wright, is at UCLA. The mission was competitively selected under NASA’s Explorers Program managed by the Goddard Space Flight Center, Greenbelt, Md. The science instrument was built by the Space Dynamics Laboratory, Logan, Utah, and the spacecraft was built by Ball Aerospace & Technologies Corp., Boulder, Colo. Science operations and data processing and archiving take place at the Infrared Processing and Analysis Center at the California Institute of Technology in Pasadena. Caltech manages JPL for NASA.
More information is online at http://www.nasa.gov/wise, http://wise.astro.ucla.edu andhttp://jpl.nasa.gov/wise .
Nerves Control Iridescence In Squid’s Remarkable ‘Electric Skin’ MBL Scientists Discover
August 30th, 2012By Alton Parrish.
Credit: Wardill, Gonzalez-Bellido, Crook & Hanlon, Proceedings of the Royal Society B: Biological Sciences

Credit: Wardill, Gonzalez-Bellido, Crook & Hanlon, Proceedings of the Royal Society B: Biological Sciences

Credit: Wardill, Gonzalez-Bellido, Crook & Hanlon, Proceedings of the Royal Society B: Biological Sciences
“One possibility is the animals do not care about the color of the iridophores, but shifting the color from red to blue will dramatically increase the relative brightness of iridophores,” says Wardill. “This is because squid see predominantly blue light. Blue light is especially important in the ocean as it penetrates best into deeper water.”
The study, co-authored by Gonzalez Bellido, Wardill, Hanlon of the MBL and Robyn Crook of University of Texas Medical School at Houston appeared in the August 15th issue of the journal Biological Sciences. The work was funded by grants from the Office of Naval Research (ONR), Defense Advanced Research Projects Agency (DARPA), and Air Force Office of Scientific Research.
The Marine Biological Laboratory (MBL) is dedicated to scientific discovery and improving the human condition through research and education in biology, biomedicine, and environmental science. Founded in 1888 in Woods Hole, Massachusetts, the MBL is an independent, nonprofit corporation.
41 New Planets in 20 Star Systems in Kepler Field of View
August 27th, 2012By Alton Parrish.
Two newly submitted studies verify 41 new transiting planets in 20 star systems. These results may increase the number of Kepler’s confirmed planets by more than 50 percent: to 116 planets hosted in 67 systems, over half of which contain more than one planet. The papers are currently under scientific peer-review.

Credit: Jason Steffen, Fermilab Center for Particle Astrophysics
Nineteen of the newly validated planetary systems have two closely spaced transiting planets and one system has three. Five of the systems are common to both of these independent studies.
The planets range from Earth-size to more than seven times the radius of Earth, but generally orbit so close to their parent stars that they are hot, inhospitable worlds.
The planets were confirmed by analyzing Transit Timing Variations (TTVs). In closely packed systems, the gravitational pull of the planets causes the acceleration or deceleration of a planet along its orbit. These “tugs” cause the orbital period of each planet to change from one orbit to the next. TTV demonstrates that two transiting planet candidates are in the same system and that their masses are planetary in nature.
“These systems, with their large gravitational interactions, give us important clues about how planetary systems form and evolve,” said lead researcher Jason Steffen, the Brinson postdoctoral fellow at Fermilab Center for Particle Astrophysics in Batavia, Ill. “This information helps us understand how our own solar system fits into the population of all planetary systems.”
The two research teams used data from NASA’s Kepler space telescope, which measures dips in the brightness of more than 150,000 stars, to search for transiting planets.
“The sheer volume of planet candidates being identified by Kepler is inspiring teams to look at the planet confirmation and characterization process differently. This TTV confirmation technique can be applied to large numbers of systems relatively quickly and with little or no follow-up observations from the ground,” said Natalie Batalha, Kepler mission scientist at NASA’s Ames Research Center, Moffett Field, Calif. “Perhaps the bottleneck between identifying planet candidates and confirming them just got a little wider.”
To read more about the results, see:
J Steffen et al, 2012, Transit Timing Observations from Kepler: VII; and, Ji-Wei Xie, 2012, Transit Timing Variation of Near-Resonant KOI Pairs
Ames Research Center in Moffett Field, Calif., manages Kepler’s ground system development, mission operations and science data analysis. NASA’s Jet Propulsion Laboratory, Pasadena, Calif., managed the Kepler mission’s development.
Ball Aerospace and Technologies Corp. in Boulder, Colo., developed the Kepler flight system and supports mission operations with the Laboratory for Atmospheric and Space Physics at the University of Colorado in Boulder.
The Space Telescope Science Institute in Baltimore archives, hosts and distributes Kepler science data. Kepler is NASA’s 10th Discovery Mission and is funded by NASA’s Science Mission Directorate at the agency’s headquarters in Washington.
For more information about the Kepler mission, visit: http://www.nasa.gov/kepler
Ten States With the Worst STD Problems
August 27th, 2012By Alton Parrish.
As of 2010 research, gonorrhea is up, chlamydia is diagnosed faster thanks to more accurate screening measures, and syphilis declined after experiencing a brief spike. Delving into the intricate whats and whys behind why some states in particular see surges in different STDs and STIs over others proves exceptionally complicated, but it definitely means one solid, absolute conclusion. Wherever possible, whenever possible (and appropriate — it might not go over so well as a Thanksgiving dinner topic!), teach communities about proper safe sex protocol. Doing so will hack away at these disconcerting numbers and hopefully save some lives along the way.
For consistency’s sake, all data comes courtesy of the Center for Disease Control’s 2010 Sexually Transmitted Diseases Surveillance. Please keep in mind the research does not cover STDs and STIs on the whole, so it will be presented as the top 10 per the three diseases their studies measured. Rates on other conditions might skew rankings of which states seem to experience the worst STD problems, but regardless of where one chooses to engage in sexual contact, one must always be careful. Obviously, practicing safe sex reduces the risk of more than just chlamydia, gonorrhea, and syphilis, and everyone should receive a thorough, balanced education on the best prevention methods, recognizing symptoms, and treatment options.
Alaska (chlamydia), Mississippi (gonorrhea), Louisiana (syphilis):

In 2010, Alaska saw 6,019 cases of chlamydia reported, at a rate of 861.7 per every 100,000 citizens. Gonorrhea impacted 209.9 out of 100,000, or 6,195 total, Mississippians. 12.2 out of 100,000 Louisiana residents live with syphilis, meaning about 546 reported cases.
Mississippi (chlamydia), Louisiana (gonorrhea), Georgia (syphilis):

Mississippi’s chlamydia rate sits at 725.5 cases per 100,000, with 21,417 people receiving treatment. 8,912 Louisiana residents suffered from gonorrhea, making the rate 198.4 out of 100,000. In Georgia, 8.1 out of 100,000 (or 795 reported cases) individuals must contend with syphilis.
Louisiana (chlamydia), Alaska (gonorrhea), Mississippi (syphilis):

Meanwhile, in Louisiana, healthcare providers reported treating 29,151 cases of chlamydia, and the rate stands at around 648.9 out of 100,000 as a result. Alaska saw its gonorrhea rate at 198.4 out of 100,000, meaning 1,273 citizens received such a diagnosis. Syphilis affects 228, or 7.7 out of 100,000, Mississippians.
New Mexico (chlamydia), South Carolina (gonorrhea), Arkansas (syphilis):

The chlamydia rate in New Mexico is 582.5 per 100,000 residents, and it impacted 11,706 people in 2010. That same year, 7,970 South Carolinians experienced gonorrhea, at a rate of 174.7 out of 100,000. Arkansas citizens saw their syphilis rate sit at 7.1 out of every 100,000 people, for a total of 205 reported cases.
South Carolina (chlamydia), Alabama (gonorrhea), Illinois (syphilis):

Chlamydia affects 26,525 residents of South Carolina, making the rate 582.5 out of 100,000. 168.5 out of 100,000 Alabama citizens (7,933 reported cases) received treatment for gonorrhea in 2010. In Illinois, the syphilis rate sits at 7 out of 100,000, and – as of 2010 – there exists about 908 reported cases.
Alabama (chlamydia), Arkansas (gonorrhea), Florida (syphilis):

Alabama’s 2010 chlamydia rate was 574.3 out of 100,000 people, a number stemming from a total of 27.041 reported cases. In Arkansas, 165 out of 100,000, or 4,769 individuals, had to deal with gonorrhea. 1,184 Floridians live with syphilis, making the rate about 6.4 out of every 100,000 individuals.
Arkansas (chlamydia), Georgia (gonorrhea), Maryland (syphilis):

In Arkansas, the 15,424 individuals with chlamydia meant a rate of 533.8 out of 100,000. Georgia’s gonorrhea rate sits at 161.3 out of 100,000, or 15,582 total reported cases. Syphilis affects 5.8 out of 100,000 Maryland residents, and 2010 saw about 328 individuals with the diagnosis.
New York (chlamydia and syphilis), North Carolina (gonorrhea):

New York ranks eighth in the United States for both chlamydia and syphilis, with 511.3 out of 100,000 (99,920 total cases) for the former and 5.6 out of 100,000 (1,098) for the latter. Gonorrhea affects 14,111 — or around 150.4 out of 100,000 – North Carolinians.
Delaware (chlamydia), Ohio (gonorrhea), California (syphilis):

4,464 Delaware residents experienced chlamydia in 2010, making the state’s rate hovering around 504.4 out of 100,000. In Ohio, 142.9 out of 100,000 citizens reported gonorrhea, meaning about 16,496 individual cases. Ninth place syphilis state California houses 2,065 instances, at a rate of 5.6 out of 100,000 citizens.
Michigan (chlamydia and gonorrhea), Alabama (syphilis):

Michigan saw its chlamydia rate as 496.3 out of 100,000, for a total of 49,478 reported cases. And, when it comes to gonorrhea, the 16,496 individuals with the diagnoses means a rate of 142.9 out of 100,000. Alabama came in at 5.5 out of 100,000 for syphilis.
Contacts and sources:
Christine Seivers
http://www.medicalbillingandcoding.org/blog/10-states-with-the-worst-std-problems/
Giant Galaxy Cluster Sets Record Pace For Star Creation, Astronomers Stunned
August 16th, 2012By Alton Parrish.
As vast as the Milky Way may seem, our sprawling galaxy is but a speck next to the largest structures in the universe: galaxy clusters — collections of hundreds to thousands of galaxies bound together by gravity. At the heart of most galaxy clusters sit massive old galaxies, within which only a few new stars are born each year.
Now a multi-institution team led by MIT researchers has identified a galaxy cluster seven billion light-years away that dwarfs most known clusters, churning out a dazzling 740 new stars per year in the central galaxy. The galaxy cluster is among the most massive and most luminous in the universe. While scientists have formally catalogued the cluster by the name SPT-CLJ2344-4243, the MIT-led group has a more informal moniker: the Phoenix cluster, named after the constellation in which it resides.
The Phoenix Cluster, shown here as it appears in microwave (orange), optical (red, green, and blue) and ultraviolet (blue) wavelengths, is forming stars at the highest rate ever observed for the middle of a galaxy cluster. The Phoenix Cluster was discovered by a collaboration of astronomers from the University of Chicago’s Kavli Institute for Cosmological Physics and elsewhere.

Credit: South Pole Telescope collaboration
Follow-up observations made in ultraviolet, optical and infrared wavelengths show that stars are forming in this object at the highest rate ever seen in the middle of a galaxy cluster. The object also is the most powerful producer of X-rays of any known cluster, and among the most massive of clusters. The data also suggest that the rate of hot gas cooling in the central regions of the cluster is the largest ever observed.
Officially known as SPT-CLJ2344-4243, this galaxy cluster has been dubbed the “Phoenix Cluster” because it is located in the constellation of the Phoenix, and because of its remarkable properties. Scientists at the University of Chicago’s Kavli Institute for Cosmological Physics and their collaborators initially found the cluster, located about 5.7 billion light years from Earth, using the Sunyaev-Zel’dovich effect, the shadow that the cluster makes in fossil light leftover from the big bang.

Courtesy of NASA/CXC/M. Weiss
Predicted in 1972, the effect was first demonstrated to find previously unknown clusters of galaxies by the South Pole Telescope collaboration in 2009. Observations of the effect have since opened a new window for astronomers to discover the most massive, distant clusters in the universe.
“The mythology of the Phoenix — a bird rising from the dead — is a perfect way to describe this revived object,” said Michael McDonald, a Hubble Fellow at the Massachusetts Institute of Technology’s Kavli Institute for Astrophysics and Space Research. McDonald is the lead author of a paper appearing in the Aug. 16 issue of the journal Nature, which presents these findings. “While galaxies at the center of most clusters have been dead for billions of years, the central galaxy in this cluster seems to have come back to life,” McDonald said.
New findings about an extraordinary galaxy cluster discovered by the National Science Foundation’s 10-meter South Pole Telescope, pictured here, and later followed-up by eight other world-class observatories, appear in the Aug. 16 issue of the journal Nature.

Credit: Daniel Luong-Van
Stars Forming At Incredible Rate
Like other galaxy clusters, Phoenix holds a vast reservoir of hot gas that contains more normal matter than all of the galaxies in the cluster combined. The reservoir of hot gas can be detected with X-ray telescopes like NASA’s Chandra X-ray Observatory, and the shadow it makes in the light from the big bang can be detected with the South Pole Telescope. The prevailing wisdom had once been that this hot gas should cool over time and sink to the center of the cluster, forming huge numbers of stars.
However, most galaxy clusters have formed very few stars over the last few billion years. Astronomers think that the supermassive black hole in the central galaxy of clusters pumps energy into the system, preventing cooling of gas from causing a burst of star formation. The famous Perseus Cluster is an example of a black hole bellowing out energy and preventing the gas from cooling to form stars at a high rate.
With its black hole not producing powerful enough jets, the center of the Phoenix Cluster is buzzing with stars that are forming 20 times faster than in the Perseus Cluster. This rate is the highest seen in the center of a galaxy cluster and is comparable to the highest seen anywhere in the universe.
The frenetic pace of star birth and cooling of gas in Phoenix are causing both the galaxy and the black hole to add mass very quickly — an important phase that the researchers predict will be relatively short-lived.
“The galaxy and its black hole are undergoing unsustainable growth,” said co-author Bradford Benson, a Kavli Institute Fellow at UChicago. “This growth spurt can’t last longer than about a hundred million years, otherwise the galaxy and black hole would become much bigger than their counterparts in the nearby universe.”
Searching For Other Galaxy Clusters
Remarkably, the Phoenix Cluster and its central galaxy and supermassive black hole are already among the most massive known objects of their type. Because of their tremendous size, galaxy clusters are crucial objects for studying cosmology and galaxy evolution and so finding one with such extreme properties like the Phoenix Cluster is important.
Figure Optical (red, green, blue) and ultraviolet (blue) image of center of Phoenix Cluster, and optical images of Abell 2029 and Abell 2052. Top image taken with the NOAO Blanco telescope.

Image courtesy of the Chandra X-ray Observatory.
“The beauty of the SZ effect for cosmology is that it is as easy to detect a cluster of galaxies in the distant reaches of the observable universe as it is for one nearby,” said UChicago’s John Carlstrom, the S. Chandrasekhar Distinguished Service Professor in Astronomy & Astrophysics. “The magnitude of the effect depends on the mass of the object and not its distance from Earth.”
Galaxy clusters contain enough hot gas to create detectable “shadows” in the light left over from the big bang, which also is known as the cosmic microwave background radiation. This light has literally travelled for 14 billion years across the entire observable universe to get to Earth. If it passes through a massive cluster on its way, then a tiny fraction of the light gets scattered to higher energies — the Sunyaev-Zel’dovich effect.
The South Pole Telescope collaboration has now completed an SZ survey of a large region of the sky finding hundreds of distant, massive galaxy clusters. Further follow-up observations of the clusters at X-ray and other wavelengths may reveal the existence of additional Phoenix-like galaxy clusters.
Animation of cooling gas and stars forming near center of Phoenix Cluster.
Credit: Chandra X-ray Observatory’
Also contributing observations of the Phoenix Cluster were the Gemini Observatory and the Blanco 4-meter and Magellan telescopes, all in Chile, while several space-based telescopes were used to measure the cluster’s star-formation rate.
Until now, evidence for what astronomers suspect happens at the cores of the largest galaxy clusters has been uncomfortably scarce. Theory predicts that cooling flows of gas should sink toward the cluster’s center, sparking extreme star formation there, but so far – nada, zilch, not-so-much.
The situation changed dramatically when a large international team of over 80 astronomers, led by Massachusetts Institute of Technology’s Hubble Fellow Michael McDonald, studied a recently discovered (yet among the largest-known) galaxy cluster. The team found evidence for extreme star formation, or a starburst, significantly more extensive than any seen before in the core of a giant galaxy cluster. “It is indeed reassuring to see this process in action,” says McDonald. “Further study of this system may shed some light on why other clusters aren’t forming stars at these high rates, as they should be.”
The result, published in the August 16th issue of the journal Nature, began developing in 2010 when data from the South Pole Telescope (SPT) allowed astronomers to identify the huge cluster of galaxies some 5.7 billion light-years distant. Designated SPT-CLJ2344-4243, it is among the largest galaxy clusters in the universe.
“Our first observations of this cluster with the Gemini South telescope in Chile really helped to ignite this work,” says McDonald. “They were the first hints that the central galaxy in this cluster was such a beast!” The paper’s second author, Matthew Bayliss of Harvard University, adds, “When I first saw the Gemini spectrum, I thought we must have mixed up the spectra, it just looked so bizarre compared to anything else of its kind.” Bayliss and Harvard graduate student Jonathan Ruel used the Gemini data to determine the cluster’s distance; they also corroborated its huge mass with estimates from X-ray data obtained with the Chandra X-ray Observatory. Additional survey data from the National Optical Astronomy Observatory’s (NOAO) Blanco Telescope in Chile augmented the early characterization of this cluster. A Blanco image of the cluster (Figure 1, top) is available as part of this press release.
Optical/UV/X-ray composite with a pull-out from the central region to optical/UV image.

Image courtesy of the Chandra X-ray Observatory.
With this result, astronomers now believe they have finally seen, at least in this one large cluster of galaxies, what they expected to find all along – a massive burst of star formation, presumably fueled by an extensive flow of cooling gas streaming inward toward the cluster’s central core galaxy. The sinking gas is likely sparking star formation and a lively, dynamic environment – somewhat like a cold front triggering thunderstorms on a hot summer’s day. This is in rich contrast to most other large galaxy clusters where central galaxies appear to have stopped forming new stars billions of years ago – an uncomfortable discrepancy known as the “cooling-flow problem.”
According to theory, the hot plasma that fills the spaces between galaxy cluster members should glow in X-rays as it cools, in much the same way that hot coals glow red. As the galaxy cluster forms, this plasma initially heats up due to the gravitational energy released from the infall of smaller galaxies. As the gas cools, it should condense and sink inward (known as a cooling flow). In the cluster’s center, this cooling flow can lead to very dense cores of gas, termed “cool cores,” which should fuel bursts of star formation in all clusters that go through this process. Most of these predictions had been confirmed with observations—the X-ray glow, the lower temperatures at the cluster centers— but starbursts accompanying this cooling remain rare.
SPT-CLJ2344-4243, nicknamed the “Phoenix Cluster, lies in the direction of the southern constellation Phoenix, which McDonald suggests is fitting. “The mythology of the Phoenix – a bird rising from the dead – is a great way to describe this revived object,” says McDonald. “While galaxies at the center of most clusters may have been dormant for billions of years, the central galaxy in this cluster seems to have come back to life with a new burst of star formation.”
The team combined multiple ground- and space-based observations including data from the Gemini South 8-meter and the NOAO Blanco 4-meter telescopes, both in Chile and funded with support by the U.S. National Science Foundation (as is the South Pole Telescope which made the initial discovery of this galaxy cluster in 2010). Observations critical to this research also included the Chandra X-ray Observatory, NASA’s WISE and GALEX observatories, and the European Space Agency’s Herschel Observatory.
Looking for a cool core
The new galaxy cluster may shed new light on a decades-old astrophysical conundrum termed the “cooling flow problem.” Gas at the core of a cluster, spewed from nearby galaxies and supernova explosions, should naturally cool over time, forming a flow cold enough to condense and form new stars. However, scientists have been unable to identify any galaxy cluster that does, in fact, cool at the rates predicted.
One explanation, McDonald says, may be that a cluster’s natural cooling is somehow interrupted. He cites the Perseus cluster as an example: The black hole at the center of this cluster emits jets of particles that may act to reheat the core, preventing it from cooling completely.
The image on the left shows the newly discovered Phoenix Cluster, located about 5.7 billion light years from Earth. This composite includes an X-ray image from NASA’s Chandra X-ray Observatory in purple, an optical image from the 4m Blanco telescope in red, green and blue, and an ultraviolet (UV) image from NASA’s Galaxy Evolution Explorer (GALEX) in blue. The Chandra data reveal hot gas in the cluster and the optical and UV images show galaxies in the cluster and in nearby parts of the sky.

Credit: Credits: X-ray: NASA/CXC/MIT/M.McDonald; UV: NASA/JPL-Caltech/M.Mc
“What’s interesting about the Phoenix cluster is that we see almost all the cooling that was predicted,” McDonald says. “It could be that this is earlier in the evolution where there’s nothing stopping it, so it cools and becomes a starburst … in fact, there are few things forming stars in the universe faster than this galaxy.”
Getting the complete view
The Phoenix cluster was first detected in 2010 by researchers using the South Pole Telescope, a 10-meter-wide telescope in Antarctica that scans huge patches of the sky for new galaxy clusters. McDonald and his colleagues recently used the space-based Chandra X-Ray Observatory to study the most massive clusters identified by the South Pole Telescope. Immediately, the Phoenix cluster stood out in the X-ray data as the brightest of the clusters — a finding that prompted McDonald to follow up with more observations of the cluster from more telescopes.
Microwave (orange), optical (red, green, blue) and ultraviolet (blue) image of the Phoenix Cluster.
The team ultimately acquired images of the Phoenix cluster from 10 different telescopes in space and on the ground around the world. Each telescope observed the cluster at different wavelengths, illuminating different features of it.
“The central black hole is very bright in the X-ray, but the star formation is very bright in the optical and ultraviolet,” McDonald says. “So you need to work together with all these different telescopes to get a complete view.”
The team combined data from all 10 telescopes to determine the galaxy cluster’s mass and luminosity. To calculate the mass, the group first measured the cluster’s temperature, which was estimated by observing the cluster’s peak wavelength. McDonald explains that the wavelength at which an object peaks reveals information about its temperature — so the researchers identified the Phoenix cluster’s peak wavelength in the X-ray spectrum, then calculated its temperature.
From the cluster’s temperature, the group calculated its mass: The hotter a ball of gas, the greater its overall mass. The researchers found the Phoenix cluster is easily among the most massive clusters in the universe.
The group then looked for signs of star formation; new stars are particularly bright in the ultraviolet, and the researchers found that ultraviolet images taken of the cluster revealed hundreds of young stars in its core. The cluster’s extreme luminosity also indicated that it was cooling very rapidly, most likely providing the fuel for star formation.
Brian McNamara, a professor of astrophysics at the University of Waterloo, says the extreme starburst identified by the group may illustrate how the most massive primeval galaxies may have formed. He adds that the Phoenix cluster’s exceptional behavior may result from a faulty mechanism at its core.
“It shows cooling and star formation during a phase when the supermassive black hole lurking in the galaxy’s nucleus seems to be asleep at the switch,” McNamara says. “But once the black hole gets going and begins to push the hot atmosphere aside, perhaps in another 100 million years or so, it should shut down cooling and reduce the star formation rate in a feedback process that is active in most galaxy clusters.”
McDonald hopes to access the Hubble Space Telescope to continue studying this massive galaxy cluster. “You’d see these fantastic blue filaments where stars are forming out of cooling streams,” McDonald says. “It should look quite remarkable, instead of our ground-based images which show a blob of blue light.”
As for the cluster’s seemingly anomalous cooling, McDonald guesses that perhaps the phenomenon is not as exceptional as it appears.
“It could be a timing thing, where 1 percent of the time you get this vigorous star formation and runaway cooling,” McDonald says. “It might be that every cluster we see goes through this phase, but it’s so short-lived that this is the only one we’ve found. And we were in the right place at the right time.”
Contacts and sources:’
Steve Koppes
University of Chicago
Chandra X-ray Observatory
Peter Michaud
Gemini Observatory, Hilo, HI
Antonieta Garcia
Gemini Observatory, La Serena, Chile
MIT
New Fossils From The Turkana Basin Shed Light On Early Human Evolution
August 13th, 2012By Alton Parrish.
One of the newly discovered fossils, KNM-ER62000. The face is very similar to that of the enigmatic fossil known as KNM-ER 1470, discovered four decades ago.

Photo credit: Fred Spoor.Exciting new fossils discovered east of Lake Turkana confirm that there were two additional species of our genus –Homo – living alongside our direct human ancestral species, Homo erectus, almost two million years ago. The finds, announced in the scientific journal Nature on August 9th, include a face, a remarkably complete lower jaw, and part of a second lower jaw. They were uncovered between 2007 and 2009 by the Koobi Fora Research Project (KFRP), led by Meave and Louise Leakey (both of Stony Brook University and the Turkana Basin Institute). KFRP’s fieldwork was facilitated by TBI and supported by the National Geographic Society.
Four decades ago, the KFRP discovered the enigmatic fossil known as KNM-ER 1470 (or “1470” for short). This skull, readily distinguished by its large brain size and long flat face, ignited a longstanding debate about just how many different species of early Homo lived alongside Homo erectus during the Pleistocene epoch. 1470’s unusual morphology was attributed by some scientists to sexual differences and natural degrees of variation within a single species, whereas others interpreted the fossil as evidence of a separate species.

Photo credit: Mike Hettwer.
This decades-old dilemma has endured for two reasons. First, comparisons with other fossils have been limited due to the fact that 1470’s remains do not include its teeth or lower jaw. Second, no other fossil skull has mirrored 1470’s flat and long face, leaving in doubt just how representative these characteristics are. The new fossils address both issues.
“For the past 40 years we have looked long and hard in the vast expanse of sediments around Lake Turkana for fossils that confirm the unique features of 1470’s face and show us what its teeth and lower jaw would have looked like,” says Meave Leakey. “At last we have some answers.”
“Combined, the three new fossils give a much clearer picture of what 1470 looked like,” says Fred Spoor, leader of the scientific analyses. “As a result, it is now clear that two species of early Homo lived alongside Homo erectus. The new fossils will greatly help in unraveling how our branch of human evolution first emerged and flourished almost two million years ago.”
 Credit: Fred Spoor
Found within a radius of just over 10 km from 1470’s location, the three new fossils are dated between 1.78 million and 1.95 million years old. The face KNM-ER 62000, discovered by field crew member Elgite Lokorimudang in 2008, is very similar to that of 1470, showing that the latter is not a single “odd one out” individual. Moreover, the face’s well-preserved upper jaw has almost all of its cheek teeth still in place, which for the first time makes it possible to infer the type of lower jaw that would have fitted 1470. A particularly good match can be found in the other two new fossils, the lower jaw KNM-ER 60000, found by Cyprian Nyete in 2009, and part of another lower jaw, KNM-ER 62003, found by Robert Moru in 2007. KNM-ER 60000 stands out as the most complete lower jaw of an early member of the genus Homo yet discovered.
The team working on the new finds included Christopher Kiarie (TBI), who carried out the laboratory preparation of the fossils, Craig Feibel (Rutgers University), who studied the age of the fossils, and Susan Antón (New York University), Christopher Dean (UCL, University College London), Meave and Louise Leakey (TBI, Kenya; and Stony Brook University, New York) and Fred Spoor (Max Planck Institute for Evolutionary Anthropology, Leipzig and UCL), who analysed the fossils. The National Geographic Society funded the fieldwork, the Leakey Foundation funded geological studies, and the Max Planck Society supported laboratory work.
Contacts and sources:
Turkana Basin Institute
BOSS Largest 3D Map of the Sky: The Cosmic Ruler And The Key To The History Of The Universe
August 12th, 2012By Alton Parrish.
The Third Sloan Digital Sky Survey (SDSS-III) has issued Data Release 9 (DR9), the first public release of data from the Baryon Oscillation Spectroscopic Survey (BOSS). In this release BOSS, the largest of SDSS-III’s four surveys, provides spectra for 535,995 newly observed galaxies, 102,100 quasars, and 116,474 stars, plus new information about objects in previous Sloan surveys (SDSS-I and II)

Credit: Lawrence Berkeley National Laboratory and Sloan Digital Sky Survey III

Credit: Miguel A. Aragón (Johns Hopkins University), Mark SubbaRao (Adler Planetarium), Alex Szalay (Johns Hopkins University), Yushu Yao (Lawrence Berkeley National Laboratory, NERSC), and the SDSS-III Collaboration
The new release lists spectra for galaxies with redshifts up to z = 0.8 (roughly 7 billion light years away) and quasars with redshifts between z = 2.1 and 3.5 (from 10 to 11.5 billion light years away). When BOSS is complete it will have measured 1.5 million galaxies and at least 150,000 quasars, as well as many thousands of stars and other “ancillary” objects for scientific projects other than BOSS’s main goal.
<iframe width=”640″ height=”360″ src=”http://www.youtube.com/embed/FUXwaLsy3lo?feature=player_embedded” frameborder=”0″ allowfullscreen></iframe>
The key to the history of the universe
BOSS is designed to measure baryon acoustic oscillation (BAO), the large-scale clustering of matter in the universe. BAO began as rippling fluctuations (“sound waves”) in the hot, dense soup of matter and radiation that made up the early universe. As the universe expanded it cooled. Finally atoms formed and radiation went its own way; the density ripples left their marks as temperature variations in the cosmic microwave background (CMB), where they can be detected today.
Marks on the cosmic ruler
Schlegel has called BAO “an inconveniently sized ruler,” requiring “a huge volume of the universe just to fit the ruler inside,” but it’s a precision tool for tracking the universe’s expansion history, and for probing the nature of gravity and the mysterious dark energy that’s causing expansion to accelerate.
To fill the huge volume, BOSS had to find more and fainter objects in the sky at greater distances than SDSS had attempted before. The camera system and spectrographs of the 2.5-meter Sloan Foundation Telescope at the Apache Point Observatory in New Mexico had to be completely rebuilt.
Slices through the SDSS 3-dimensional map of the distribution of galaxies. Earth is at the center, and each point represents a galaxy, typically containing about 100 billion stars. Galaxies are colored according to the ages of their stars, with the redder, more strongly clustered points showing galaxies that are made of older stars. The outer circle is at a distance of two billion light years. The region between the wedges was not mapped by the SDSS because dust in our own Galaxy obscures the view of the distant universe in these directions. Both slices contain all galaxies within -1.25 and 1.25 degrees declination.

Credit: M. Blanton and the Sloan Digital Sky Survey.
SDSS uses “plug plates” at the telescope’s focal plane, aluminum disks with holes drilled to match the precise position of previously imaged target objects. SDSS-I and II plug plates had only 640 holes apiece, each covering three arcseconds; BOSS is using 2,000 plug plates with 1,000 holes apiece, each covering a tight two arcseconds to reduce light that’s not from the target.
Optical fibers are plugged into the holes every day by hand, to guide the light from each target to a spectrograph. While weather conditions vary night to night, observations on the best nights use up to nine plug plates. For BOSS, the spectrographs were rebuilt with new optics and new CCD detectors designed and fabricated at Berkeley Lab.
“Light from distant galaxies arrives at Earth redshifted into the infrared,” says Natalie Roe, director of Berkeley Lab’s Physics Division and BOSS’s instrument scientist, who led construction of the spectrographs. “We optimized the BOSS spectrographs for mapping exactly these galaxies.”
The bottom panel shows the sky coverage of the final SDSS imaging survey, including data from SDSS I, II, and III.SDSS imaging covered slightly more than 1/3 of the sky, concentrated in the northern and southern Galactic caps (above and below the plane of the galaxy). In this image, stripes are radiating out from these caps; these stripes are areas imaged by the SEGUE survey, extending toward the plane of the Milky Way. Each orange dot in this map is a galaxy.

Credit: M. Blanton and the SDSS-III collaboration
Working with Schlegel and Adam Bolton at the University of Utah, Berkeley Lab’s Stephen Bailey is in charge of daily “extraction pipeline” operations that convert raw data from the telescope into useful spectra and quantities derived from them, ready for scientific analysis. Data storage and the extraction pipeline run on the Riemann Linux cluster of Berkeley Lab’s High-Performance Computing Services Group; the data is copied from Riemann to the University of Utah, New York University, Johns Hopkins University, and the National Energy Research Scientific Computing Center (NERSC) at Berkeley Lab. The Lab also hosts the SDSS-III website,http://sdss3.org, from which the data can be downloaded.
“Data releases are a proud tradition for SDSS, and the first BOSS data greatly increase the SDSS store of information,” Bailey says. “Members of the SDSS-III collaboration get first crack at it – with barely enough time to write up their results – but three times as many papers based on the data are published by scientists outside the collaboration.”
Says Schlegel, “SDSS-III is already the most used of all surveys from any telescope in the world, including the Keck telescopes and the Hubble Space Telescope. With DR9, BOSS contributes a huge information increase for all kinds of scientific investigations, from quasars to how stars evolve to really odd objects like galaxy-scale strong gravitational lenses. Meanwhile the BOSS BAO survey is over two-thirds finished, and ahead of schedule – we’re well on our way to the best measure of BAO that will be made for a long time. All the data BOSS collects will be available to anyone who can use it.”
A mosaic showing 36 of the the 500+ Type Ia supernovae discovered by the Sloan Supernova Survey. Each image is centered on the supernova, which usually stands out as a bright point near or within the galaxy that hosts it. The light of the supernova, powered by the thermonuclear explosion of a single white dwarf star, can outshine that of the tens of billions of stars in its host galaxy. Type Ia supernovae have a constant intrinsic luminosity (after a correction based on the time over which their light rises and falls), so their apparent brightness can be used to infer their distance. The primary goal of the Sloan Supernova Survey was to measure the expansion of the universe with high precision over the last four billion years of cosmic history, to help understand why that expansion is speeding up over time despite the decelerating gravitational effect of atoms and dark matter.

Credit: B. Dilday and the Sloan Digital Sky Survey.
“The Ninth Data Release of the Sloan Digital Sky Survey: First Spectroscopic Data from the SDSS-III Baryon Oscillation Spectroscopic Survey,” by Christopher Ahn et al, has been submitted to the Astrophysical Journal Supplement and may be found on the arXiv preprint server athttp://arxiv.org/abs/1207.7137.
“The Baryon Oscillation Spectroscopic Survey of SDSS-III,” by Kyle Dawson, David Schlegel et al, has been submitted to the Astronomical Journal and may be found on the arXiv preprint server athttp://arxiv.org/abs/1208.0022.
“Spectral Classification and Redshift Measurement for the SDSS-III Baryon Oscillation Spectroscopic Survey,” by Adam Bolton et al, has been submitted to the Astronomical Journal and may be found on the arXiv preprint server at http://arxiv.org/abs/1207.7326
References to these and other papers relating to Data Release 9 are in the SDSS-III Collaboration release at http://www.sdss3.org/press/. Berkeley Lab researchers who are members of BOSS and contributed to these papers include Stephen Bailey, William Carithers, Andreu Font-Ribera, Jessica Kirkpatrick, Beth Reid, Natalie Roe, Nicholas Ross, David Schlegel, and Martin White.
Lawrence Berkeley National Laboratory addresses the world’s most urgent scientific challenges by advancing sustainable energy, protecting human health, creating new materials, and revealing the origin and fate of the universe. Founded in 1931, Berkeley Lab’s scientific expertise has been recognized with 13 Nobel prizes. The University of California manages Berkeley Lab for the U.S. Department of Energy’s Office of Science. For more, visit www.lbl.gov.
DOE’s Office of Science is the single largest supporter of basic research in the physical sciences in the United States, and is working to address some of the most pressing challenges of our time. For more information, please visit the Office of Science website at science.energy.gov/.
Funding for SDSS-III has been provided by the Alfred P. Sloan Foundation, the Participating Institutions, the National Science Foundation, and the U.S. Department of Energy Office of Science. The SDSS-III web site is http://www.sdss3.org.
SDSS-III is managed by the Astrophysical Research Consortium for the Participating Institutions of the SDSS-III Collaboration including the University of Arizona, the Brazilian Participation Group, Brookhaven National Laboratory, University of Cambridge, Carnegie Mellon University, University of Florida, the French Participation Group, the German Participation Group, Harvard University, the Instituto de Astrofisica de Canarias, the Michigan State/Notre Dame/JINA Participation Group, Johns Hopkins University, Lawrence Berkeley National Laboratory, Max Planck Institute for Astrophysics, Max Planck Institute for Extraterrestrial Physics, New Mexico State University, New York University, Ohio State University, Pennsylvania State University, University of Portsmouth, Princeton University, the Spanish Participation Group, University of Tokyo, University of Utah, Vanderbilt University, University of Virginia, University of Washington, and Yale University.
Contacts and sources:
Paul Preuss
DOE/Lawrence Berkeley National Laboratory
Meteor Smoke Makes Strange Clouds
August 11th, 2012
Credit: NASA


Graphic courtesy of Prof. James Russell of Hampton University
Dr. Tony Phillips
Science@NASA
NASA Headquarters
Mountains, Seaway Triggered North American Dinosaur Surge
August 8th, 2012
Credit: Lindsay Zanno
Saurolophine range distribution throughout the Western Interior Basin during the Campanian (lower grey area) and Maastrichtian (upper white area). To the right, paleogeographic maps of North America during the late Campanian (~75 Ma) and late Maastrichtian (~65 Ma).
The project received funding from the National Science Foundation, the Alexander von Humboldt Foundation, the Ministry of Education and Science of Spain and North Carolina State University. The PLOS ONE paper may be accessed at http://dx.plos.org/10.1371/journal.pone.0042135
Contacts and sources:
Andrea Gibson
Ohio University
Cry Of A Shredded Star Heralds A New Era For Testing Relativity
August 3rd, 2012Last year, astronomers discovered a quiescent black hole in a distant galaxy that erupted after shredding and consuming a passing star. Now researchers have identified a distinctive X-ray signal observed in the days following the outburst that comes from matter on the verge of falling into the black hole.

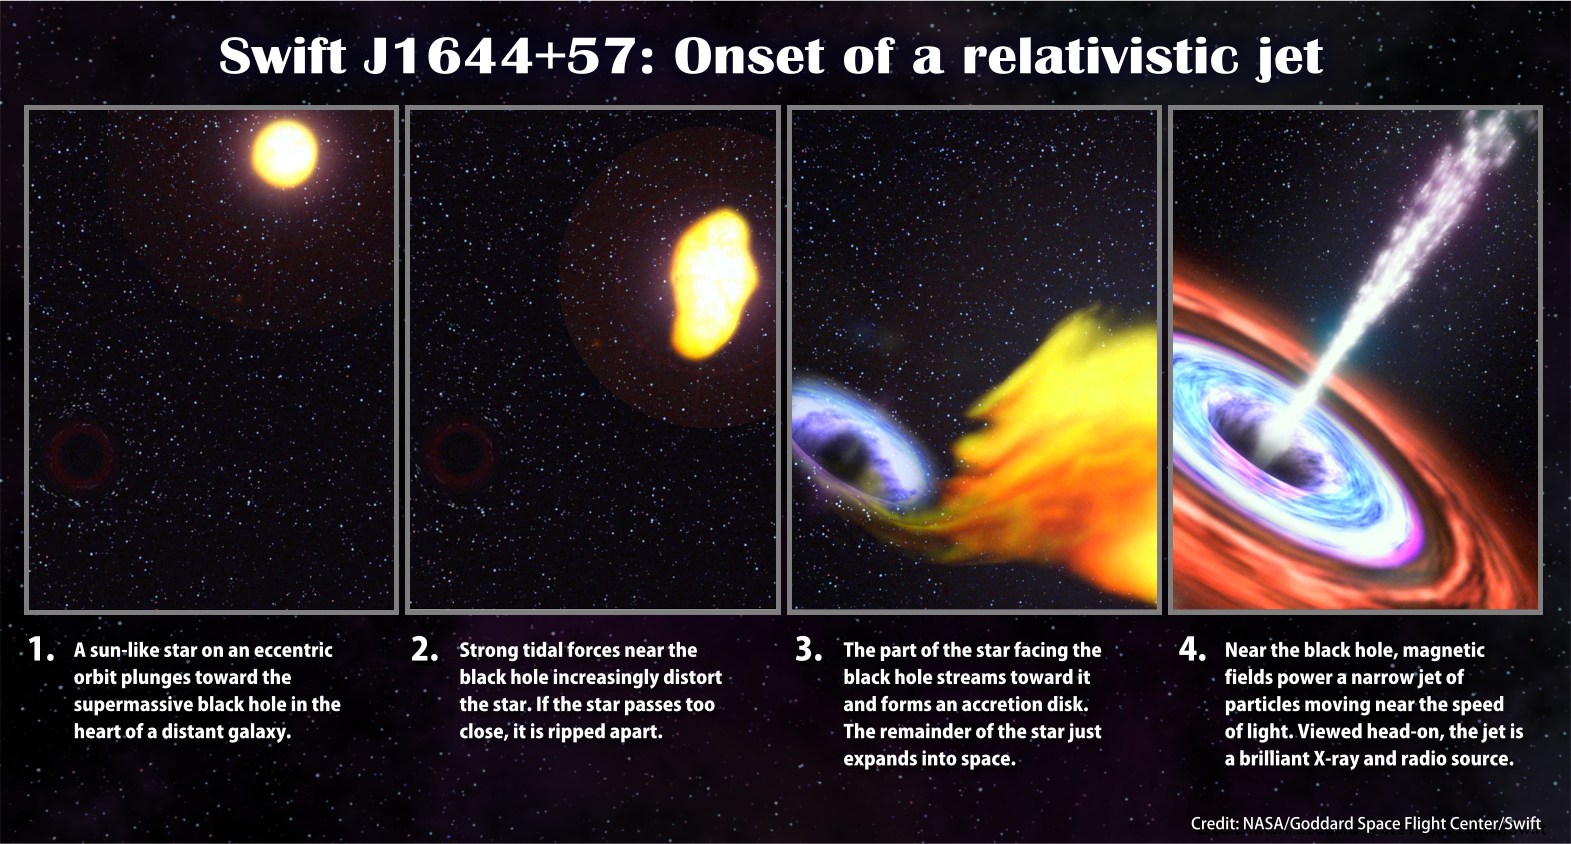
The star experienced intense tides as it reached its closest point to the black hole and was quickly torn apart. Some of its gas fell toward the black hole and formed a disk around it. The innermost part of this disk was rapidly heated to temperatures of millions of degrees, hot enough to emit X-rays. At the same time, through processes still not fully understood, oppositely directed jets perpendicular to the disk formed near the black hole. These jets blasted matter outward at velocities greater than 90 percent the speed of light along the black hole’s spin axis. One of these jets just happened to point straight at Earth.
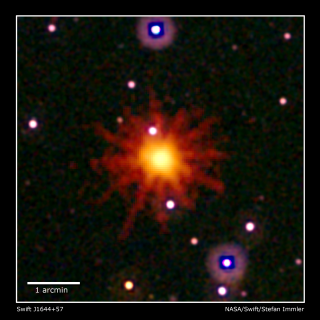
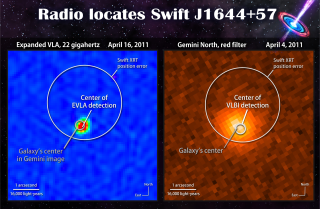
Credit: NRAO/CfA/Zauderer et al.
Research In Spider-Man Versus The Lizard Similar To Actual Science
July 31st, 2012In Spider-Man’s latest adventure in which he fights The Lizard, scientists delve into the field of regenerative medicine as they work to re-grow a human limb. Koudy Williams, D.V.M., a self-described “Spider-Man geek” and real-life regenerative medicine researcher, says the plot of the latest comic book and movie isn’t as far-fetched as some people might think.
Credit: Wake Forest Baptist Medical Center
“We’re working on long-term projects to regenerate fingers and limbs,” says Williams, a professor at Wake Forest Baptist Medical Center’s Institute for Regenerative Medicine. “But we have safer ways to do it than the researchers in Spider-Man.”

Several of the science themes in Spider-Man’s latest adventure – from working to harness the body’s natural regenerative powers to making use of natural materials such as the silk in spiderwebs – are happening today in regenerative medicine laboratories, Williams said. Regenerative medicine is a relatively new field of science that works to replace or repair damaged or diseased tissues and organs.
3-D printing projects under way at the Wake Forest Institute for Regenerative Medicine include prototype kidneys, finger bone and ears.

Credit: Wake Forest Baptist Medical Center
In the latest adventure, a scientist attempts to re-grow his missing arm by combining human genes and genes from a salamander, which has a natural ability to re-grow its limbs. When the experiment goes awry, the scientist becomes a lizard villain.

Credit: Marvel Comics/Wikipedia
A device in the lab shoots out a spider-web-looking material that is caught on a spinning rod. The resulting tubular shapes are used to engineer blood vessels.

Credit: Wake Forest Baptist Medical Center
Williams said real-life researchers take three approaches in their efforts to repair and replace organs. One is to build, or engineer, replacement organs in the lab using a patient’s own cells and an organ-shaped mold or scaffold to support cells as they grow. Bladders, urine tubes and sections of windpipes have all been built in this way and implanted in humans. A second method is to inject healing cells into a diseased organ. The third approach – most like the science portrayed in Spider-Man – is to use drug-like molecules to promote healing from within.
“The body has the capacity to heal naturally,” says Williams. “When there’s an injury, cells release substances known as chemokines that attract other cells to promote healing. That’s how a broken bone repairs itself and the outer layer of the eye re-grows if it is scratched. In regenerative medicine, our aim is to boost this natural healing power.

“The body knows what it needs to heal. We work to see if we can improve on it. This is most like what scientists in the Spider-Man movie were doing. Our projects include evaluating the use of natural materials to speed up nerve regeneration, heal diseased kidneys and improve one of the current options for heart valve replacement.”
Just like in the Spider-Man comic book and movie, researchers at the Wake Forest Institute for Regenerative Medicine and colleagues at other institutions have a long-term project to re-grow fingers and limbs to help wounded military personnel. “We’re years away from being able to bioengineer an arm, or even a finger,” Williams said. “But we’re working on the component parts, including muscle, bone, fat, skin and tendons, and part of our work will be to use the body for the regeneration process.”

Credit: Wake Forest Baptist Medical Center
Williams calls Spider-Man a “science genius” for determining the best substance for the web-like substance he shoots out from a device he made. “He figured out something that would carry his weight and be elastic so he could swing from rooftop to rooftop.”
In the lab, scientists use natural materials such as silk – found in spiderwebs – as scaffolds for organs and tissues that they are engineering. Like Spider-Man, they must select materials that match their use – looking for materials that are compatible with the body, promote cell growth and degrade into the body once the engineered tissue has integrated with existing tissue.
Also similar to Spider-Man, Wake Forest Baptist scientists developed a device that shoots out a spider-web-looking material. In this case, the material is caught on a spinning rod to create a tubular structure that can be used to engineer blood vessels.
Williams, who owned the first Spider-Man comic book – and wishes he still had it – said he got interested in science through Spider-Man, a super-hero who wins awards for his research. When Williams had difficulties with reading in grade school, his teacher encouraged his parents to let him read anything he wanted. He chose comic books and Spider-Man was the first one he bought.
“As a child, I always wanted to be Spider-Man. But now I have the next-best thing. I’m a researcher who uses some of the same technology as Spider-Man.”
Contacts and sources:
Karen Richardson
Wake Forest Baptist Medical Center
Freely Swimming Artifical “Jellyfish” Made from Inanimate Silicone and Living Cardiac Muscle Cells
July 29th, 2012By Alton Parrish.
When one observes a colorful jellyfish pulsating through the ocean, Greek mythology probably doesn’t immediately come to mind. But the animal once was known as the medusa, after the snake-haired mythological creature its tentacles resemble. The mythological Medusa’s gaze turned people into stone, and now, thanks to recent advances in bio-inspired engineering, a team led by researchers at the California Institute of Technology (Caltech) and Harvard University have flipped that fable on its head: turning a solid element—silicon—and muscle cells into a freely swimming “jellyfish,” according to Katie Neith of Caltech.

Credit: Caltech / Janna Nawroth

This advance in bio-inspired engineering, the team says, demonstrates that it is inadequate to simply mimic nature: the focus must be on function. Their design strategy, they say, will be broadly applicable to the reverse engineering of muscular organs in humans. In addition, Dabiri and colleagues say, their new process of harvesting heart-muscle cells from one organism and reorganizing them in an artificial system will be useful in building an engineered system using biological materials.
“As engineers, we are very comfortable with building things out of steel, copper, concrete,” says Parker. “I think of cells as another kind of building substrate, but we need rigorous quantitative design specs to move tissue engineering from arts and crafts to a reproducible type of engineering. The jellyfish provides a design algorithm for reverse engineering an organ’s function and developing quantitative design and performance specifications. We can complete the full exercise of the engineer’s design process: design, build, and test.”
The team’s next goal is to design a completely self-contained system that is able to sense and actuate on its own using internal signals, as human hearts do. Nawroth and Dabiri would also like for the Medusoid to be able to go out and gather food on its own. Then, researchers could think about systems that could live in the human body for years at a time without having to worry about batteries because the system would be able to fend for itself. For example, these systems could be the basis for a pacemaker made with biological elements.
“We’re reimagining how much we can do in terms of synthetic biology,” says Dabiri. “A lot of work these days is done to engineer molecules, but there is much less effort to engineer organisms. I think this is a good glimpse into the future of re-engineering entire organisms for the purposes of advancing biomedical technology. We may also be able to engineer applications where these biological systems give us the opportunity to do things more efficiently, with less energy usage.”
Other Harvard collaborators who contributed to the Nature Biotechnology paper, “A Tissue-Engineered Jellyfish with Biomimetic Propulsion,” are Hyungsuk Lee, Adam W. Feinberg, Crystal M. Ripplinger, Megan L. McCain, and Anna Grosberg, who earned her PhD in bioengineering at Caltech. Funding for the study included grants from the Wyss Institute for Biologically Inspired Engineering at Harvard, the National Science Foundation (NSF), the National Institutes of Health, the Office of Naval Research, and NSF Program in Fluid Dynamics.
Unprecedented Greenland Ice Sheet Surface Melt Seen By Satellites
July 25th, 2012By Alton Parrish.
Extent of surface melt over Greenland’s ice sheet on July 8 (left) and July 12 (right). Measurements from three satellites showed that on July 8, about 40 percent of the ice sheet had undergone thawing at or near the surface. In just a few days, the melting had dramatically accelerated and an estimated 97 percent of the ice sheet surface had thawed by July 12. In the image, the areas classified as “probable melt” (light pink) correspond to those sites where at least one satellite detected surface melting. The areas classified as “melt” (dark pink) correspond to sites where two or three satellites detected surface melting. The satellites are measuring different physical properties at different scales and are passing over Greenland at different times. As a whole, they provide a picture of an extreme melt event about which scientists are very confident.

Son Nghiem of NASA’s Jet Propulsion Laboratory in Pasadena, Calif., was analyzing radar data from the Indian Space Research Organisation’s (ISRO) Oceansat-2 satellite last week when he noticed that most of Greenland appeared to have undergone surface melting on July 12. Nghiem said, “This was so extraordinary that at first I questioned the result: was this real or was it due to a data error?”
Nghiem consulted with Dorothy Hall at NASA’s Goddard Space Flight Center in Greenbelt, Md. Hall studies the surface temperature of Greenland using the Moderate-resolution Imaging Spectroradiometer (MODIS) on NASA’s Terra and Aqua satellites. She confirmed that MODIS showed unusually high temperatures and that melt was extensive over the ice sheet surface.
Thomas Mote, a climatologist at the University of Georgia, Athens, Ga; and Marco Tedesco of City University of New York also confirmed the melt seen by Oceansat-2 and MODIS with passive-microwave satellite data from the Special Sensor Microwave Imager/Sounder on a U.S. Air Force meteorological satellite.
The melting spread quickly. Melt maps derived from the three satellites showed that on July 8, about 40 percent of the ice sheet’s surface had melted. By July 12, 97 percent had melted.
This extreme melt event coincided with an unusually strong ridge of warm air, or a heat dome, over Greenland. The ridge was one of a series that has dominated Greenland’s weather since the end of May. “Each successive ridge has been stronger than the previous one,” said Mote. This latest heat dome started to move over Greenland on July 8, and then parked itself over the ice sheet about three days later. By July 16, it had begun to dissipate.
Even the area around Summit Station in central Greenland, which at 2 miles above sea level is near the highest point of the ice sheet, showed signs of melting. Such pronounced melting at Summit and across the ice sheet has not occurred since 1889, according to ice cores analyzed by Kaitlin Keegan at Dartmouth College in Hanover, N.H. A National Oceanic and Atmospheric Administration weather station at Summit confirmed air temperatures hovered above or within a degree of freezing for several hours July 11-12.
“Ice cores from Summit show that melting events of this type occur about once every 150 years on average. With the last one happening in 1889, this event is right on time,” says Lora Koenig, a Goddard glaciologist and a member of the research team analyzing the satellite data. “But if we continue to observe melting events like this in upcoming years, it will be worrisome.”
Nghiem’s finding while analyzing Oceansat-2 data was the kind of benefit that NASA and ISRO had hoped to stimulate when they signed an agreement in March 2012 to cooperate on Oceansat-2 by sharing data.