April 25th, 2016
By Alton Parrish.

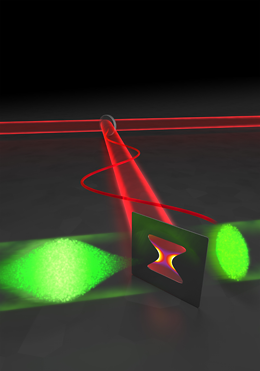
With the aid of terahertz radiation, Munich physicists have developed a method for generating and controlling ultrashort electron pulses. With further improvements, this technique should be capable of capturing even electrons in motion.
Seeing how atoms and electrons in a material respond to external stimuli can give scientists insight into unsolved problems in solid-state physics, such as the basis for high-temperature superconductivity and the many intriguing properties of other exotic materials. Short pulses of electrons can be used to image such responses. Due to their quantum mechanical wave-like properties, when electrons are scattered off a crystal, they interfere with each other to create a diffraction pattern. By recording these patterns, researchers can work out the atomic and electronic structure of the material, resolving details smaller than the size of an atom.
A pulse of electrons (green, coming from the left) encounters a microstructured antenna, which is operated with laser-generated terahertz radiation (red). Thus, the duration of the electron pulse is shortened to a few femtoseconds.

Short electron pulses are, however, difficult to generate, because electrons carry a charge and move more slowly than the speed of light. In particular, electron pulse technology still has a long way to go to achieve the temporal resolution required to capture the motions of electrons inside a material. Now, a team headed by Dr. Peter Baum and Prof. Ferenc Krausz from the Laboratory for Attosecond Physics (LAP), LMU and the Max-Planck Institute of Quantum Optics (MPQ) has succeeded in developing a new technique for controlling ultrafast electron pulses. To date, microwave technology has been used to control electron pulses.
Now, the LMU and MPQ researchers have – for the first time – used optically generated terahertz radiation. Using this technique, the team was able to reduce the length of the electron pulses significantly. Moreover, the method has the potential to visualize not only atoms, but also electrons in motion.
Observing atoms and their motions requires highly specialized techniques. Electron microscopy and electron diffraction can provide the spatial resolution to image atoms, but filming atomic motions requires ultrashort shutter speeds – the shorter the electron pulses, the sharper the images from the microcosmos. Electron pulses with durations in the femtosecond to attosecond range (10-15-10-18 s) would be ideal for monitoring processes inside matter with the required resolution in both space and time, i.e. in four dimensions.
While it is already possible to generate extremely short light pulses with lasers, optical pulses do not have the short wavelengths required to make atoms or charges in molecules and solids directly visible. Electrons are superior to light in this context, because their wavelengths are 100,000 times shorter. However, generating short pulses is much more difficult to do with electrons than with light. This is because electrons, unlike photons, have both rest mass and charge.
Exploiting the properties of THz radiation
Like visible light, terahertz radiation is a form of electromagnetic radiation. The wavelength of terahertz radiation is much longer, however, falling in the range between microwaves and infrared light. The researchers directed the pulsed terahertz radiation and the electron beam onto a special antenna, where the electrons and the terahertz photons can interact. They oriented the electric field of the terahertz radiation so that electrons arriving earlier were slowed down, and electrons arriving later were accelerated. Under these conditions, as the electron pulse continues to propagate, it is compressed, reaching a minimum duration at the location where it scatters from the material sample under study.
Furthermore, the researchers can actually determine how long the electron pulses are when they arrive at the sample position. This involves forcing the electron pulses to interact a second time with terahertz radiation, but this time the terahertz electromagnetic fields are oriented such that they impart a sideways deflection to the electrons. Crucially, the extent of the deflection depends on the timing of the electrons’ interaction with the terahertz pulse. Hence, the physicists have created a virtual terahertz-stopwatch for the electron pulses.
The new technology puts Baum and colleagues in a position to shorten the electron pulses even more. That will enable them to record ever faster atomic and eventually electronic motions. The aim is to track the attosecond motions of charged clouds in and around atoms in order to better understand the fundamentals of the interaction between light and matter. Such insights may eventually lead to new kinds of photonic and electronic materials and devices, driving the technologies of tomorrow.

Comments Off on Making Movies of Electrons in Motion Soon Possible
April 25th, 2016
By Alton Parrish.

For the 26th birthday of NASA’s Hubble Space Telescope, astronomers are highlighting a Hubble image of an enormous bubble being blown into space by a super-hot, massive star. The Hubble image of the Bubble Nebula, or NGC 7635, was chosen to mark the 26th anniversary of the launch of Hubble into Earth orbit by the STS-31 space shuttle crew on April 24, 1990
This graphic shows the wider context of the Bubble Nebula. The National Optical Astronomy Observatory (NOAO) image (left) by Travis Rector has been rotated and cropped to be north-up and closer to the orientation of the Hubble Space Telescope image (right). In addition to the inner bubble seen in the Hubble image, the wider view shows a large cloud complex, including two larger shells surrounding the massive star near the center.
“As Hubble makes its 26th revolution around our home star, the sun, we celebrate the event with a spectacular image of a dynamic and exciting interaction of a young star with its environment. The view of the Bubble Nebula, crafted from WFC-3 images, reminds us that Hubble gives us a front row seat to the awe inspiring Universe we live in,” said John Grunsfeld, Hubble astronaut and associate administrator of NASA’s Science Mission Directorate at NASA Headquarters, in Washington, D.C.
The Bubble Nebula is 7 light-years across–about one-and-a-half times the distance from our sun to its nearest stellar neighbor, Alpha Centauri, and resides 7,100 light-years from Earth in the constellation Cassiopeia.This visualization of the Bubble Nebula begins with a ground-based view that encompasses the glowing cloud. The high-energy light from the massive Wolf-Rayet star, BD +60°2522, is responsible for ionizing the entire region. The virtual camera flies through the foreground stars and approaches the central bubble imaged by Hubble. The massive star continuously sheds some of its outer layers in a mass-loss wind, which has blown a bubble of gas seven light-years across. The video’s three-dimensional perspective emphasizes the extended nature of the structure and the fact that BD +60°2522 is not located at the center. The pressure inside the bubble is able to expand more rapidly in the directions away from the surrounding nebula. The computer model incorporates both scientific and artistic interpretation of the data. In particular, distances are significantly compressed.
Acknowledgment: T. Rector/University of Alaska Anchorage, H. Schweiker/WIYN and NOAO/AURA/NSF, NASA, ESA, and the Hubble Heritage Team (STScI/AURA)
The seething star forming this nebula is 45 times more massive than our sun. Gas on the star gets so hot that it escapes away into space as a “stellar wind” moving at over 4 million miles per hour. This outflow sweeps up the cold, interstellar gas in front of it, forming the outer edge of the bubble much like a snowplow piles up snow in front of it as it moves forward.
As the surface of the bubble’s shell expands outward, it slams into dense regions of cold gas on one side of the bubble. This asymmetry makes the star appear dramatically off-center from the bubble, with its location in the 10 o’clock position in the Hubble view.
Dense pillars of cool hydrogen gas laced with dust appear at the upper left of the picture, and more “fingers” can be seen nearly face-on, behind the translucent bubble.
The gases heated to varying temperatures emit different colors: oxygen is hot enough to emit blue light in the bubble near the star, while the cooler pillars are yellow from the combined light of hydrogen and nitrogen. The pillars are similar to the iconic columns in the “Pillars of Creation” Eagle Nebula. As seen with the structures in the Eagle Nebula, the Bubble Nebula pillars are being illuminated by the strong ultraviolet radiation from the brilliant star inside the bubble.

The Bubble Nebula was discovered in 1787 by William Herschel, a prominent British astronomer. It is being formed by a proto-typical Wolf-Rayet star, BD +60º2522, an extremely bright, massive, and short-lived star that has lost most of its outer hydrogen and is now fusing helium into heavier elements. The star is about 4 million years old, and in 10 million to 20 million years, it will likely detonate as a supernova.
Hubble’s Wide Field Camera 3 imaged the nebula in visible light with unprecedented clarity in February 2016. The colors correspond to blue for oxygen, green for hydrogen, and red for nitrogen. This information will help astronomers understand the geometry and dynamics of this complex system.
The Bubble Nebula is one of only a handful of astronomical objects that have been observed with several different instruments onboard Hubble. Hubble also imaged it with the Wide Field Planetary Camera (WFPC) in September of 1992, and with Wide Field Planetary Camera 2 (WFPC2) in April of 1999.
The Hubble Space Telescope is a project of international cooperation between NASA and the European Space Agency. NASA’s Goddard Space Flight Center in Greenbelt, Maryland, manages the telescope. The Space Telescope Science Institute (STScI) in Baltimore, Maryland, conducts Hubble science operations. STScI is operated for NASA by the Association of Universities for Research in Astronomy in Washington, D.C.

Comments Off on Hubble Sees a Massive Super Hot Star ‘Inflating’ a Giant Bubble 7 Light Years Across
April 23rd, 2016
By alton Parrish.

In 1816, summer failed to make an appearance in central Europe and people were starving. Just a year earlier, the Tambora volcano had erupted in Indonesia, spewing huge amounts of ash and sulfur into the atmosphere. As these particles partly blocked sunlight, cooling the climate, it had a serious impact on the land and the people, even in Switzerland.
Since then, volcanologists have developed more precise ideas of why super-volcanoes such as Tambora are not only highly explosive but also why they release so much sulfur into the atmosphere.
Tambora on the Indonesian island of Sumbawa: the explosive eruption of this volcano 200 years ago cooled the climate and lead to a year without a summer

Gas bubbles tend to accumulate in the upper layers of magma reservoirs, which are only a few kilometers beneath the earth’s surface, building up pressure that can then be abruptly liberated by eruption. These bubbles mainly contain water vapor but also sulfur.
Sulfur-rich eruptions
“Such volcanic eruptions can be extremely powerful and spew an enormous amount of ash and sulfur to the surface,” says Andrea Parmigiani, a post-doc in the Institute of Geochemistry and Petrology at ETH Zurich. “We’ve known for some time that gas bubbles play a major role in such events, but we had only been able to speculate on how they accumulate in magma reservoirs.”
The 1815 Mount Tambora eruption. The red areas are maps of the thickness of volcanic ashfall.
Together with other scientists from ETH Zurich and Georgia Institute of Technology (Georgia Tech), the researchers studied the behavior of bubbles with a computer model.
The scientists used theoretical calculations and laboratory experiments to examine in particular how bubbles in crystal-rich and crystal-poor layers of magma reservoirs move buoyantly upward. In many volcanic systems, the magma reservoir consists mainly of two zones: an upper layer consisting of viscous melt with almost no crystals, and a lower layer rich in crystals, but still containing pore space.
Super bubbles meander through a maze
When Andrea Parmigiani, Christian Huber and Olivier Bachmann started this project, they thought that the bubbles, as they moved upwards through crystal-rich areas of the magma reservoirs, would dramatically slow down, while they would go faster in the crystal-poor zones.
“Instead, we found that, under volatile-rich conditions, they would ascend much faster in the crystal-rich zones, and accumulate in the melt-rich portions above” says Parmigiani.
Parmigiani explains this as follows: when the proportion of bubbles in the pore space of the crystal-rich layers increases, small individual bubbles coalesce into finger-like channels, displacing the existing highly viscous melt. These finger-like channels allow for a higher vertical gas velocity. The bubbles, however, have to fill at least 10 to 15 % of the pore space.
“If the vapor phase cannot form these channels, individual bubbles are mechanically trapped,” says the earth scientist. As these finger-like channels reach the boundary of the crystal-poor melt, individual, more spherical bubbles detach, and continue their ascent towards the surface. However, the more bubble, the more reduce their migration velocity is.
Tambora volcano on Indonesia’s Sumbawa Island was the site of the world’s largest historical eruption in April 1815. This NASA Landsat mosaic shows the 6-km-wide caldera truncating the 2850-m-high summit of the massive volcano. Pyroclastic flows during the 1815 eruption reached the sea on all sides of the 60-km-wide volcanic peninsula, and the ejection of large amounts of tephra caused world-wide temperature declines in 1815 and 1816.
This is because each bubble creates a return flow of viscous melt around it. When an adjacent bubble feels this return flow, it is slowed down. This process was demonstrated in a laboratory experiment conducted by Parmigiani’s colleagues Salah Faroughi and Christian Huber at Georgia Tech, using water bubbles in a viscous silicone solution.
“Through this mechanism, a large number of gas bubbles can accumulate in the crystal-poor melt under the roof of the magma reservoir. This eventually leads to over-pressurization of the reservoir,” says lead author Parmigiani. And because the bubbles also contain sulfur, this also accumulates, explaining why such a volcano might emit more sulfur than expected based on its composition.
What this means for the explosivity of a given volcano is still unclear. “This study focuses primarily on understanding the basic principles of gas flow in magma reservoirs; a direct application to prediction of volcanic behavior remains a question for the future,” says the researcher, adding that existing computer models do not depict the entire magma reservoir, but only a tiny part of it: roughly a square of a few cubic centimeter with a clear boundary between the crystal-poor and crystal-rich layers.
To calculate this small volume, Parmigiani used high-performance computers such as the Euler Cluster at ETH Zurich and a supercomputer at the Swiss National Supercomputing Centre in Lugano.
For the software, the researcher had access to the open-source library Palabos, which he continues to develop in collaboration with researchers from University of Geneva. “This software is particularly suitable for this type of simulation,” says the physicist.

Comments Off on Super-Volcanoes and Dangerous Bubbles
April 21st, 2016
By Alton Parrish.

In 2011, astronomers announced that our galaxy is likely teeming with free-floating planets. In fact, these lonely worlds, which sit quietly in the darkness of space without any companion planets or even a host sun, might outnumber stars in our Milky Way galaxy. The surprising discovery begged the question: Where did these objects come from? Are they planets that were ejected from solar systems, or are they actually light-weight stars called brown dwarfs that formed alone in space like stars?
A new study using data from NASA’s Wide-field Infrared Survey Explorer, WISE, and the Two Micron All Sky Survey, or 2MASS, provides new clues in this mystery of galactic proportions. Scientists have identified a free-floating, planetary-mass object within a young star family, called the TW Hydrae association. The newfound object, termed WISEA J114724.10−204021.3, or just WISEA 1147 for short, is estimated to be between roughly five to 10 times the mass of Jupiter.
A young, free-floating world sits alone in space in this illustration. The object, called WISEA J114724.10−204021.3, is thought to be an exceptionally low-mass “brown dwarf,” which is a star that lacked enough mass to burn nuclear fuel and glow like a star. Astronomers using data from NASA’s WISE and 2MASS sky surveys found the object in TW Hydrae – a young, 10-million-year-old association of stars.

WISEA 1147 is one of the few free-floating worlds where astronomers can begin to point to its likely origins as a brown dwarf and not a planet. Because the object was found to be a member of the TW Hydrae family of very young stars, astronomers know that it is also very young — only 10 million years old. And because planets require at least 10 million years to form, and probably longer to get themselves kicked out of a star system, WISEA 1147 is likely a brown dwarf. Brown dwarfs form like stars but lack the mass to fuse atoms at their cores and shine with starlight.
“With continued monitoring, it may be possible to trace the history of WISEA 1147 to confirm whether or not it formed in isolation,” said Adam Schneider of the University of Toledo in Ohio, lead author of a new study accepted for publication in The Astrophysical Journal.
Of the billions of possible free-floating worlds thought to populate our galaxy, some may be very low-mass brown dwarfs, while others may in fact be bona fide planets, kicked out of nascent solar systems. At this point, the fraction of each population remains unknown. Tracing the origins of free-floating worlds, and determining whether they are planets or brown dwarfs, is a difficult task, precisely because they are so isolated.
“We are at the beginning of what will become a hot field – trying to determine the nature of the free-floating population and how many are planets versus brown dwarfs,” said co-author Davy Kirkpatrick of NASA’s Infrared Processing and Analysis Center, or IPAC, at the California Institute of Technology in Pasadena.
Astronomers found WISEA 1147 by sifting through images taken of the entire sky by WISE, in 2010, and 2MASS, about a decade earlier. They were looking for nearby, young brown dwarfs. One way to tell if something lies nearby is to check to see if it’s moved significantly relative to other stars over time. The closer an object, the more it will appear to move against a backdrop of more distant stars. By analyzing data from both sky surveys taken about 10 years apart, the close objects jump out.
Finding low-mass objects and brown dwarfs is also well suited to WISE and 2MASS, both of which detect infrared light. Brown dwarfs aren’t bright enough to be seen with visible-light telescopes, but their heat signatures light up when viewed in infrared images.
A sky map taken by NASA’s Wide-field Infrared Survey Explorer, or WISE, shows the location of the TW Hydrae family, or association, of stars, which lies about 175 light-years from Earth and is centered in the Hydra constellation. The stars are thought to have formed together around 10 million years ago. Recently, data from WISE and its predecessor, the Two Micron All Sky Survey, or 2MASS, found the lowest-mass free-floating object in this family — a likely brown dwarf called WISEA J114724.10−204021.3.
The brown dwarf WISEA 1147 was brilliantly “red” in the 2MASS images (where the color red had been assigned to longer infrared wavelengths), which means that it’s dusty and young.
“The features on this one screamed out, ‘I’m a young brown dwarf,'” said Schneider.
After more analysis, the astronomers realized that this object belongs to the TW Hydrae association, which is about 150 light-years from Earth and only about 10 million years old. That makes WISEA 1147, with a mass between about five and 10 times that of Jupiter, one of the youngest and lowest-mass brown dwarfs ever found.
Interestingly, a second, very similar low-mass member of the TW Hydrae association was announced just days later (2MASS 1119-11) by a separate group led by Kendra Kellogg of Western University in Ontario, Canada.
Another reason that astronomers want to study these isolated worlds is that they resemble planets but are easier to study. Planets around other stars, called exoplanets, are barely perceptible next to their brilliant stars. By studying objects like WISEA 1147, which has no host star, astronomers can learn more about their compositions and weather patterns.
“We can understand exoplanets better by studying young and glowing low-mass brown dwarfs,” said Schneider. “Right now, we are in the exoplanet regime.”
Other authors of the study include: James Windsor and Michael Cushing of the University of Toledo; and Ned Wright of UCLA, who was also the principal investigator of the WISE mission.
NASA’s Jet Propulsion Laboratory in Pasadena, California, managed and operated WISE for NASA’s Science Mission Directorate in Washington. The spacecraft was put into hibernation mode in 2011, after it scanned the entire sky twice, completing its main objectives. In September 2013, WISE was reactivated, renamed NEOWISE and assigned a new mission to assist NASA’s efforts to identify potentially hazardous near-Earth objects.
The 2MASS mission was a joint effort between the California Institute of Technology, Pasadena; the University of Massachusetts, Amherst; and JPL. Caltech manages JPL for NASA.
WISE, NEOWISE and 2MASS data are archived at IPAC.
Comments Off on Billions of Free Floating Sunless Worlds Might Outnumber Stars
April 21st, 2016
By Alton Parrish.

Electric vehicles are a reality, and scientists are now looking ahead. They are exploring new frontiers to make them safer, more reliable, more autonomous and more affordable. European researchers are not short of ideas to address all those issues.
Electric vehicles are a reality, and scientists are now looking ahead. They are exploring new frontiers to make them safer, more reliable, more autonomous and more affordable.
European researchers are not short of ideas to address all those issues.
An electric vehicle has, say its developers, been designed to suit all tastes. Not only because its solar cells feed its electric batteries. But also because the vehicle itself is able to provide some food.
Most cars, electric or otherwise, have boots designed to carry luggage. But one new vehicle has
microwaves and frying pans instead.
This is hardly run-of-the-mill research equipment, but it is integral to a prototype just developed at one Italian lab.
“This is an electric restaurant car. We wanted to show that by just using photovoltaic energy you can not only drive the vehicle, but also power a kitchen and be able to cook in an ecological way,” says IFEVS’s CEO, Pietro Perlo.
The prototype has been designed by scientists at a European research project aimed at exploring new innovative ways to design and produce modular urban light electric vehicles.
The tiny food van is the latest newcomer in a game that also includes small pick-ups, vans or even taxis.
They all share the same concepts for the chassis, the powertrain and energy-driven technologies.
“Our car is modular. We always have the same chassis based on a mix of very high resilient steel. The car has 4 powered wheels. It has two motors, one in the front, another in the back. Each motor feeds two of the wheels,” says Perlo.
These modular cars have been designed with simple elements to simplify assembly and reduce costs.
But they will have to be as safe as any other vehicle in the market. So researchers had to turn to new
solutions for its conception.
“We are talking about very small cars. So we have much less space to absorb energy. So we decided to use a special steel. It is a very elastic steel, really innovative. Its biggest advantage is that this steel absorbs big quantities of energy,” says Mechanical Engineer at CIDAUT, Javier Romo García.
The car´s two motors were made with magnets instead of rare earth materials to reduce costs. Each
motor delivers 9000 rpm to the wheels, according to its developers.
“Requirements for this kind of electrical traction are basically high efficiency, high power density and constant speed. This is what we tried to develop. The fact that the car has two motors offers some advantages. Two motors gives more flexibility to the vehicle, and it improves its acceleration performance.
These are the main advantages,” says Regulated Environment Protection Installation Electrical Engineer, Paul Minciunescu.
Researchers are now testing the model’s reliability and ergonomics.
Details like visibility, handling, on-board sensing or computational power are closely studied at these European labs.
“Our aim was to develop a really hi-tech vehicle, with state of the art technology, that has the safety of a plane for the cost of a washing machine. In the 90s the big challenge for technology developers was bringing a cell phone into every home. Our challenge now is to bring one of these cars to the garage of every European,” says Bitron/Plus-Moby project coordinator Marco Ottella.
While continuing to work on sometimes tasty validation tests, researchers say they are now getting ready for the next big step, full-scale manufacturing.
“Our idea is that manufacturing should be tailor-made. Tell us where you want to produce the cars. We come with our trucks with containers. Inside the containers you have robots ready to assemble the car. So in just a few days you are able to produce electrical cars that we consider safe, reliable and efficient, vehicles that are only powered with renewable energies,” says Pietro Perlo.
Researchers hope their modular vehicles could be ready for industrial manufacturing in less than 2 years.
Guaranteeing the safety and technical reliability of these existing and future electric cars, and also their charging points are the questions that European scientists are addressing from one sophisticated lab in Northern Italy.
The lab includes a novel electric and hybrid vehicle testing facility; a climatic chamber with temperatures ranging from -30ºC to +50ºC under controlled humidity.
Researchers are able to get information about the car’s performance and efficiencies under different drive-cycles and climatic conditions, including the impact of heating, ventilation or air-conditioning.
And there is more…
“We measure information on electrical data, information on the ratio between the car’s emissions and its consumption. We also obtain information about the car’s own consumption of electricity, and how its battery behaves,” says Telecommunications Engineer at the EU’s Joint Research Centre Germana Trentadue.
The lab also includes a new chamber designed to analyse electromagnetic emissions generated by electric cars during acceleration, driving and braking.
Researchers use reception antennas and receivers to measure e-mobility’s potential interference with communications frequencies.
They can also test the immunity of electric vehicles against external electric and magnetic fields.
But why is it important to measure the electromagnetic fields around the vehicle?
“Electro-mobility is a very young field of research. And it involves technical equipment where certain fears need to be addressed, and methods need to be developed to rule out problems in the future with certainty. These include for instance very low-frequency magnetic fields in the fast charging area, which could, under certain circumstances, pose a risk for pacemaker patients, and of course we want to exclude such issues from the very beginning,” says the JRC’s Coordinating Research Engineer for Electro-mobility, Harald Scholz.
Research is complemented by testing the interoperability all supply devices and communications systems involved in electric car recharging.
Researchers study the behavior of evolving smart power grids integrating renewable sources of energy, electric vehicles, storage and other features.
“Take for instance a future mobile app that will allow us to book a charging point for our electrical car. So you book it, you drive there, you recharge your car and you leave with your battery totally full. This may look like a very simple process; it takes just around 30 minutes to do all that. But it needs between 10 and 15 different agents, systems and components that must all work together in real time. This is very complex, and this is what we are trying to ensure in our labs; that all these different technical components work well together,” says Telecommunications Engineer at the JRC, Miguel Olariaga Guardiola.
Information acquired at these facilities should make the establishment of standards and harmonized criteria easier, to guarantee safety and reliability in future electric vehicle and recharging markets.
Ecological and more and more sophisticated, electrical vehicles are a dream for some people, but their limited range is a huge challenge. Most existing vehicles on the market still cannot go very far on one charge. It is a challenge that some European scientists say they are addressing with the help of a trailer.
Researchers have developed a portable generator housed in a little two-wheeled trailer. It can be
programmed with a mobile app.
The generator produces energy to “bolt on” to the electric cars to increase their range. The energy is
provided by petrol.
“If you are driving at 100 kph on a highway, an average electric car offers you around 100 kilometres of autonomy. With our prototype you can drive 500 kilometres. Then you fill up with petrol and you can keep on driving,” says EP-Tender’s CEO, Jean-Baptiste Segard.
Is it not a curious paradox that at the end of the day you need gasoline to produce energy for an electric car?
“Yes it is a true paradox. But during the year, with an electric vehicle you are going to drive short distances almost all the time, so those 20 or 30 kilometre trips you drive with your batteries. But if you ever want to drive 500 kilometers, you use our product, powered with petrol. But how often do you drive 500 kilometers? 3, 5, 10 times per year?” asks Segard.
The trailer is around 1.2 meters long. It weighs some 250 kilos and provides a peak power of 20kW.
Scientists say it has some sophisticated electronics onboard.
“We had to find the right processor and the right systems. And then we had to make sure that the algorithms that we had imagined on paper worked in the real product,” says EP-Tender’s Embedded Systems Engineer, Fabrice Viot.
Production of the first units was done at this small French company.
Researchers here say the product is fully ready for industrial assembly lines, after multiple manufacturing challenges were sorted out.
“This is a complex product with a combustion engine and power electronics in a very small, closed environment. There are very different components with really complex functions. And this reality imposes important constraints for the mechanical integration of the product,” says Adaccess’s CEO, Damien Alfano.
Back on the road, the trailer’s developers are already working on a business model, based on a rental basis, they say.
“We are not planning to produce one of these trailers for every electric vehicle. We don´t want to add a motor to each electric vehicle. Maybe there will be one trailer for every 10 or 20 electric cars. And each driver will just rent it when he or she needs more range,” says Segard.
The key question is how much this will cost.
“If the driver wants to drive just for one day and the motor works for one hour, the rental price would be 17 euros,” says Segard. “Each other extra hour you pay seven euros. So if you are renting the trailer for one day and the motor works for three extra hours, you pay 17 euros plus 21 euros; that´s a total of 38 euros.”
Researchers say they expect the product to hit European roads in less than 3 years.
Comments Off on It Cooks and Drives: Electric Restaurant Car Powered by the Sun Coming
April 20th, 2016
By alton Parrish.

Massive tree die-offs due to drought have ravaged forests across the American West and left ecologists struggling to predict how and when tree deaths will happen, and how rising temperatures due to climate change might affect the health of forests.
In a new study, a team including Princeton University researchers has identified the traits that best protect trees against death from drought. Published online this week in the Proceedings of the National Academy of Sciences, the study found that the species most resistant to drought are those that are better at withstanding stress to the water transport system — composed of internal pipes known as xylem — that carries water from the roots to the crown.
A dead ponderosa pine (Pinus ponderosa) stands near the Grand Canyon in Arizona June 2014. The western United States has been a hotspot for die-offs in recent years, with forests facing danger in Colorado, Arizona, New Mexico, Utah, Texas and California. Although rising CO2 levels in the atmosphere can benefit tree growth, the rising temperatures associated with climate change can trigger droughts that kill trees, which dampens CO2 removal from the atmosphere.
Better understanding the susceptibility of trees to drought could help forestry experts create early-warning systems and take precautionary steps, such as planting more resilient species or thinning overcrowded forests to reduce a forest’s vulnerability to drought, the researchers report.
“We don’t really know the future of forests in a changing climate,” said lead author William Anderegg, an associate research scholar in the Princeton Environmental Institute and an incoming assistant professor of biology at the University of Utah. “Our results provide a foundation for improving our predictions of drought-induced tree mortality across Earth’s diverse forests.”
‘Like a heart attack for a tree’
Trees normally pull water from the soil into their roots then up through their trunks to the leaves. Water inches up the xylem to replace water evaporating from the leaf surface. This pulling of water creates tension that Anderegg compared to a spring getting tauter and tauter as drought progresses.
When water is scarce, the trees have to pull much harder on the water in the xylem, which allows air bubbles to infiltrate the pipes. The bubbles cause blockages, or embolisms, that clog the pipes the way a blood clot blocks flow through an artery. The result, Anderegg said, is “like a heart attack for a tree.”
The study found that the ability to withstand this stress was more predictive of survival than other factors such as the overall amount of water lost through leaves and the depth of roots. Tree species with a larger “hydraulic safety margin” — measured by how well the trees can tolerate the tension from pulling water through the xylem — are better able to survive drought, said Anderegg.
The team found that angiosperms (flowering trees) and gymnosperms (cone trees) were equally likely to die in drought. Among angiosperm species, wood density emerged as a useful predictive trait of drought survival, perhaps because trees with dense wood tend to have more armor around their xylem.
Data for the study was obtained from dozens of published peer-reviewed scientific studies and the Xylem Functional Traits Database, which contains measurements of the hydraulic safety margins for each species as determined through laboratory experiments.
Anderegg designed the study in collaboration with Tamir Klein of the Agricultural Research Organization, Volcani Center, in Israel. Data and analytical tools were provided by Adam Pellegrini, a Princeton graduate student of ecology and evolutionary biology; Lawren Sack and Megan Bartlett, a professor and graduate student, respectively, of ecology and evolutionary biology at the University of California-Los Angeles; Brendan Choat, a senior lecturer at the Hawkesbury Institute for the Environment at Western Sydney University in Australia and Steven Jansen, professor of botany at Ulm University in Germany.
The team collected information on drought-induced tree deaths from 33 individual studies performed around the globe, which included data on 475 species and over 760,000 individual trees. They examined various forest environments, including tropical rainforests, temperate deciduous forests, evergreen forests and savanna woodlands. In all, the team investigated 10 physiological traits they deemed important for predicting mortality.
The study may help predict how drought-induced tree mortality fits into models of future climate change, Anderegg said. Although rising CO2 levels in the atmosphere can benefit tree growth, the associated rising temperatures can trigger droughts that kill trees, which in turn dampens CO2 removal from the atmosphere.
The western United States has been a hotspot for die-offs in recent years, with forests facing danger in Colorado, Arizona, New Mexico, Utah, Texas and California. According to Anderegg, recent estimates indicate that between 20 million to 60 million trees are dying from the current drought in California.
Park Williams, an assistant research professor at Columbia University’s Lamont-Doherty Earth Observatory, said that the research reveals how it is that trees to a species succumb to drought, and how scientists can analyze that process to assess drought vulnerability.
“We all know that the chances of a plant dying goes up when water becomes limited, but we’re unsure what the exact processes are inside the plant that cause death during drought and we’re even more unsure how to model those processes,” said Williams, who was not involved in the work. “This new meta-analysis sheds important light on this issue by telling us that trees are more-or-less all sensitive to the same thing during drought — hydraulic failure.
“When a tree is forced to work too hard to pull water out of soil its ‘straws’ collapse similarly to how a straw collapses if we work too hard to drink a milkshake,” Williams continued. “This paper agrees with other recently published research that indicates that if we can accurately model how hard trees are having to work to pull water from soil, this would improve our ability to model how likely they are to die during a drought.”
Todd Dawson, professor of integrative biology at the University of California-Berkeley, said the research provides a holistic understanding of tree die-off at a time when global temperatures — and possibly drought conditions — are expected to rise.
“The paper adds a long-overdue global analysis to the ongoing discussion about the root causes leading to tree mortality across a wide range of trees,” said Dawson, who is familiar with the research but was not involved in it. “Unfortunately, as the climate warms and extreme droughts and heatwaves increase, I fear that we will be adding more examples and numbers to the database Bill Anderegg and his co-authors report in their important paper.”
One limitation of the study is that it did not compare the same species of trees in different regions, which could lead to some missed variations in drought response. The next step will be to understand how variable these drought-protective traits are within the same species in different regions.
“We’d like to have a crystal ball to see the future of forests,” Anderegg said. “Right now we’ve got a very fuzzy and cracked ball that we’re slowly trying to polish and get a better view.”

Comments Off on Hotspot for Die-Offs
April 20th, 2016
By Alton Parrish.

EU researchers have created and tested a range of new polymer composites based on graphene and speciality graphites. They are expected to find early application in the consumer electronics and automotive industries.
Graphene is a form of carbon in which the atoms are arranged in ultra-thin sheets just one atom thick. When graphene was first isolated in 2004, its unique properties seemed to herald a whole host of exotic materials.
“We’ve seen some exciting properties on a lab scale but we still don’t have a large number of applications for these sorts of materials,” says Ben Hargreaves of NetComposites Ltd, a consultancy specializing in industrial composites.
Hargreaves was coordinator of the EU-funded NanoMaster project, which brought together 13 partners in eight countries to solve some of the problems of using graphene in composite materials, and to explore how they could be used in high-volume manufacturing.
Among its many attractive properties, graphene is extremely strong and conducts both heat and electricity. Only small amounts of added graphene can create polymer composites that also possess these properties.
Improved supply
“Where graphene is exciting people is the possibility of doing several things at once,” Hargreaves says. “For example, could we enhance electrical properties, mechanical properties and thermal properties simultaneously using a single additive?”
Until recently, progress had been held back by a restricted supply of good-quality graphene and a lack of knowledge and experience in using it in new kinds of applications. Here for cheap 3D printer
When NanoMaster started in 2011 graphene was available in batches of only 50 grams but one of the partners, Avanzare, is now turning out batches of 25 kilograms in several different grades that are available commercially.
This improved supply allowed the partners to create and test many new materials by combining different grades of graphene and speciality graphites with different types of polymer. Many are supplied as ‘masterbatches’ – highly concentrated additives already mixed with a polymer that can then be blended with other materials on production lines. This allows manufacturers to use their existing processes, such as injection moulding, with little modification.
3D printing
The four-year project finished late in 2015 and discussions are continuing on how to introduce some of the new materials into existing product lines. Three of the partners – Philips (consumer electronics), Röchling (automotive components) and LEGO (toys and games) – have run trials to explore the use of graphene composites in their own products.
“The idea is that these materials can either replace metal components – thereby reducing weight and potentially costs – or can replace existing polymer components, allowing part thickness to be reduced whilst also providing improved functionality,” Hargreaves says.
Graphene composites also lend themselves to additive processes such as 3D printing. “With a 3D printed heat exchanger you can potentially design – print in – a much more efficient flow path than you could otherwise achieve with a machined metal equivalent,” he explains.
The project has also developed a body of good practice for working with these new materials, not least in health and safety. Graphene is classed as a ‘high aspect ratio nanomaterial’ (HARN) and therefore has the potential to present similar hazards to materials like asbestos, so the partners have devised safe working practices for handling and cutting graphene composites.
Comments Off on New Graphene Composites Fit for 3D Printing, Consumer Electronics and Automotive Uses
April 19th, 2016
By Alton Parrish.

Scientists from the University of Southampton, in partnership with the Japan Advanced Institute of Science and Technology (JAIST), have developed a graphene-based sensor and switch that can detect harmful air pollution in the home with very low power consumption.
The sensor detects individual CO2 molecules and volatile organic compound (VOC) gas molecules found in building and interior materials, furniture and even household goods, which adversely affect our living in modern houses with good insulation.
These harmful chemical gases have low concentrations of ppb (parts per billion) levels and are extremely difficult to detect with current environmental sensor technology, which can only detect concentrations of parts per million (ppm).
A diagram of a graphene single molecular sensor (left) and the observed signal showing successful detection of single CO2 molecule adsorption / desorption events.
In recent years, there has been an increase in health problems due to air pollution in personal living spaces, known as sick building syndrome (SBS), along with other conditions such as sick car and sick school syndromes.
The research group, led by Professor Hiroshi Mizuta, who holds a joint appointment at the University of Southampton and JAIST, and Dr Jian Sun and Assistant Professor Manoharan Muruganathan of JAIST, developed the sensor to detect individual CO2 molecules adsorbed (the bond of molecules from a gas to a surface) onto the suspended graphene (single atomic sheet of carbon atoms arranged in a honeycomb-like hexagonal crystal lattice structure) one by one by applying an electric field across the structure.
By monitoring the electrical resistance of the graphene beam, the adsorption and desorption (whereby a substance is released from or through a surface) processes of individual CO2 molecules onto the graphene were detected as ‘quantised’ changes in resistance (step-wise increase or decrease in resistance). In the study, published today in Science Advances, the journal of the American Association for the Advancement of Science (AAAS), a small volume of CO2 gas (equivalent to a concentration of approximately 30 ppb) was released and the detection time was only a few minutes.
Professor Mizuta said: “In contrast to the commercially available environmental monitoring tools, this extreme sensing technology enables us to realize significant miniaturization, resulting in weight and cost reduction in addition to the remarkable improvement in the detection limit from the ppm levels to the ppb levels.”
Research group members, Dr Harold Chong from Southampton and Dr Marek Schmidt and Dr Jian Sun of JAIST, have also recently developed graphene-based switches (published in the March issue of Nanoscale, the journal of the Royal Society of Chemistry) using a uniquely thin film developed at the University of Southampton.
The switches, which require remarkably low voltages (below three volts), can be used to power electronic components on demand, greatly improving the battery lifetime of personal electronic devices.
Professor Mizuta and the research group are now aiming to bring the two technologies together to create ultra-low-power environmental sensor systems that can detect single molecules.
Comments Off on Atomically Thin Sensor Detects Harmful Air Pollution in the Home
April 19th, 2016
By Alton Parrish.

For millennia, people on Earth have watched comets in the sky. Many ancient cultures saw comets as the harbingers of doom, but today scientists know that comets are really frozen balls of dust, gas, and rock and may have been responsible for delivering water to planets like Earth billions of years ago.
While comets are inherently interesting, they can also provide information about other aspects of our Solar System. More specifically, comets can be used as laboratories to study the behavior of the stream of particles flowing away from the Sun, known as the solar wind.
Recently, astronomers announced the results of a study using data collected with NASA’s Chandra X-ray Observatory of two comets — C/2012 S1 (also known as “Comet ISON”) and C/2011 S4 (“Comet PanSTARRS”).
Chandra observed these two comets in 2013 when both were relatively close to Earth, about 90 million and 130 million miles for Comets ISON and PanSTARRS respectively. These comets arrived in the inner Solar System after a long journey from the Oort cloud, an enormous cloud of icy bodies that extends far beyond Pluto’s orbit.
The graphics show the two comets in optical images taken by an astrophotographer, Damian Peach, from the ground during the comets’ close approach to the sun that have been combined with data from the Digitized Sky Survey to give a larger field of view. (The greenish hue of Comet ISON is attributed to particular gases such as cyanogen, a gas containing carbon and nitrogen, escaping from the comet’s nucleus.)
The insets show the X-rays detected by Chandra from each comet. The different shapes of the X-ray emission (purple) from the two comets indicate differences in the solar wind at the times of observation and the atmospheres of each comet. Comet ISON, on one hand, shows a well-developed, parabolic shape, which indicates that the comet had a dense gaseous atmosphere. On the other hand, Comet PanSTARRS has a more diffuse X-ray haze, revealing an atmosphere with less gas and more dust.
Scientists have determined that comets produce X-ray emission when particles in the solar wind strike the atmosphere of the comet. Although most of the particles in the solar wind are hydrogen and helium atoms, the observed X-ray emission is from “heavy” atoms (that is, elements heavier than hydrogen and helium, such as carbon and oxygen). These atoms, which have had most of their electrons stripped away, collide with neutral atoms in the comet’s atmosphere. In a process called “charge exchange,” an electron is exchanged between one of these neutral atoms, usually hydrogen, and a heavy atom in the solar wind. After such a collision, an X-ray is emitted as the captured electron moves into a tighter orbit.
The Chandra data allowed scientists to estimate the amount of carbon and nitrogen in the solar wind, finding values that agree with those derived independently using other instruments such as NASA’s Advanced Composition Explorer (ACE). New measurements of the amount of neon in the solar wind were also obtained.
The detailed model developed to analyze the Chandra data on comets ISON and PanSTARRS demonstrates the value of X-ray observations for deriving the composition of the solar wind. The same techniques can be used, together with Chandra data, to investigate interactions of the solar wind with other comets, planets, and the interstellar gas.
A paper describing these results appeared in February 20th, 2016 issue of The Astrophysical Journal and is available online. The authors are Bradford Snios and Vasili Kharchenko (University of Connecticut), Carey Lisse (Johns Hopkins University), Scott Wolk (Harvard-Smithsonian Center for Astrophysics), Konrad Dennerl (Max Planck Institute for Extraterrestrial Physics) and Michael Combi (University of Michigan).
NASA’s Marshall Space Flight Center in Huntsville, Alabama, manages the Chandra program for NASA’s Science Mission Directorate in Washington. The Smithsonian Astrophysical Observatory in Cambridge, Massachusetts, controls Chandra’s science and flight operations.
Comments Off on Comets ISON & PanSTARRS in the “X”-Treme
April 14th, 2016
By Alton Parrish.

Two new papers appearing in the journal Nature this week are “slam-dunk” evidence that energies from supernovae have buffeted our planet, according to astrophysicist Adrian Melott of the University of Kansas.
Melott offers his judgment of these studies in an associated letter, entitled “Supernovae in the neighborhood,” also appearing this week in Nature.
One paper, authored by Anton Wallner and colleagues, proves the existence of ancient seabed deposits of iron-60 isotopes, tracing their source to supernovae occurring about 325 light years from Earth. The second paper, by a team headed by Deiter Breitschwerdt, estimates explosion times of these supernovae, isolating two events: one 1.7 to 3.2 million years ago, and the other 6.5 to 8.7 million years ago.
Supernova remnant – known as G352.7-0.1 (or, G352 for short) – that swept up a remarkable amount of material, equivalent to about 45 times the mass of the Sun.

“This research essentially proves that certain events happened in the not-too-distant past,” said Melott, a KU professor of physics and astronomy. “They make it clear approximately when they happened and how far away they were. Knowing that, we can consider what the effect may have been with definite numbers. Then we can look for events in the history of the Earth that might be connected to them.”Melott said both supernovae events were beyond the “kill zone” of roughly 30 light years, but they might have had other impacts — including influence on human evolution.
“Our local research group is working on figuring out what the effects were likely to have been,” he said. “We really don’t know. The events weren’t close enough to cause a big mass extinction or severe effects, but not so far away that we can ignore them either. We’re trying to decide if we should expect to have seen any effects on the ground on the Earth.”
More than four centuries after Danish astronomer Tycho Brahe first observed the supernova that bears his name, the supernova remnant it created is now a bright source of X-rays.

A major colloquium, entitled “When Stars Attack! Near-Earth Supernovae Explosions Threat and Evidence,” is intended to further discussion of the new evidence. A free public lecture by astrophysicist Brian Fields of the University of Illinois will take place at 7:30 p.m. April 18 at Woodruff Auditorium in the Kansas Union.
Melott said Fields originally conceived of using iron-60 as a telltale isotope to expose historical episodes of neighborhood supernovae.
“In the 1990s he did the calculations and carried it forward,” stated Melott. “He said, ‘Hey, look for iron-60. This is a way to find out if there have been supernova near the Earth.’ Five years later came the first indications of supernovae using iron-60. Now, 20 years later, we’ve got a slam-dunk. So Fields is the one that really got all this going, and it’s just a really nice coincidence that’s he’s coming to KU just as these papers are coming out.”
Eta Carinae is not only interesting because of its past, but also because of its future. It is one of the closest stars to Earth that is likely to explode in a supernova in the relatively near future (though in astronomical timescales the “near future” could still be a million years away). When it does, expect an impressive view from Earth, far brighter still than its last outburst: SN 2006gy, the brightest supernova ever observed, came from a star of the same type, though from a galaxy over 200 million light-years away.

Comments Off on When Stars Attack! Near-Earth Supernova Explosions Threat, Effects and Kill Zone
April 14th, 2016
By Alton Parrish.

Combining quantum dots and organic molecules can enable solar cells to capture more of the sun’s light.
Light from the sun is our most abundant source of renewable energy, and learning how best to harvest this radiation is key for the world’s future power needs. Researchers at KAUST have discovered that the efficiency of solar cells can be boosted by combining inorganic semiconductor nanocrystals with organic molecules.
Quantum dots are crystals that only measure roughly 10 nanometers across. An electron trapped by the dot has quite different properties from those of an electron free to move through a larger material.
Organic molecules aid charge transfer from large lead sulfide quantum dots for improved solar cell performance.
“One of the greatest advantages of quantum dots for solar cell technologies is their optical properties’ tunability,” explained KAUST Assistant Professor of Chemical Science Omar Mohammed. “They can be controlled by varying the size of the quantum dot.”Mohammed and his colleagues are developing lead sulfide quantum dots for optical energy harvesting; these tend to be larger than dots made from other materials. Accordingly, lead sulfide quantum dots can absorb light over a wider range of frequencies. This means they can absorb a greater proportion of the light from the sun when compared to other smaller dots.
To make a fully functioning solar cell, electrons must be able to move away from the quantum dot absorption region and flow toward an electrode. Ironically, the property of large lead sulfide quantum dots that makes them useful for broadband absorption—a smaller electron energy bandgap—also hinders this energy harvesting process. Previously, efficient electron transfer had only been achieved for lead sulfide quantum dots smaller than 4.3 nanometers across, which caused a cut-off in the frequency of light converted.
The innovation by Mohammed and the team was to mix lead sulfide quantum dots of various sizes with molecules from a family known as porphyrins1. The researchers showed that by changing the porphyrin used, it is possible to control the charge transfer from large lead sulfide dots; while one molecule switched off charge transfer altogether, another one enabled transfer at a rate faster than 120 femtoseconds.
The team believe this improvement in energy harvesting ability is due to the interfacial electrostatic interactions between the negatively charged quantum dot surface and the positively charged porphyrin.
“With this approach, we can now extend the quantum dot size for efficient charge transfer to include most of the near-infrared spectral region, reaching beyond the previously reported cut-off,” stated Mohammed. “We hope next to implement this idea in solar-cells with different architectures to optimize efficiency.”
Comments Off on Catching More Rays with Quantum Dots and Organic Molecules for More Solar Power
April 4th, 2016
By Alton Parrish.
A novel invention using light to remove air pollution has proven to be more versatile than any competing systems. It eliminates fumes as chemically diverse as odorous sulfur compounds and health hazardous hydrocarbons while consuming a minimum of energy.

Credit: University of Copenhagen
The name of the air cleaner is GPAO and its inventor, Professor of environmental chemistry Matthew Johnson, University of Copenhagen, Denmark, published the results of testing the system in the article “Gas Phase Advanced Oxidation for effective, efficient In Situ Control of Pollution” in the scientific periodical “Environmental Science and Technology”.
Air pollution hard to removePollution is notoriously difficult to remove from air. Previous systems trying to control air pollution consume large amounts of energy, for example because they burn or freeze the pollution. Other systems require frequent maintenance because the charcoal filters they use need replacement. GPAO needs no filters, little energy and less maintenance, explains atmosphere chemist Matthew Johnson.
“As a chemist, I have studied the natural ability of the atmosphere to clean itself. Nature cleans air in a process involving ozone, sunlight and rain. Except for the rain, GPAO does the very same thing, but speeded up by a factor of a hundred thousand”, explains Johnson.
Gas is difficult to remove. Dust is easyIn the GPAO system, the polluted gas is mixed with ozone in the presence of fluorescent lamps. This causes free radicals to form that attack pollution, forming sticky products that clump together. The products form fine particles which grow into a type of airborn dust. And whereas gas phase pollution was hard to remove, dust is easy. Just give it an electrostatically charged surface to stick to, and it goes no further.
“Anyone who has ever tried dusting a computer screen knows how well dust sticks to a charged surface. This effect means that we don’t need traditional filters, giving our system an advantage in working with large dilute airstreams”, says Johnson.
See the principle of GPAO in this animationRemoves foul smells as well as noxious fumes
Patented in 2009, the system has been commercialized since 2013 and is already in use at an industrial site processing waste water. Here it eliminates foul smells from the process and saved the plant from being closed. A second industrial installation removes 96% of the smell generated by a factory making food for livestock. Further testing by University of Copenhagen atmospheric chemists have shown that the GPAO system efficiently removes toxic fumes from fiberglass production and from an iron foundry, which emitted benzene, toluene, ethyl benzene and xylene.
Vira, fungal spores and bacteria removed in bonus effectAnother series of tests revealed that the rotten egg smells of pig farming and wastewater treatment are easily removed. Odors such as the smells from breweries, bakeries, food production, slaughterhouses and other process industries can be eliminated. And that is not all, says Professor Johnson.
“Because the system eats dust, even hazardous particles such as pollen, spores and viruses are removed” states Johnson, who hopes to see his system in use in all manner of industries because air pollution is such a huge health risk.
Air pollution more deadly than traffic, smoking and diabetesAccording to a
recent report by the World Health Organization, indoor and outdoor air pollution causes 7 million premature deaths annually which is more than the combined effects of road deaths, smoking and diabetes. Pollution in air is linked to heart disease, cancer, asthma, allergy, lost productivity and irritation.
“I have always wanted to use chemistry to make the world a better place. I genuinely feel that GPAO will improve life for millions of people, especially those living in cities or near industrial producers” concludes Matthew Johnson.
Comments Off on Cleaning Air with Light Proven Uniquely Versatile
April 4th, 2016
By Alton Parrish.
Scientists have used data from NASA’s Chandra X-ray Observatory and the NSF’s Jansky Very Large Array to determine the likely trigger for the most recent supernova in the Milky Way. They applied a new technique that could have implications for understanding other Type Ia supernovas, a class of stellar explosions that scientists use to determine the expansion rate of the Universe.
Astronomers had previously identified G1.9+0.3 as the remnant of the most recent supernova in our Galaxy. It is estimated to have occurred about 110 years ago in a dusty region of the Galaxy that blocked visible light from reaching Earth.
G1.9+0.3 belongs to the Type Ia category, an important class of supernovas exhibiting reliable patterns in their brightness that make them valuable tools for measuring the rate at which the universe is expanding.
Scientists have used data from NASA’s Chandra X-ray Observatory and the NSF’s Jansky Very Large Array to determine the likely trigger for the most recent supernova in the Milky Way.

Image credit: NASA/CXC/CfA/S. Chakraborti et al.
“Astronomers use Type Ia supernovas as distance markers across the Universe, which helped us discover that its expansion was accelerating,” said Sayan Chakraborti, who led the study at Harvard University. “If there are any differences in how these supernovas explode and the amount of light they produce, that could have an impact on our understanding of this expansion.”Most scientists agree that Type Ia supernovas occur when white dwarfs, the dense remnants of Sun-like stars that have run out of fuel, explode. However, there has been a debate over what triggers these white dwarf explosions. Two primary ideas are the accumulation of material onto a white dwarf from a companion star or the violent merger of two white dwarfs.
The new research with archival Chandra and VLA data examines how the expanding supernova remnant G1.0+0.3 interacts with the gas and dust surrounding the explosion. The resulting radio and X-ray emission provide clues as to the cause of the explosion. In particular, an increase in X-ray and radio brightness of the supernova remnant with time, according to theoretical work by Chakraborti’s team, is expected only if a white dwarf merger took place.
“We observed that the X-ray and radio brightness increased with time, so the data point strongly to a collision between two white dwarfs as being the trigger for the supernova explosion in G1.9+0.3,” said co-author Francesca Childs, also of Harvard.
The result implies that Type Ia supernovas are either all caused by white dwarf collisions, or are caused by a mixture of white dwarf collisions and the mechanism where the white dwarf pulls material from a companion star.
“It is important to identify the trigger mechanism for Type Ia supernovas because if there is more than one cause, then the contribution from each may change over time,” said Harvard’s Alicia Soderberg, another co-author on the study. This means astronomers might have to recalibrate some of the ways we use them as ‘standard candles’ in cosmology.”
The team also derived a new estimate for the age of the supernova remnant of about 110 years, younger than previous estimates of about 150 years.
More progress on understanding the trigger mechanism should come from studying Type Ia supernovas in nearby galaxies, using the increased sensitivity provided by a recent upgrade to the VLA.
A paper describing these results appeared in the March 1st, 2016 issue of The Astrophysical Journal and is available online. NASA’s Marshall Space Flight Center in Huntsville, Alabama, manages the Chandra program for NASA’s Science Mission Directorate in Washington. The Smithsonian Astrophysical Observatory in Cambridge, Massachusetts, controls Chandra’s science and flight operations.
Comments Off on Trigger for Milky Way’s Youngest Supernova Identified
March 28th, 2016
By Alton Parrish.
For centuries, the solar system was viewed as a standard blueprint for planetary systems in the universe, with a star (our sun) at the center of a circular track, and a planet orbiting within each lane. Smaller, rockier planets fill the interior lanes, and larger gas giants orbit further out.
But over the last 20 years, more powerful telescopes have revealed, far from our solar system, a host of exotic systems with completely unexpected configurations. “Hot Jupiters,” for example, are massive “roaster” planets that circle scorchingly close to their stars. Scientists have puzzled over how these gas giants, which supposedly form far from their stars, end up on such blistering orbits.
HD 80606 b (rendered here) stands out amid the hundreds of exoplanets discovered recently because of its highly eccentric orbit. Researchers have studied how the planet’s temperature changes as it approaches, sweeps by, and moves away from its star.
Courtesy of the researchers and JPL
Now an even weirder planetary system may render the puzzle more challenging. Using NASA’s Spitzer Space Telescope, scientists from MIT, the Space Telescope Science Institute, the University of California at Santa Cruz, and elsewhere have observed an exoplanet by the name of HD 80606 b. This planet is about the size of Jupiter, though four times as massive, and resides in a system 190 light years from Earth, in the constellation Ursa Major.
What makes HD 80606 b stand out amid the hundreds of exoplanets discovered recently is its highly eccentric orbit. Instead of maintaining a circular path, HD 80606 b spends about 100 days of its year traveling an oblong route away from and then returning toward its star, much like the trajectory of a comet. Then, in a matter of just 20 hours, it sweeps around the star, very nearly touching it, before swinging away again. At its closest approach, the planet receives an enormous amount of energy from its star — over a thousand times the energy the Earth receives from the sun each day.
“If the Earth were to be moved that close to our sun, it wouldn’t take long for it to lose its atmosphere and turn its surface to magma,” says Julien de Wit, a postdoc in MIT’s Department of Earth, Atmospheric and Planetary Sciences.
In a paper published today in Astrophysical Journal Letters, de Wit and his colleagues report on observations of HD 80606 b over 85 hours, during its closest approach to its star. The researchers have studied how the planet’s temperature changes as it approaches, sweeps by, and moves away from its star. They determined that while the star-facing side of the planet boils up to an extreme 1,400 kelvins (roughly 2,000 degrees Fahrenheit) during the swingby, these roasting temperatures are short-lived. Surprisingly, they found that the planet cools in fewer than 10 hours as it orbits away, reaching temperatures so cold that it becomes invisible to Spitzer for the rest of its orbit.
“This happens every 111 days,” de Wit says. “The good thing is, the planet goes so far away that the process is a complete reset. It’s the same story over and over again.”
An eccentric perspective
It’s thought that hot Jupiters start out in circular orbits similar to that of our own Jupiter, far away from their stars. At some point, something large and massive like a nearby star pushes them into eccentric orbits. These planets are then squeezed by their stars’ gravity every time they whip close by. During every close encounter, a fraction of the gravitational energy used to squeeze the planets is dissipated as heat, slowly reducing the eccentricity of the planets’ orbits, which eventually end up tight and circular — a process known as circularization. HD 80606 b, therefore, is thought to be mid-migration, slowing moving from an elliptical to a circular track.
How long the circularization phase lasts depends on how “squishy” or pliable the planet is, given its interior properties. The more pliable a planet, the better it is at dissipating mechanical energy as heat — a trick anyone can experience by repeatedly squeezing a rubber ball, which in turn heats up the ball. Based on the squishiness of the giants in our solar system, the circularization phase is expected to occur over a relatively short period of hundreds of millions of years. Scientists believe this mechanism might explain how hot Jupiters eventually evolved their close-in orbits.
However, the new Spitzer observations suggest that HD 80606 b is not as squishy as expected. Therefore, HD 80606 b is not migrating as fast as previously thought and may maintain its highly eccentric orbit for another 10 billion years or more. If this is the case, de Wit says scientists may have to rethink theories on how hot Jupiters are formed, as it implies that the underlying migration mechanism may not be as efficient as once believed.
De Wit says that alternative theories for how hot Jupiters form — in which gas giants develop close to their stars or smoothly spiral inward with the help of planet-forming disks — may be more likely explanations for hot Jupiter evolution.
The researchers also calculated the planet’s rotation rate — the first exoplanet rotation rate ever obtained. HD 80606 b’s rotation rate, essentially the length of its day, is estimated to be 90 hours, which is twice as long as predicted for this planet.
“This system is undoubtedly very unique as it seems to challenge in many ways our understanding of planet-star interactions and planet formation,” de Wit says. “Hopefully, future studies of similar systems will help us evaluate how special this system is and how far off our initial theories were.”
Comments Off on Extreme-Weather on Oddball Planet Raises Questions About Hot Jupiter Origins
March 28th, 2016
By Alton Parrish.
A team of Stanford Bio-X scientists developed the first technique for viewing cells and tissues in 3 dimensions under the skin — the work could improve diagnosis and treatment for some forms of cancer and blindness.
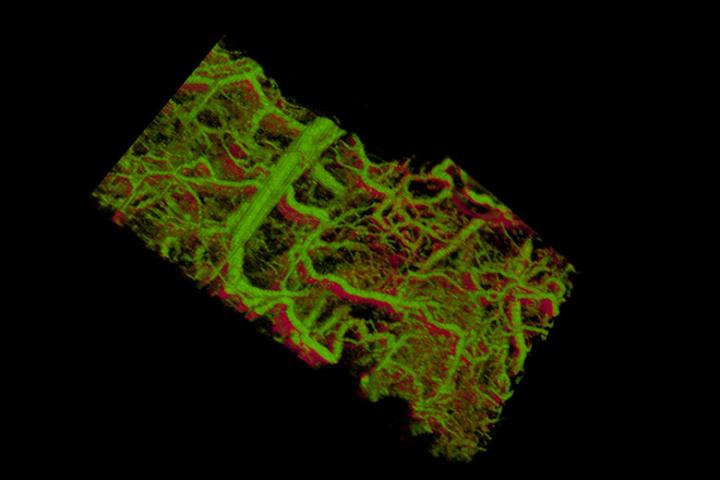
Gold nanorods within the blood vessels of a mouse ear appear green. The lower right shows vessels within a tumor that lies under the skin.
Credit: de la Zerda lab
Scientists have many tools at their disposal for looking at preserved tissue under a microscope in incredible detail, or peering into the living body at lower resolution. What they haven’t had is a way to do both: create a three-dimensional real-time image of individual cells or even molecules in a living animal.
Now, Stanford scientists have provided the first glimpse under the skin of a living animal, showing intricate real-time details in three dimensions of the lymph and blood vessels.
The technique, called MOZART (for MOlecular imaging and characteriZation of tissue noninvasively At cellular ResoluTion), could one day allow scientists to detect tumors in the skin, colon or esophagus, or even to see the abnormal blood vessels that appear in the earliest stages of macular degeneration – a leading cause of blindness.
“We’ve been trying to look into the living body and see information at the level of the single cell,” said Adam de la Zerda, an assistant professor of structural biology at Stanford and senior author on the paper. “Until now there has been no way do that.”
De la Zerda, who is also a member of Stanford Bio-X, said the technique could allow doctors to monitor how an otherwise invisible tumor under the skin is responding to treatment, or to understand how individual cells break free from a tumor and travel to distant sites.
Going for gold
A technique exists for peeking into a live tissue several millimeters under the skin, revealing a landscape of cells, tissues and vessels. But that technique, called optical coherence tomography, or OCT, isn’t sensitive or specific enough to see the individual cells or the molecules that the cells are producing, which is what interests de la Zerda.
A major issue has been finding a way of differentiating between cells or tissues; for example, picking out the cancerous cells beginning to multiply within an overall healthy tissue. In other forms of microscopy, scientists have created tags that latch onto molecules or structures of interest to illuminate those structures and provide a detailed view of where they are in the cell or body.
No such beacons existed for OCT, though de la Zerda knew that tiny particles called gold nanorods had some of the properties he was looking for. The problem was that the commercially available nanorods didn’t produce nearly enough signal to be detected in a tissue.
What the team needed were nanorods, but big ones. Nanorods are analogous to organ pipes, said graduate student Elliott SoRelle, because longer pipes vibrate at lower frequencies, creating a deep, low sound. Likewise, longer nanorods vibrate at lower frequencies, or wavelengths, of light. Those vibrations scatter the light, which the microscope detects.
If all the other tissues are vibrating in a white noise of higher frequencies, longer nanorods would stand out like low organ notes amidst a room of babble.
SoRelle’s challenge was to manufacture longer nanorods that were nontoxic, stable and very bright, which turned out to be a lot to ask. “My background was biochemistry, and this turned out to be a problem of materials science and surface chemistry,” said SoRelle, who was co-first author on the paper. He can now make nontoxic nanorods in various sizes that all vibrate at unique and identifiable frequencies.
Eliminating noise
The next challenge was filtering out the nanorods’ frequency from the surrounding tissue.
To do that, electrical engineering graduate student and Bowes Bio-X Fellow Orly Liba developed computer algorithms that could separate out the frequencies of light scattered by nanorods of various lengths and differentiate those from surrounding tissue.
With SoRelle’s large nanorods and Liba’s sensitive algorithms, de la Zerda and his team had solved the initial problem of detecting specific structures in three-dimensional images of living tissues. The resulting three-dimensional, high-resolution images were so big – on the order of gigapixels – that the team needed to develop additional algorithms for analyzing and storing such large images.
The team tested their technology in the ear of a living mouse, where they were able to watch as the nanorods were taken up into the lymph system and transported through a network of valves. They were able to distinguish between two different size nanorods that resonated at different wavelengths in separate lymph vessels, and they could distinguish between those two nanorods in the lymph system and the blood vessels. In one study, they could watch individual valves within the lymph vessels open and close to control the flow of fluid in a single direction.
“Nobody has shown that level of detail before,” said Liba, who was co-first author on the paper.
Impossible goal
This detailed imaging was de la Zerda’s initial goal when he started his lab in 2012, though he was frequently told it would be impossible. “I’m in a small department, but with very accomplished faculty,” he said. “One faculty member told me his own life story of taking big risks and that encouraged me. I thought it would be really fun to see if we can make it work and see cells talking to each other in real time.”
His gamble got off the ground primarily with a seed grant from Stanford Bio-X, which supports early-stage interdisciplinary research. “That grant allowed us to take a big risk in a direction that was completely unproven,” de la Zerda said.
Having shown that the gold nanorods can be seen in living tissue, the next step is to show that those nanorods can bind to specific kinds of cells, like skin cancer or abnormal vessels in early stage macular degeneration. Then, the technique could be used to learn more about how those diseases progress at the molecular level and also evaluate treatments in individual patients, something that previously hadn’t been possible.
Comments Off on New Bio-x Technique Can Look Under Your Skin In 3D ; See What They Can See In Great Detail
March 22nd, 2016
by Alton Parrish.
Economically more backward countries are more likely to experience both violent and non-violent civil unrest, according to research by the University of East Anglia (UEA).
The study looked at how economic backwardness has affected the likelihood of social tension and mass movements, from peaceful demonstrations to civil wars, since the end of the Second World War.
For the first time the researchers found that the greater the development gap with the world economic leader, defined as the United States, the more likely a country has experienced non-violent and violent mass demonstrations for regime change and, to a lesser degree, armed civil conflict.

Credit: Wikimedia Commons
They show that under-development causes social unrest, not vice versa, and suggest that the impact of economic backwardness has been increasing in recent decades as globalisation has made it easier to make status comparisons with others. The results also indicate that on average richer and more democratic countries tend to engage more in non-violent movements for political change than in violent ones.
The findings will be presented today at the Royal Economic Society’s annual conference in Brighton by Dr Christa Brunnschweiler, a senior lecturer in economics at UEA, who conducted the research with Dr Päivi Lujala, from the Norwegian University of Science and Technology.
“We argue that economic backwardness not only entails widespread poverty in a country, but can have serious consequences for its peace and stability,” said Dr Brunnschweiler. “Our results may serve as a warning to governments that missed opportunities for economic development will come at the price of mounting social tension and unrest.
Credit Joanna_flickr creative commons
“Economic development is not only desirable for its own sake, but also because a widening gap between development leaders and laggards poses serious risks for internal stability in the countries left behind.”
In terms of impact, the results indicate that economic backwardness has a substantial effect on social tension.
For example, Mexico, which has experienced a series of mainly nonviolent, mass political protests, had an average economic backwardness score. Had it been less backward – say on par with Israel or Singapore – its probability of seeing nonviolent protests would have been over 2 percentage points lower, and 5.6 percentage points lower if it had been as developed as its northern neighbour, the US. In South Africa, the richest country in Sub-Saharan Africa, the anti-Apartheid movement of the 1980s often turned violent. Had South Africa been as developed as Spain at the time, it would have been 3.5 percentage points less likely to experience violent social conflict.
The researchers suggest that social tension results from a combination of international comparison – people comparing their situation with others perceived to be better off and striving to catch up – and the inability to emerge from economic backwardness because of either political incompetence or the suppression by governments of any entrepreneurial activity which is perceived as a potential threat to the status quo.
The spread of the internet and the rise of social media have made international comparisons easier than in previous decades, when status aspirations were influenced, for example, by information gathered from migrants’ experiences, schooling, or television.
“In an era of the globalisation of information, a backward country’s poor or underprivileged population compares its situation not only with that of its better off co-nationals, but also with the situation of peers in neighbouring countries and places farther afield,” said Dr Brunnschweiler. “An unfavourable comparison, coupled with a political regime’s inability or unwillingness to respond to growing popular discontent, can then lead to a dangerous build-up of social tension.
“Events in the Arab Spring and in the Euro-Maidan demonstrations in the Ukraine, show that the frustrated desire to catch up with the frontier era can extend to the political sphere, particularly with repressive regimes.”
Dr Brunnschweiler and Dr Lujala analysed a new dataset on violent and non-violent mass movements for regime change or secession since the Second World War for over 160 countries, together with well-known data on armed civil conflict. They measured economic backwardness as the gap in income per capita between each country and the world development leader. The measure includes technological know-how, welfare and consumption possibilities.
To test the causal effect of economic under-development on social tension the researchers used the geographical distance of a country from either London or Washington and gathered data on mailing times and telegram charges around 1900. They argue that these are strongly linked to economic backwardness not only at the start of the 20th century, but even today.
Comments Off on Violent and Non-Violent Civil Unrest “More Likely” for Economically Backward Countries Says Study
March 22nd, 2016
By Alton Parrish.
Analysis of artifacts found on the shores of Rapa Nui, Chile (Easter Island) originally thought to be used as spear points reveal that these objects were likely general purpose tools instead, providing evidence contrary to the widely held belief that the ancient civilization was destroyed by warfare.
All fifteen standing moai at Ahu Tongariki, excavated and restored in the 1990s
Credit: Bjørn Christian Tørrissen
According to Carl Lipo, professor of anthropology at Binghamton University and lead on the study, the traditional story for Rapa Nui holds that the people, before Europeans arrived, ran out of resources and, as a result, engaged in massive in-fighting, which led to their collapse.
One of the pieces of evidence used to support this theory is the thousands of obsidian, triangular objects found on the surface, known as mata’a. Because of their large numbers and because they’re made of sharp glass, many believe the mata’a to be the weapons of war that the ancient inhabitants of the island used for interpersonal violence
These are images of various mata’a.

Credit: Carl Lipo, Binghamton University
Lipo and his team analyzed the shape variability of a photo set of 400-plus mata’a collected from the island using a technique known as morphometrics, which allowed them to characterize the shapes in a quantitative manner. Based on the wide variability in shape of the mata’a and their difference from other traditional weapons, the team determined that the mata’a were not used in warfare after all, as they would have made poor weapons.”We found that when you look at the shape of these things, they just don’t look like weapons at all,” said Lipo. “When you can compare them to European weapons or weapons found anywhere around the world when there are actually objects used for warfare, they’re very systematic in their shape. They have to do their job really well. Not doing well is risking death.”
“You can always use something as a spear. Anything that you have can be a weapon. But under the conditions of warfare, weapons are going to have performance characteristics. And they’re going to be very carefully fashioned for that purpose because it matters…You would cut somebody {with a mata’a], but they certainly wouldn’t be lethal in any way.”
According to Lipo, this evidence strongly supports the idea that the ancient civilization never experienced this oft-theorized combat and warfare, and that the belief that the mata’a were weapons used in the collapse of the civilization is really a late European interpretation of the record, not an actual archeological event.
“What people traditionally think about the island is being this island of catastrophe and collapse just isn’t true in a pre-historic sense. Populations were successful and lived sustainably on the island up until European contact,” said Lipo.
Lipo and his team believe that the mata’a are found all over the landscape because they were actually cultivation tools used in ritual tasks like tattooing or domestic activities like plant processing.
“We’ve been trying to focus on individual bits of evidence that support the collapse narrative to demonstrate that really there’s no support whatsoever for that story,” he said. “Sort of a pillar of the broader study is the fact that this is an amazing society that really was successful. It just doesn’t look like success to us because we see fields that are rock, we think catastrophe, and in fact it’s actually productivity.”
The paper, “Weapons of war? Rapa Nui mata’a 1 morphometric analyses” was published in Antiquity.
Comments Off on Easter Island Not Destroyed by War Shows Analysis of ‘Spear Points’
March 22nd, 2016
Astronomers using the Hubble Space Telescope have found faint chemical traces of the Milky Way Galaxy lurking inside one of our cosmic neighbors, a massive, starless cloud hurtling through space at nearly 700,000 miles per hour.
This object, known as the Smith Cloud, is unique among other so-called high velocity clouds because its orbit is well known, thanks to earlier studies with radio telescopes, including the National Science Foundation’s (NSF) Robert C. Byrd Green Bank Telescope (GBT). New Hubble observations suggest it was launched from the outer regions of the galactic disk, around 70 million years ago.
This diagram shows the 100-million-year-long trajectory of the Smith Cloud as it arcs out of the plane of our Milky Way galaxy and then returns like a boomerang. Hubble Space Telescope measurements show that the cloud, because of its chemical composition, came out of a region near the edge of the galaxy’s disk of stars 70 million years ago. The cloud is now stretched into the shape of a comet with tail by gravitational tidal forces. Following a ballistic path, the cloud will fall back into the disk and trigger new star formation 30 million years from now
.
Illustration Credit: NASA, ESA, and A. Feild (STScI)
Science Credit: NASA, ESA, and A. Fox (STScI)
The cloud was discovered in the early 1960s by doctoral astronomy student Gail Smith, who detected the radio waves emitted by its hydrogen. It is now on a return collision course and is expected to plow into the Milky Way’s disk in about 30 million years. When it does, astronomers believe it will ignite a spectacular burst of star formation, perhaps providing enough gas to make 2 million Suns.
“The cloud is an example of how the galaxy is changing with time,” explained team leader Andrew Fox of the Space Telescope Science Institute in Baltimore, Maryland. “It’s telling us that the Milky Way is a bubbling, very active place where gas can be thrown out of one part of the disk and then return back down into another.”
This composite image shows the size and location of the Smith Cloud on the sky. The cloud appears in false-color, radio wavelengths as observed by the Robert C. Byrd Green Bank Telescope in West Virginia. The visible-light image of the background star field shows the cloud’s location in the direction of the summer constellation Aquila. The cloud is 15 degrees across in angular size — the width of an outstretched hand at arm’s length. The apparent size of the full moon is added for comparison.
Credit: B. Saxton and F. Lockman (NRAO/AUI/NSF), and A. Mellinger
“Our galaxy is recycling its gas through clouds, the Smith Cloud being one example, and will form stars in different places than before. Hubble’s measurements of the Smith Cloud are helping us to visualize how active the disks of galaxies are,” Fox said.
Astronomers have measured this comet-shaped region of gas to be 11,000 light-years long and 2,500 light-years across. If the cloud could be seen in visible light, it would span the sky with an apparent diameter 30 times greater than the size of the full Moon.
Astronomers long thought that the Smith Cloud might be a failed, starless galaxy, or gas falling into the Milky Way from intergalactic space. If either of these scenarios proved true, the cloud would contain mainly hydrogen and helium, not the heavier elements made by stars. But if it came from within the galaxy, it would contain more of the elements found within our Sun.
The team used Hubble to measure the Smith Cloud’s chemical composition for the first time, to determine where it came from. They observed the ultraviolet light from the bright cores of three active galaxies that reside billions of light-years beyond the cloud. Using Hubble’s Cosmic Origins Spectrograph, they measured how this light filters through the cloud.
In particular, they looked for sulfur in the cloud, which can absorb ultraviolet light. “By measuring sulfur, you can learn how enriched in sulfur atoms the cloud is compared to the sun,” Fox explained. Sulfur is a good gauge of how many heavier elements reside in the cloud.
The infalling Smith Cloud is invisible at wavelengths that the Hubble Space Telescope is sensitive to. (The cloud can be seen in radio wavelengths.) However, Hubble’s Cosmic Origins Spectrograph can measure how the light from distant background objects is affected as it passes though the cloud. These measurements yield clues to the chemical composition of the cloud. By using this intergalactic forensics, Hubble astronomers trace the cloud’s origin to the disk of our Milky Way. Combined ultraviolet and radio observations correlate to the cloud’s infall velocities, providing solid evidence that the spectral features link to the cloud’s dynamics.
Illustration Credit: NASA, ESA, and A. Feild (STScI)
Science Credit: NASA, ESA, and A. Fox (STScI)
The astronomers found that the Smith Cloud is as rich in sulfur as the Milky Way’s outer disk, a region about 40,000 light-years from the galaxy’s center (about 15,000 light-years farther out than our Sun and Solar System). This means that the Smith Cloud was enriched by material from stars. This would not happen if it were pristine hydrogen from outside the galaxy, or if it were the remnant of a failed galaxy devoid of stars. Instead, the cloud appears to have been ejected from within the Milky Way and is now boomeranging back.Though this settles the mystery of the Smith Cloud’s origin, it raises new questions: How did the cloud get to where it is now? What calamitous event could have catapulted it from the Milky Way’s disk, and how did it remain intact? Could it be a region of dark matter — an invisible form of matter — that passed through the disk and captured Milky Way gas? The answers may be found in future research.
“The Smith Cloud has all the characteristics of a small, infalling dark-matter dominated galaxy, but its gas looks like it came from the outer parts of the Milky Way,” said Jay Lockman, an astronomer with the National Radio Astronomy Observatory (NRAO) in Green Bank, West Virginia, and co-author on a paper describing these results. “There are theoretical calculations suggesting that a dark matter satellite could capture gas as is passes through the Milky Way disk and that may be the amazing circumstance we are witnessing.”
“The Smith Cloud just gets better and better,” concluded Lockman.
The team’s research appears in the January 1, 2016 issue of The Astrophysical Journal Letters.
The National Radio Astronomy Observatory is a facility of the National Science Foundation, operated under cooperative agreement by Associated Universities, Inc.
Comments Off on Fingerprint of Milky Way Found Far from Home in Galactic Neighbor
March 22nd, 2016
By Alton Parrish.
An electrical and systems engineer at Washington University in St. Louis has designed a method that, figuratively, forces a leopard to change its spots.
Jr-Shin Li, the Das Family Distinguished Career Development Associate Professor in Electrical & Systems Engineering in the School of Engineering & Applied Science, has devised a unified mathematical framework to design a single, global input, or waveform, that is able to inspire a population of nonlinear, rhythmic units ubiquitous in nature and manmade systems.
A global control signal is capable of selectively steering the complex chemical reaction into chosen spatial patterns, in this example, between shapes of letters ‘O’ and ‘K’ (in blue).
Credit: Washington University in St. Louis
The theory has been shown on a nickel multi-electrode array (the leopard) to form first one pattern, the letter O, then a short while later switches to another pattern, the letter K, and then returns to the initial pattern O again. Each pixel in the letter is a chemical reaction.
The significance of the study is the contribution to advance the ensemble control theory with the development of effective computational algorithms, that will enable researchers to better understand and control oscillation in a variety of important application domains, such as heart pacemakers, neuronal firings in the brain and circadian timekeeping. Getting the 20 oscillatory reactions on an array to switch patterns is an example of “entraining” abundant, often similar dynamical systems simultaneously by a single command, or input.
The phenomenon of oscillation is nicely illustrated with the arrival of fireflies in summer. Fireflies oscillate in a barely perceptible pattern to most observers until they eventually are all communicating on the same wavelength, pulsing simultaneously. During the oscillation phenomenon, after a chemical reaction, the chemical products often oscillate in different frequencies (faster or slower).
“In many applications, it’s beneficial to synchronize these oscillators,” Li said. “So we apply the input to make things synchronized.”
Li and his former student, now at Los Alamos National Laboratory, and collaborators from Saint Louis University published their results online in Nature Communications March 18.
“We’ve come up with a unified, systematic theory that will work on any nonlinear oscillating system,” Li said. “Mathematically, it works for any number, be it 20 or 2,000 or more.”
This Jr-Shin Li.
Credit: Washington University in St. Louis
Li’s collaborator at Saint Louis University, Istvan Z. Kiss, the Arts & Sciences Associate Professor of Chemistry, has said that it is feasible to show any desired phase pattern changes in an ensemble of up to 120 chemical oscillatory reactions in his laboratory; however, extensions to thousands — or millions — of reactions are theoretically possible. The results published in Nature Communications are thought to be a breakthrough of a successful pattern switching in nonlinear oscillators following a global input.
“The paper shows that this is possible both theoretically and experimentally,” Li said.
While the method works in synchronization, it also works in cases where de-synchronization is desired. In Parkinson’s disease, for instance, the part of the brain where the disease rears its ugly head is pathologically synchronized when it’s not supposed to be. In theory, Li’s waveform, applied directly to the brain, would desynchronize a certain population of neurons that work together pathologically to give Parkinson’s disease sufferers their characteristic tremor.
Li is exploring with Erik Herzog, PhD, professor of biology in Arts & Sciences at Washington University, how his input, or control, can be used to regulate circadian systems, or biological clocks.
The waveform in circadian systems is the use of light to change the synchronization behavior of circadian (biological clock) systems. Each circadian cell might have a different clock, and one of the goals of this research is to entrain all of the circadian clocks to just one clock.
“This has a potential application in mitigating jet lag,” Li said.
Li’s theory of ensemble control can design a control input, often referred to as a waveform, or “pulse,” something like a conductor leading an orchestra. It has the ability to drive a great number of nuclear spins with different frequencies in nuclear magnetic resonance (NMR) spectroscopy, steering the whole diverse ensemble of nuclear spins from any initial state to any desired target state to enable a clearer magnetic resonance image for medical diagnosis.
In robotics, Li’s theory can design single control inputs that simultaneously would make numerous robots in a system obey the same command. He collaborates with researchers across disciplines in the areas of quantum mechanics, neuroscience, computer science, biology, biomedical engineering and robotics.
Li’s next step in entrainment of ensemble systems is to implement his method in biological and neuroscience systems to see whether it can make inroads in deep brain stimulation, the state-of-the art Parkinson’s disease treatment, aimed at controlling the characteristic trembling of patients. In these areas, “complexity and uncertainty are the challenges,” Li said. “They are much more difficult to control than chemicals, which are physical systems.”
Comments Off on Global Control Signal Discovered
March 15th, 2016
Newly-excavated village in the Jordan Valley sheds light on the historical shift from foraging to agriculture, say Hebrew University of Jerusalem archaeologists.
Archaeologists from The Hebrew University of Jerusalem revealed in Israel a prehistoric village, dated around 12,000 years ago, in excavations in the fertile Jordan Valley.
The site, named NEG II, is located in Nahal (wadi) Ein-Gev, at the middle of the perennial stream that flows west to the Sea of Galilee.
NEG II nestled in the Jordan Valley
Credit: Austin (Chad) Hill ©Leore Grosman
A series of excavations on site revealed an abundance of findings, including human burial remains, flint tools, art manifestations, faunal assemblage, ground stone and bone tools. The excavated area revealed an extensive habitation with deep cultural deposits (2.5 to 3 meters deep) and the site is estimated as covering roughly 1200 m2.Surprisingly, the village differs markedly from others of its period in Israel. The findings encapsulate cultural characteristics typical of both the Old Stone Age — known as the Paleolithic period, and the New Stone Age — known as the Neolithic period.
“Although attributes of the lithic tool kit found at NEG II places the site chronologically in the Paleolithic period, other characteristics – such as its artistic tradition, size, thickness of archaeological deposits and investment in architecture – are more typical of early agricultural communities in the Neolithic period,” said Dr. Leore Grosman, from the Institute of Archaeology at The Hebrew University of Jerusalem, who led the excavations.
“Characterizing this important period of potential overlap in the Jordan Valley is crucial for the understanding of the socioeconomic processes that marked the shift from Paleolithic mobile societies of hunter-gatherers to Neolithic agricultural communities,” added Dr. Grosman.
Excavations revealed buildings of a Natufian village
Credit: Dr. Leore Grosman
The Paleolithic period is the earliest and the longest period in the history of mankind. The end of this period is marked by the transition to settled villages and domestication of plants and animals as part of the agricultural life-ways in the Neolithic period.In a research, published in the journal PLOS ONE, the archeologists described the village as one of the latest settlements in the Levant region of the Late Natufian – the last culture of the Paleolithic period.
The Natufian culture (about 15,000-11,500 years B.P.) is known from sites all over the Levant – from the Negev and the Sinai in the south to Syria and Lebanon in the north.
NEG II was occupied in the midst of the cold and dry global climatic event known as the Younger Dryas (12,900–11,600 years B.P.), where temperature declined sharply over most of the northern hemisphere. Affected by climatic changes, Late Natufian groups in the Mediterranean zone became increasingly mobile and potentially smaller in size.
However, excavations at NEG II show that groups in the Jordan Valley became more sedentary and potentially larger in size.
“The buildings represent at least four occupational stages and the various aspects of the faunal assemblage provide good indications for site permanence. In addition, the thick archaeological deposits, the uniformity of the tool types and the flint knapping technology indicate intensive occupation of the site by the same cultural entity,” said Dr. Grosman.
Researchers say that this shift in settlement pattern could be related to greater climatic stability due to a lesser effect of the Younger Dryas in the region, higher cereal biomass productivity and better conditions for small-scale cultivation.
These factors had provided the ingredients necessary to taking the final steps toward agriculture in the southern Levant, researchers say.
“It is not surprising that at the very end of the Natufian culture, at a suite of sites in the Jordan Valley, that we find a cultural entity that bridges the crossroads between Late Paleolithic foragers and Neolithic farmers,” said Dr. Grosman.
Comments Off on Prehistoric Village Found in the Jordan Valley Links Old and New Stone Ages