The correction in the markets is coming. The markets will correct in the short term, which will allow them to move much higher in 2017. The short-term indicators of market momentum are overbought. The trend indicators are clearly still BULLISH!
President Trump’s cuts and his pro-business attitude have been sending U.S. stocks into new record high territory. This is a clear indication that investors are looking to the White House for inspiration. The SPX Index, Dow Jones Industrial Average and Nasdaq Composite Index are trading at all-time highs. They are extending the rally that began when President Trump was elected.
“Buy The Dip”?
My version of Elliott Wave Analysis points to a short-term market correction ensuing. The details have been posted to members of our TMTF service.
After it has completed WAVE 5, the SPX will commence its’ short-term correction. The correction comes in the form of a move in the opposite direction of its’ impulse primary move. It is a counter-trend that is made up of 3 corrective waves“A-B-C”.
Sentiment Indicators:
Mr. Michael Hartnett, Bank of America Merrill Lynch’s Chief Investment Strategies, is bullish on risk assets based on the banks’ forecasting model. As the stock market continues to climb, in the face of political uncertainty, it is “not dangerously euphoric yet, this situation has not played itself out yet,” he concludes in a February 7th, 2017 report titled “Are we there yet? No.”
Mr. Hartnett and his team believe that current conditions are perfectly situated for a “10% melt-up” in stock prices. They see the “stock market continuing to plow ahead, but by most of its’ measures the runway is not unlimited in length”. The extremes observed in the market are not extreme enough. The Bull & Bear Indicator, (BAML), the broadest measure of investor sentiment, is currently at a 6.1 reading on a scale of 10. This is significantly off the 2.0 reading during Brexit and the anomaly 0.0 reading during the February 2016 stock market lows. It still is not above the 8.0 reading which indicates investors are too emotional to the upside.
The SPX Marches To 2550!
The SPX Technology Sector, XLK rose to a new record high last Friday, February 17th, 2017. This sector is on a winning streak. The last time that technology stocks enjoyed a massive winning streak, it led to much higher gain in the markets. This sector will make the NDX-100 the strongest index and the SPX the second strongest. My next measured target for this move is at $60.00.
With the accommodating Federal Reserve saying: “Yellen To Congress: We’ll do Something Someday”. We should prepare for never before seen new highs in all U.S. markets, especially the technology heavy Nasdaq (https://www.wsj.com/articles/yellen-says-fed-will-consider-raising-rates-at-coming-meetings-1487084405). Chairwoman Yellen’s has this unique ability to say “absolutely nothing while pretending that she’s got everything under control. There was no further information on the overrated Fed Funds rate hike issue — overrated because it is both meaningless and a distraction to the real problems at hand”. Her testimony is best summed up as: “I’m not sure, we’ll just have to see.” The Federal Reserve has elected to keep “kicking the can down the road”, even further!
President Trump said that he would add another $5 trillion to the $19.9 trillion public debt:
(http://www.usdebtclock.org/). In the meantime, he is devoted to balancing the budget within ten years, not cutting Social Security or Medicare, ramping up defense spending and passing a tax cut. President Trump’s New Economy Challenge is to create 25 million new jobs over the next decade. Additionally, President Trump’s proposed tax and eliminating costly red tape will provide a welcome relief to small business owners who employ 78% of Americans and which will create 74% of all net new jobs within a decade.
Quantitative Easing, (QE) has bought time, since “The Great Recession of 2008” for our financial/monetary wizards to keep the can on the road, thereby perpetually kicking it further into the abyss through QE. Solutions are being discussed amongst policy makers, behind closed doors (http://www.un.org/press/en/2014/gaef3417.doc.htm). A part of the U.N. resolution states that, “Recognizing the need to create a legal framework that facilitates the orderly restructuring of sovereign debts, allows the re-establishment of viability and growth without creating incentives that inadvertently increase the risk of non-compliance and acts as a deterrent to disruptive litigation that creditors could engage in during negotiations to restructure sovereign debts.”
Our current fragile financial global monetary system does not allow public debate regarding significant changes or it would risk implosion. Capitalism will survive!
The New Era of Trading:
Trade for a living; win like the Professionals! This is a very exciting time to be a trader and follow my core strategy which allows me to perform in true form! The markets will extend its’ rally into 2017. Every week, there are new actionable trade ideas. Avoid what I refer to as “Herd Mentality”, which is always putting you on the losing side of the trades.
The next BIG TRADE is setting up. You should take advantage of my hard work and expertise to make you short term profitable trades. Protect your financial future by getting my market and trade alert reports every week. Your portfolio should involve a proven strategy which I provide.
We have just entered a new commodity trade (UGAZ) Feb 21 as its forming a bottoming pattern. We have locked in 10% in 36 hours and hold the remaining for much larger gains. Do you want to be in the next trade of the Next Hot Stock setup? My subscribers banked a 112% in a swing trade with NUGT (Dec 16 – Feb 8th). All the trades are based on my Momentum Reversal Method (MRM) trading system.
Another trade this month was ERX, in which we took a nice profit of 7.7% in less than 24 hours after entry. All risks are well contained.
Have you ever been presented with an opportunity and missed out on it? Well, here is an opportunity you Do NOT want to miss out on.
Based upon my unique “Cycle Analytical” work combined with my “Proprietary Predictive Analytics Model”, I can assure you that there are new highs to be made in the U.S. stock. Appling my unique metric, which are not available to the public, I can inform you that the stock markets are not overbought or overextended, at present. The market remains in a clear bullish trend! This next new leg is very sustainable!
Technically Speaking, It Is Now Back To “Buy The Dip”:
The SPX, Dow Jones and the Nasdaq Composite all closed at new all-time highs last Friday, February 10th,2017. The Trump Rally is just getting started according to Bloomberg.
Investors should expect that the global markets will continue their bull market run throughout the first half of 2017 rather than forming a top which leads to a bear market. “Extremes” have lost their’ meanings, at this point. The Federal Reserve has given the green light to major banks in the U.S. to raise dividends and buy back shares of their companies. The huge thrust in momentum has now returned to the four U.S. stock indexes.
Nicholas Teo of KGI Securities said that: “Ever since his victory in November, global stock markets have been steered by actions events rhetoric emanating from the new commander-in-chief”.
The trigger events show the willingness of the markets to give the Trump Administration a lot more ‘slack’ as we engage into 2017. Billions of dollars are continuing to flow into the U.S. real estate market from Chinese nationals. They are using their offshore cash reserves to make payments on the properties they have speculated on in the U.S. There are also big-money speculators who have the sophistication needed to circumvent China’s Capital Controls.
Blackrock estimates that there is a whopping $50 trillion in cash “sitting on the sidelines”. This money has come from global central-banks, financial-firm reserves and consumer savings accounts. Blackstone is keeping nearly one-third of its’ assets in cash. Fund managers have increased their reserves to levels that equal the highest since 2001. This means that there is a lot of liquidity with nowhere to go, but UP.
We are still in the early days of the new Trump Administration and everything seems to be going his way. President Trump’s proposed economic policies are being well received by U.S. businesses, especially Wall Street big banks. His plans are certainly positive – such as deregulation, defunding of various useless federal agencies, simplification of the tax code and lowering taxes. Many people, including some of the best money managers, in the world, are at a loss trying to figure out where to put their money, right now. However, all that you need to do this year is to follow my lead as I strive to make profitable returns and be on the right side of all markets, and you cannot afford to miss any hugely profitable setup this year!
All of the indicators continue to suggest higher prices ahead!
The Elliott Wave Principle is a description of how groups of people behave. It reveals that mass psychology swings from pessimism to optimism thereby creating specific and measurable patterns. In the chart below, repeating patterns in prices are displayed showing where we are located at any given time. In those repeating patterns, I can predict where we are going next.
Wave 5:
Wave 5: Wave five is the last leg in the primary direction of the dominant trend. Wave 5 advance is caused by a small group of traders. Prices will make a new high above the top of wave 3.
How To Make Money In 2017!
Do you trade like the professionals do? Most traders make the same mistakes – which is why they consistently lose money! Implementing my winning strategy by receiving SMS text alerts every time we enter or close a trade is the best way to get you setup and be profitable on the same day! Trading and focusing on my Momentum Reversal Method (MRM) and trading just the hot stocks and sectors for quick oversized gains is my expertise. Therefore, these momentum trades are moving significantly in one direction on heavy volume. The length of time for which I may hold a momentum trade depends on how quickly the trade is moving with trades lasting 3-25 days in length and we look for a7%- 35% potential gain.
Momentum traders are truly a unique group of individuals. Unlike other traders or analysts who dissect a company’s financial statements or chart patterns, a momentum trader is only concerned with stocks in the news. These stocks will be the high percentage and volume movers of the day/week.
On February 8th, 2017, myself and subscribers closed out our NUGT trade for a 112% profit that we entered into on December 16th.2016,
Sometimes stocks move very fast. As I enter any new swing trades, I will immediately send out these alerts to you on your mobile device.
On February 8th, 2017, we entered the ERX at $33.00. Right after we got into this trade, ERX, (http://etfdb.com/etf/ERX/), we were up 6% to 8% and we closed half our position. Instantly receiving these alerts on your mobile device can make a huge difference in both time and profits as you saw in the ERX setup! I always send out my swing trades to my members by SMS, but keep in mind most trades can be entered within a 1-3 day period as I don’t catch exact market bottoms or tops.
America Is Happy, Again!
A recent Gallup Poll reported that American’s confidence in the U.S. economy remained strong in January of 2017. Gallup’s U.S. Economic Confidence Index averaged +11, which is the highest monthly average reached in Gallup’s nine-year trend.
Comments Off on The Trump Rally Is Just Getting Started!
Our recent analysis bases on a previous report of the potential for a further run in the US markets based on a number of technical and fundamental factors leads to the question of “what could happen with Gold and Silver”. A broad US market rally may put some pressure on the metals markets initially, but, in our opinion, the increase in volatility and uncertainty will likely prompt more potential for upward price action in precious metals.
As with most things in the midst of uncertainty and transition, the US Presidential election has caused many traders to rethink positions and potential. As foreign elections continue to play out, wild currency moves are starting to become more of a standard for volatility. Combine this with a new US President and a repositioning of US global and local objectives and we believe we are setting up for one of the most expansive moves in recent years for the US general markets and the metals markets. This week, alone, we have seen a flurry of action in DC and the US markets broke upward on news of the Dakota Pipeline and other Executive actions.
As we wrote week or so ago, we believe the US markets will push higher in 2017 a business investment, US strategy and foreign capital runs back into the US equity market chasing opportunity and gains. Additionally, we believe the strength of the US market, paired with continued strength of the US Dollar, will drive a further increase in global volatility and wild swings in foreign markets. This volatility, uncertainty and equity repositioning will likely drive Gold and Silver to continued highs throughout 2017 – possibly much longer if the new trend generates renewed follow-through.
Our belief that the US markets will continue to melt-up while certain foreign markets deteriorate relates to our belief that currency variances will become more volatile and excessive over the next few months. This, in combination with a renewed interest in developing US economic solutions, will likely drive the US markets higher while the metals markets will continue to become a safe-haven for US and foreign investors to protect against deflation and foreign market corrections.
S&P Futures are setting up a clear bullish pennant/flag formation that will likely prompt an explosive price move within 2~3 weeks. This bullish flag formation is likely to drive the ES price higher by roughly 100+ pts. Currently, strong resistance is just above 2275, so we’ll have to wait for this level to be breached before we see any potential for a bigger price move.
SP500 Weekly Chart
SP500 Daily Chart
GOLD is channeling in a very clear and narrow upward price channel and trading in the middle of a support zone. The recent reversal, near the end of 2016, was interesting because GOLD trailed lower after the US election, but then reversed course just before the new year. The interesting fact about this move is that this new upward swing in GOLD correlates with the beginning of the Bullish Flag in the S&P Futures as well as a decrease in volatility. We believe as this Bullish Flag will prompt a jump in volatility and price action that will result in is a strong push higher in GOLD.
GOLD Weekly Chart
Gold Daily Chart
SILVER is setting up in a similar manner as GOLD. Although the SILVER chart provides a clearer picture of the downward price channel that is about to be breached – and likely drive both SILVER and GOLD into a new bullish rally. The support Zone in SILVER, between $16.60 ~ $17.40 is still very much in play. SILVER will likely stay within this zone while the Bullish Flag plays out. Yet, when the breakout begins, a move above $18.00 will be very quick and upside targets are $18.50~18.75 and $19.50~$20.00 (possibly much higher in the long run).
SILVER Weekly Chart
Silver Daily Chart
EUR/USD correlation to the US moves should be viewed as measure of strengthening US economy/USD as related to foreign market volatility and potential. As the USD strengthens, this puts pressure on foreign governments and global transactions based in USD. This also puts pressure on the METALS markets because billions of people around the globe consume precious metals as a “safe-haven” related to currency volatility. We expect the EUR/USD levels to fall near “parity” (1.00) again and possibly dip below parity based on future foreign election results. This volatility and uncertainty will translate to increased opportunity for GOLD and SILVER to run much higher over the next few months.
EURUSD Daily Chart
USDMXN Daily Chart
USDGBP Daily Chart
Right now is a fantastic opportunity to take advantage of these lower prices. We may see rotation near to the lower support zone levels as price rotates over the next few weeks. The key to any trade in the metals market is to understand the potential moves and watch for confluence and volatility in other markets. We believe the next few weeks/months will be very telling. If we are correct, we’ll see new highs in the US markets fairly quickly and we’ll see a new potential bullish breakout in GOLD and SILVER.
Comments Off on Market Melt-up Brings Volatility to Metals
My analysis of the recent VIX action is clearly warning of a potentially massive price volatility increase in the US and global markets. Many traders use and trade the VIX as a measurement of volatility. The VIX is a measurement of the expected market volatility over the next 30 days. As the VIX rises, traders expect larger and more volatile price swings. As the VIX declines, traders expect smaller and more narrow price swings.
Currently, the VIX is near historical low levels and has recently past a critical cycle midpoint.
One can see from my cycle analysis, I am tracking to cycle events; a longer term top-to-top cycle event and a smaller bottom-to-top cycle event. I call these dual-phase and single-phase cycle events, respectively.
This analysis tells me we recently past a single-phase bottom cycle (near Nov 30th) and are expecting a dual-phase top cycle event near Feb 17th. Given the expected opportunity to retest the VIX high channel, the potential price move in the SSO would relate to a 11%~16.5% price swing (approx) – or larger. The dark blue downward VIX channel is a boundary that we would expect the VIX move to attempt to reach. It could blow past this level and develop a much larger price correction in the US and Global markets but lets just focus on one target at a time for now.
Now, let’s take a look as how this relates on the SSO chart.
On the below SSO chart, I have highlighted the critical VIX “Peak” levels with rectangles and I have drawn the VIX Single and Dual phase event cycles. You can clearly see how these event cycles align with critical price swings and, most recently (after the US election cycle) correlated with a cycle event low and high.
On the hard-right edge of the chart, I have drawn what I believe will be the likely VIX cycle event target range and target date range. I expect the VIX to increase moderately over in the next week or so and explode as stock prices rotate lower. I expect the US and global markets to react to these time cycles and for an increase in volatility. The chart shows a sharp correction as that is the max potential, but we could only see a 2-5 day dip before it heads higher. Either way volatility should jump soon and I plan to get involved with an ETF.
Our last few ETF trades generated some big profits with EDZ 20.7%, NUGT 50%, and UGAZ 74% return. I feel the VIX is starting to show signs of an opportunity unfolding.
Comments Off on Massive VIX Warning for all Traders
A financial revolution is now taking place and I want to tell you the story. It has rather large implications for interest rates, the stock market, gold and real estate.
The only reasons for the DOW JONES sharp gains, post-election, is due to the fact its’ index leans toward financial and industrial stocks, (as seen in the chart below), more than the SPX and Nasdaq Indexes. Those two sectors have outstripped most of the market since Election Day.
Trump’s economics policies include: substantial tax cuts, spending at least $300 billion on infrastructure, increasing defense spending and shaking up major trade deals.
President-elect Trump plans to change the status quo not only in Washington D.C. politics, but for global financial markets, as well. On Monday, December 19th, 2016, the members of the Electoral College will gather in all 50 state capitals to cast their votes for president. It is then, and only then, that the next president of the United States will be elected.
All the proposed infrastructure spending is expected to put upwards pressure on “demand-pull” inflation which would be a catalyst for tighter monetary policy.
Regardless of the U.S. negative economic data, I believe that the U.S. equity markets are destined to trend higher now.
‘Hot money’ is supporting the market. The FED will not stop supporting this market because it promotes theillusion of a healthy economy.
Stocks should continue to rise for the remainder of 2016 with the belief that Trump’s stimulus package will boost company profits and growth. Last week, investors returned into investing of equities. This was evidenced by the massive Equity ETF flows, last week, of $31 billion. You should follow my trading plan as it is presented daily by video. You cannot afford NOT to be part of my cutting edge daily “cycle analysis”!
Institutional investors have been caught on the wrong side of all market ‘asset classes’. The rate on the 10-Year U.S. Treasury Yield ($TNX) surged (as can be seen in the chart below), thereby, increasing interest rates in the United States. On November 9th, 2016, the first day after the Presidential election, yields rose.
Global bonds yields, around the world, remained at record lows and with no real prospect of them rising much, if at all. When Japans’ Ten Year Yields climbed above 0, the BOJ promptly intervened with its’ unlimited bond buying program. The ECB President Draghi signaled that its’ QE program will continue. Global investors will want to invest their money in U.S. Treasury securities. There has been a huge sell-off on international bond markets in response to the rising higher yields (bond prices fall as interest rates rise).
The Revolution:
Our historically low-interest rate environment that we have experienced for too many years is soon coming to an end! It came about following the global ‘financial crisis’.
All the markets have shifted radically and with longer-term interest rates spiking higher, along with copper, iron ore, nickel, and shipping costs. The world is preparing for a large infrastructure project in the world’s largest economy.
If, and when, President- elect Trump attempts to patch up our current financial and economic system, he will struggle to be successful. If Donald J.Trump truly wants to fix the economy, he must reshape the Federal Reserve: (http://www.globalresearch.ca/trump-prepares-to-take-over-the-federal-reserve/5557824). The Federal Reserve Banks consider themselves to be private corporations with private funding.
Our current financial system is not working. The powerful forces on Wall Street restructured our financial system over a century ago. The Federal Reserve was created on December 23rd, 1913. This Central Bank (http://www.nytimes.com/2016/11/13/business/economy/trump-the-fed-yellen-gets-ready-for-reckoning.html?_r=1) has turned the U.S. dollar into a debt-based currency that continuously is inflated creating an endless debt spiral from which we cannot recover from!
The Bottom Line:
Being on the right side of all the financial markets are discussed in my daily videos telling you where you need to be in these markets to take the opportunities that are presented. Today, there are unique trading setups in which you can make HUGE profits in.
Follow my lead at www.TheGoldAndOilGuy.com where I trade ETF’s and recently close UNG for a quick 2.6% profit and GDX for another 5% profit in a couple days.
If you prefer more lucrative potential profits like these recent trades: EDZ 20.7%, NUGT 11%, UGAZ 36%, VUZI 25% then join us at www.ActiveTradingPartners.com
The FED and the Corporate World understand that there is NO economic recovery. They need to keep feeding this ‘bull market’ with plenty of accommodative easing or this ‘bull’ will die. The FED will do whatever it takes to maintain this by cutting rates to near zero and below so as to spruce up the economy. However, these conventional policies that are being applied, by the FED, will not work seeing as the ‘deflationary forces’ have gained momentum. Global economies cannot sustain rate hikes. They will continue to use ‘expansionary monetary policy’, indefinitely: (https://finance.yahoo.com/news/trump-says-fed-chief-yellen-114816250.html).
The FED will no longer remain the ‘lone wolf’ Central Bank of and by keeping interest rates from going negative. The New Zealand Central Bank went through this same cycle, last year, at which time the economy could not sustain a rate hike, thus resulting in a quick cycle of rate cuts.
The ‘herd mentality’ is now at the stage where they must accept this as the ‘new norm’. They want to keep this illusion alive and do not want to deal with the reality.
When the FED does implement negative interest rates, the stock markets are going to soar so high that it will probably even shock the ‘bulls’. Thus, this is the reasoning that the market will not currently crash, but will experience sharp corrections. In this current market environment, I now recommend putting your money into precious metals.
This is one of the most detested ‘bull markets’ in history. The FED has provided this market with the ingredients that it needs to take it to the ‘bubble level’. The masses will embrace this market in the same manner as the corporate world has done so for the past eight years.
The main trigger for the financial crisis of 2008 was the issuance of mortgages that did not require down payments. The ease at which one could get mortgages, in the past, is what drove housing prices into unsustainable levels.
Currently, Barclays has launched the “Family Springboard Mortgage” which allows homebuyers the opportunity to purchase a property with a mere 5% deposit. In order to acquire this 5% deal, one will need guarantors to put up the cash, which, in turn, will be lost if one fails to repay the mortgage.
When the FED starts purchasing private assets, this will negatively impact economic growth and consumers’ well-being. This reasoning is that the FED will use this power to keep failing companies alive and thus preventing the companies’ assets from being used to produce goods or services which are more highly valued by consumers.
The Reality:
Over 50% of Americans do not have enough money to invest in stocks. The U.S., unfortunately, is currently appearing to be closer to that of a third world nation. Americans appear to be living hand to mouth thus making it more and more difficult for the average person to focus on his/her financial security. One in every seven Americans currently depend on food stamps in addition to using Food Banks, despite this ‘so-called economic recovery’.
The chart below from Banktrate.com illustrates that a total of 74% of individuals either do not have enough money to invest in the stock market or they do not know anything about stocks.
Random tests have already shown that the monkeys with darts fare better than most of these experts would.
The severe economic contractions which I have been speaking of, over the last couple of years, should now be evident to all of us, today. Productivity has now fallen to a negative rate. Investment has stalled and individuals have turned against globalization. Without productivity growth, capitalism becomes unpopular, globalization becomes unpopular and politicians, in turn, become unpopular.
Conclusion:
Gold and silver should be viewed as a form of insurance against the impending future financial disaster. We will also experience another disaster, sooner or later. I am not advocating that you should load up on bullion seeing as the precious metals sector has put in a bottom. I am referring to one obtaining insurance against another financial crisis that has the potential to be larger than the 2008 financial crisis was.
Every crisis also brings with it an opportunity, hence, one should make the best use of this opportunity before the price of gold and silver jump and value. It is better to invest now and see one’s investments multiply rather than waiting for the crisis to commence and pay a premium for insurance later.
Comments Off on Is The Fed Delaying The Day Of Reckoning?
Last week ended on a very positive note for those who follow and trade filtered price spikes.
What is a filtered price spike? In short, I scan pre-market, and post-market trading hours’ price charts of SPY, QQQ, IWM, GLD, and GDX for a very special odd tick in the market which creates a spike on the chart.
These spikes could be to the upside or downside, does not matter. What they tell me is the direction which the market (market makers) are going to try and move the market in then next 48 hours.
As long as you can trade 1x, 2x or 3x ETFs, futures, Binary options, spread betting, or CFD’s, then you can take full advantage of these quick and powerful moves.
These spikes generally are not huge percent movers, typically range between 0.25% – 1.1%, but they are highly accurate and when leverage is used like trading futures you can pocket $250- $1500 quickly.
I have found price spikes to work exceptionally well in predicting market-moving news before it takes place like Brexit and Friday’s FED decision.
Below you will see a chart of GLD (gold) which flashed us a with a buy signal 36 hours before gold shot up in price post the FED decision.
This week (Monday Aug 29th) SPY Spike and Target Hit
On Friday after the market closed I saw a spike up on the SPY chart. You can see what happened the next trading session once the market opened – Market rallied and spike was filled for a quick $450 profit.
Concluding Thoughts:
In short, if you are looking for a few extra trades each month that are highly accurate and only put your money at risk for a very short period of time then you should look into getting my ETF trades and Spike Alerts.
Comments Off on The Power of Price Spikes On Intraday Charts
I have pointed out earlier, gold is forming a possible short-term top. It is on the verge of completing a bearish ‘Head and Shoulder’ pattern. The pattern is confirmed if gold closes below $1220/oz. The downside pattern target for this setup is $1138/oz.
If gold starts to rally and breaks out to the upside, then we should see the $1396 level be reached based on technical analysis.
I will open a new long gold position when the time feels right. With technical analysis strongly suggesting gold and silver have bottomed, New breakouts to the upside in metals and mining stocks can be bought.
On the other hand, silver has formed an almost perfect cup and handle pattern and has broken out of it. It has reached its first target objective; chances are that silver will either consolidate or pullback after having met its target or move up to $18.70/oz. levels, which is the pattern target of the ‘Cup and Handle’ pattern formation. However, new buying is not advised at current levels due to a poor risk-reward ratio.
If you have not read the post about what the Silver COT data is warning us about be sure to read this short post: Click Here
If we take a look and monitor the gold/silver ratio closely, recently, the ratio had touched its resistance of the past 20 years. Every time the ratio has returned from the resistance, the minimum it has retraced is to the levels of 45.
There are no reasons to believe that it will be any different this time around. Hypothetically, if gold were to remain at $1236/oz. and if the ratio corrects to 45, silver will reach $27.5/oz., which is a 62% increase from current levels.
Hence, it is prudent to stay with silver for a better return compared to gold once price has a pause to regroup before the next rally.
How to Trade Gold & Silver Conclusion
Buying gold and silver offer different rate of returns to the investors. If an investor is able to time both the precious metals, then the total returns will be ‘astronomically high’ in the future.
My timing ‘cycles’ provide signals both for the short-term and the long-term. The price action of both gold and silver along with my cycles have been showing VERY strong “Cycle Skew”, which I explain in detail in my book “Technical Trading Mastery”. This cycle skew is telling us that precious metals are now in a strong uptrend and is another confirming indicator that support much higher prices long term.
During the first half of a bull market trading price patterns and upside breakouts tend to work very well. Because interest in the sector is growing and more buyers continue to enter that market, price pattern breakouts are the last chance to get a position before price has its next rally higher.
I will continue to inform my subscribers of new swing trades, and even more importantly the long-term investing Set-It-And-Forget-It ETF trades to ride out the new bull and bear markets for massive profits.
I was recently looking at the CNN money website where they post this fear & green index. I caught my attention because many other aspects of the market are now also showing signs an imminent correction in the stock market.
This analysis is a contrarians play, meaning you believe that when mass majority of market participants are thinking and doing the same thing, you believe the market is about to change direction.
Let me share with you a few data points that are screaming that the masses are overly bullish and on stocks, buying shares like they know what they are doing, and have no fear of stocks dropping in value.
Take a look at the fear & green index below from CNN money.
Notice the current level “Extreme Greed”, and also the chart below showing the historical data. Its trading up near record levels and there is only one way to go from here – down!
What will change these participant’s minds? Well, they need to see stock prices fall fast and hard and for the crap to get scared out of them before they change their line of thinking
The total put/call ratio is something you may follow. I used to follow it, but now just focus on during what I feel is a critical turning point in the stock market, like right now.
This is a messy/noisy chart but the important thing to get out of this is that the black line that is down at extreme lows tells us everyone is betting and leveraging their money in anticipation of higher stock prices. There is a delay from when we see low reads like this till the market tops and that time looks to be any day now.
The red line on this chart is of the SP500 index, which will fall in value once this last bit of upward momentum stalls out.
The volatility index is trading near long term lows and “when the vix is low, its time to go”, as the old saying says.
Below is not a chart of the vix but rather of a VIX ETF symbol VXX. I talked about this recently in a trading analysis video for subscribers of my ETF newsletter.
Long story short, you will should see the repeating price pattern that takes place. Because of the way VIX ETFs are built they naturally lose value over time, but that is not the point here. In fact, because of the natural price decay of this ETF it clearly exaggerates this repeating price pattern in the VIX would is very difficult to see without the exaggeration of price decay.
Conclusion to Greed, Volatility, and the Put/Call Ratio:
What does this chart point to? Well, keep in mind this is the WEEKLY chart. But in short, we should expect a BIG spike up in the VIX shortly and a sharp decline in stock prices.
There are many different ways one can play this next move. In one of my next article I will share with you a couple very interesting VIX ETF trading strategies for this next move.
The current overall SPX pattern is a broadening top, which is usually a very reliable pattern. The market continues to look as though it wants to go even lower. The momentum shift, which I have been expecting, has been slow to start, however one should be prepared for this occurrence ahead of time.
Nevertheless, the large divergences which I have been viewing, in my proprietary oscillators, are most real, and, once the selling starts, the momentum should quickly move to the downside.
The current market is being supported by a lack of sellers more so than aggressive buying. With investors still thinking that there is no other place to store their money, they appear to be content with leaving their money with risk-on assets within a market that is pushing to all-time highs.
This type of mentality usually leads to large losses rather than big gains. There isn’t any real opportunity for growth in the SPX that I can see right now.
Dow Theory: Market Indexes Must Confirm Each Other
The Dow Theory was formulated from a series of Wall Street Journal editorials which were authored by Charles H. Dow from 1900 until the time of his death in 1902. These editorials reflected Dow’s beliefs regarding how the stock market behaved and how the market could be used to measure the health of the business environment.
Dow first used his theory to create the Dow Jones Industrial Index and the Dow Jones Rail Index (now Transportation Index), which were originally compiled by Dow for TheWall Street Journal. Dow created these indexes because he felt they were an accurate reflection of the business conditions within the economy, seeing as they covered two major economic segments: industrial and rail (transportation). While these indexes have changed, over the last 100 years, the theory still applies to current market indexes.
Market indexes must confirm one another. In other words, a major reversal from a bull or bear market cannot be signaled unless both indexes (generally the Dow Industrial and Transports Averages) are in agreement. Currently, THEY ARE DIVERGING,ISSUING A MAJOR NON-CONFIRMATION HIGH ON THE DOW JONES INDUSTRIAL AVERAGE. If one couples this with the volatility index (Fear Index), this is a warning sign and a recipe for disaster.
The FEDs’ monetary policy over the last eight years has led to unproductive and reckless corporate behavior. The chart below shows U.S. non-financials’ year-on-year change in net debt versus operating cash flow as measured by earnings before interest, tax, depreciation, and amortization (EBITA).
The growth in operating cash flow peaked five years ago and has turned negative year-over-year. Net debt has continued to rise, which is not good for companies.
This has never before occurred in the post-World War II period. In the cycle preceding the Great Recession, the peaks had been pretty much coincidental. Even during that cycle, they only diverged for two years, and by the time EBITA turned negative, year-over-year, as it has today, growth in net debt had been declining for over two years. Again, the current 5-year divergence is unprecedented in financial history!
Today, most of that debt is used for financial engineering, as opposed to productive investments. In 2012, buybacks and M&A were $1.25 trillion, while all R&D and office equipment spending were $1.55 trillion. As valuations rose, since that time, R&D and office equipment grew by only $250 billion, but financial engineering grew by $750 billion, or three times this!
You can only live on your seed corn for so long. Despite there being no increase in their interest costs while growing their net borrowing by $1.7 trillion, the profit shares of the corporate sector peaked in 2012. The corporate sector, today, is stuck in a vicious cycle of earnings manipulation management, questionable allocation of capital, low productivity, declining margins and growing debt levels.
Conclusion:
In short, I continue to pound on the table to help keep you and fellow investors aware that something bad, financially, is going to take place – huge events like the tech bubble, the housing collapse a few years back, and now national financial instability. Experts saw all these events coming months and, in some cases, years in advance.
Big things typically don’t happen fast, but once the momentum changes direction you better be ready for some life changing events and a change in the financial market place.
Follow my analysis in real-time, swing trades, and even my long-term investment positions so you can survive from the financial storm: www.TheGoldAndOilGuy.com
Comments Off on Will The Bubble Pop Regardless If the Fed Doesn’t Raise Rates?
Despite the expectations of a rate hike by the FED, in December of 2016, silver has remained close to its’ highs (as shown in the chart below). After a stellar run, the “white metal” is consolidating near its’ highs, while anticipating its’ next imminent breakout.
Along with investing in the “white metal” directly, investors should also use this consolidation in silver to look at the silver miners, which offer excellent returns during silver bull runs.
Supply and Demand for Silver:
“Industrial demand is set to increase, driven by rising incomes and growing penetration of technology in populous, developing nations, as well as new uses are being found for silver’s anti-bacterial and reflective properties in everything from hospital paints to Band-Aids to windows”, reports Bloomberg, who expects the industrial demand to surge within the next few years.
India and China will need approximately a billion smartphones and tablets by 2020. Demand for silver is expected to remain buoyant and demand will remain ahead of supply.
“Over the next ten or twenty years, more and more people are going to be using these devices, however silver is a very limited commodity. “There’s just not a lot of it around” according to Keith Neumeyer, CEO of First Majestic Silver Corp.
It is this that most likely is what led a major Japanese electronics player to First Majestic in attempts to secure its’ future silver supply, which is a sign of a tightening supply.
“For an electronics manufacturer to come directly to us- that tells me something is changing in the market; I think we’ll see three-digit silver,” said Neumeyer to Bloomberg.
The Solar industry is booming, as well. Solar power is taking over conventional power sources and that is good news for silver, as the solar industry is likely to consume more than 13% of the total silver demand in 2016. Similarly, ethylene oxide producers will also consume 25% more silver as compared to the previous year.
“Silver demand had a phenomenal 2015, with retail investment and jewelry fabrication both reaching all-time highs,” wrote Frank Holmes of US Global Investors in a post in early July 2016.
On the other hand, silver mine production is expected to drop for the first time since 2002 as mining production dips 5% during the current year.
Why invest in silver miners along with silver?
After having established that silver prices are likely to increase further, due to supply shortage and increased demand, let’s review the best possible mode of investment in silver so as to maximize our profits.
During silver bull markets, the silver miners are favored by the investors while their prices increase much more than the price of the “white metal”. As the cost of production remains the same, the miners gain huge profits when silver prices move up.
Hence, traders prefer the silver miners, once the next Elliott Wave count is confirmed. This is the reason for the sharp 170% run-up in the stock prices of Silver Wheaton (SLW), a “blue chip” silver-streaming company.
For every $1.00 increase in silver prices, the silver miner has increased by more than $3.00, which indicates that the silver miners are a better trade than the underlying metal.
However, when silver corrects, the silver miners tend to underperform the “white metal”. The silver miners behave as the leveraged plays of silver which are rising and falling far more than the underlying white metal is.
The Global X Silver Miners ETF (SIL) offers an excellent opportunity to the investors to enjoy the advantages of the silver miners with reduced risk, compared to owning single mining stocks. The ETF has seen a whopping rally from its’ lows of below $15.00 to the current price of $51.59.
Even after the phenomenal rise, the ETF is still well below its 2011 high of $94.00. (as shown in the chart below)
Traders can keep an eye on SIL to accumulate on dips.
Conclusion:
Silver has put a bottom in place and will continue to move even higher, in the coming months and years. In order to benefit from this rise, traders should keep an eye on the silver miners, which act as leveraged plays for the underlying ‘white metal’. With silver booming, silver miners’ prices will continue to skyrocket higher.
However, every rally faces corrections, hence, the right time to buy is when the “risk-reward” is favorable. Keep following my articles and analysis for the right time to enter this ETF.
Comments Off on Silver Miners Will Outperform In the Forthcoming Bull Run
My analysis indicates that gold will be implemented in order to protect ‘global purchasing power’ and to minimize losses during our upcoming periods of ‘market shock’. It serves as a high-quality, liquid asset to be used whereas selling other assets would cause losses. Central Banks of the world’s largest long-term investment portfolios use gold to mitigate portfolio risk, in this manner, and have been net buyers of gold since 2010.
Investors should make use of golds’ lack of ‘correlation’ with other assets which makes it the best hedge against currency risk. Last May of 2016, there was a huge trend change in U.S. gold investment as the Swiss exported a record amount of gold to the United States. There has been a huge increase in gold flows into the Global Gold ETFs & Funds. Something seriously changed, in May of 2016, as the Swiss exported more gold to the U.S. within one month than they have done so over the last year.
Gold has a “clear presence” to play in a world dominated
with ‘global economic uncertainty”
Despite the fact that we are in for a period of great financial turmoil, investors can safeguard themselves by investing wisely in gold. Do not be left behind and witness your dollar assets losing their value.
It is in these very conditions that gold (precious metals) is the only investment that will appreciate in value over time. Gold will continue to perform its’ role as a “safe haven” during these times of crisis which currently appear to be never ending. The metals surge of as much as 8.1% on the day of the “Brexit” vote, last month, is an indicator that its’ luster of safety is undimmed in the current markets. There is little to be gained from arguing whether such beliefs are right or wrong: Governments, around the globe, have moved to a new stage of desperation by toying with the idea of “helicopter money”.
It is my belief that since “Brexit” occurred, it could unleash a general exodus and the disintegration of the European Union is now almost unavoidable.
The list of prominent Hedge Fund Managers who are investing in gold is growing. Paul Singer, of Elliott Management Corporation, is the latest name to lend his support. It is likely that more investment institutions will turn to gold as the logical solution to countervail the effects of many years of ‘quantitative easing”.
Gold has been traded for over 5,000 years and for the first time has a positive carry in many parts of the globe as bankers are now experimenting with the absurd notion of negative interest rates. Some regard it as a precious metal while I regard it as a currency!
Soros Fund Management LLC, which manages $30 billion for Mr. Soros and his family, sold stocks and bought gold and shares of gold miners whilst anticipating weakness in various markets. Investors view gold as a ‘safe haven’, during times of turmoil but they tend to be late to the game as they don’t buy gold until there truly is turmoil and gold will have already appreciated substantially at that point.
“It’s a glaring warning sign of deflation. We’ve never really had deflationary fears throughout such a widespread part of the world before,” said Phil Camporeale, a Multi-Asset Specialist at JPMorgan Asset Management.
The FED is doing everything in its’ power to prevent a rise in the dollar. They are willing to “orchestrate” any scenario so as the stock market will continue to soar and people will feel a “wealth effect” from new stock market highs while the others are experiencing the economy “contracting”. The FED is getting everything it wants, in this regard, and will continue to do so as their number one priority is “debasing” the U.S. Dollar.
As the U.S. Dollar falls from all of the FEDs’ QE, it will lift up gold prices tounprecedented highs.
Investors of all levels of experience are attracted to gold as a solid, tangible and long-term “store of value” that historically has moved independently of other assets classes.
Golds’ importance, even in today’s environment, was clearly visible during the massive rally at the start of the year, when all other asset classes were tanking. Investors piled into gold on the scare of an imminent global financial reset.
Investors should make use of golds’ lack of ‘correlation’ with other assets which makes it the best hedge against currency risk.
Does Gold Continue Its Bull Market Towards $1500.00?
Conclusion:
The trend for ETFs to pile in to the precious metal sent the price of gold soaring by 25% in H1, the biggest price rise since 1980. For the first time ever, investment, rather than jewelry, was the largest component of gold demand for two consecutive quarters.
There will be another great opportunity in gold, silver and especially miners in the near future which followers of my work will benefit from.
Comments Off on Its The Season For Gold, Silver & Mining Stocks
The Gallup Poll has released an Economic Confidence Index which reflects the sentiment of Americans, as it pertains to the economy.
As the stock market makes new record highs and the housing “bubble” market soars, one would expect that the “average” American would be smiling from ear to ear. However, the chart below appears to present nothing but gloom and doom. The Gallup Polls results are dumbfounding the American public as to why this divergence has occurred. I feel we have touched upon a few points as to why this is occurring.
Firstly, half of all Americans do not even own one stock. Secondly, there are many US companies making large profits overseas. That may be positive for the company but that does not necessarily translate into a better financial position for mainstream Americans.
A survey was recently released showing that 62 percent of Americans do not even have $1,000 in their savings accounts. Most Americans are only one small emergency expense away from being on the streets. What this means is that many will simply rely on credit cards, friends and/or family for their funding, should a financial emergency arise. Is this meant to be our economic recovery?
How much do Americans save?
Housing values, which are being “artificially” inflated, only prevent Americans from purchasing their ‘dream homes’, as is reflected in low homeownership rates.
The housing market is once again too expensive for most American families to afford. During the last housing “bubble”, many Americans were able to partake in the mania and enjoy equity gains although they were fleeting.
This time around, most of the gains are going to investors and large institutional buyers that have crowded out mainstream America. This is a first in history to occur…at least on this large of a scale. The homeownership rate is the lowest in a generation as many young Americans are saddled with unsurmountable student loans — and consequently forced to return to living at home.
Inflated home prices coupled with decreasing incomes provide a recipe for disaster! Once again total wealth in the US is at a record high level. However, most of the gains are in the hands of a very few.
Americans are angry with the “establishment” – and are frustrated with their economic uncertainty
The stock market is fully “decoupled” as to how good Americans are doing overall.
The SPX is up a stunning 220% since the lows that were reached in 2009. Moreover, the US Economic Confidence Index shows more people simply do not trust the economic numbers and media.
Concluding Thoughts
I continue to warn about a down turn in both the economy and stock market. The markets continue to mature. Moreover, the leading indicators point to a sharp correction in the financial systems in the coming months.
Safe haven investments have rocketed higher like bonds, gold, silver, mining stocks as smart money positions itself in preparation for a crisis. As I have mentioned many times already, it is just going to take one bad event or piece of data to cause the tipping point for the market. The question is when and what will it be?
Just like the 2008 bear market in stocks and financial down turn, this will be no different in terms of what will happen. It will be just like every previous bear market/financial down turn. Stock prices will fall, people will lose their jobs, companies go bankrupt…and housing defaults increase as personal spending comes to a grinding halt.
When it comes to our investment and trading capital, you can either ride the financial rollercoaster and do nothing, move to cash with some safe haven investments like bonds/precious metals, or bet against the US economy and watch your net worth reach new highs during a time when everyone you know is losing money, jobs and confidence.
Comments Off on Economic Confidence Index Plunges While Stock Market Makes Record Highs
As you know a picture is worth 1000 words so consider this short yet detailed post a juicy 2000+ word report on the current state of the stock market and economic cycle.
The charts below I think will help you see where the US stock market and economic cycles appear to be.
The first image shows two cycles, the blue one is the stock market cycle and which sectors typically outperform during specific times within the cycle. Here you will see that during the late stages of a bull market the safe haven plays become the preferred choice for investors – Energy and Precious Metals.
Typically, the stock market tops before the economic (business) cycle does. Why? Because investors can see sales starting to slow and that earnings will start to weaken and share prices will fall, so the market participants start selling shares before the masses see and hear about a weakening economy. The stock market usually moves 3-9 months before the economic cycle change I known by the masses.
Stock Market Topping According to Sector Analysis
Elliott Wave Count – My Educated Guess
Elliott wave theory is a tough strategy to follow. Meaning, if you gave the same chart to 5 different people you would likely have 3 or 5 very different wave counts.
Recently I have seen a flurry of EW charts on the SP500 wave count which I do not think are correct. When I do Elliott Wave counts I like to use more than just price. I look into things deeper and use the market internals, volume flows, and overall market sentiment during those times. They must all be screaming extreme FEAR in the market in order for me to count it as a wave low.
Fear is much easier to read and time than greed. So based on waves of fear and I can plot the rest of the waves. By doing this, I feel it gives a truer reading of significant highs and lows we should use in our analysis.
See my analysis below for a visual…
Stock Market & Economic Cycle Conclusion:
In short, the current market analysis, in my opinion, is still very bearish and this could actually be the ultimate last opportunity to get short the market near the highs before we dive into a full blown bear market in the next 3-5 months.
I will admit, the market is trying VERY hard to convince us it wants to go higher as it flirts with the recent highs for its second time in the past 8 months. I know it is doing its job because so many traders and investors are changing their tune from bearish to SUPER BULLISH.
I don’t see it that way JUST yet, but it could happen as the market can do and will do whatever it wants. But all my analysis (much more than what you see here) points to substantially lower prices over the next year.
Comments Off on Stock Market Elliott Wave Count, Economic Cycle and Equities Cycle
We are approaching the most anticipated and crucial week of the past seven years, and the global markets have been selling off. Last week, saw crude oil, junk bonds and the stock market competing with one another, while on their way down. Is there a connection between the three, or is it just a co-incidence that all three have fallen concurrently? Is the fall of one market, signaling a warning sign to the other(s)?
If you have any interest in either market, by way of investments, or if you are planning to become a part of the market, this article is for you. The junk bond markets are flashing a red signal, therefore, you should heed the warning.
What are junk bonds and why are they important?
The bonds issued by companies, which have a low credit rating, are termed as “junk bonds”. Due to their weak balance sheet and their dubious track record, these companies are considered risky. So why would anyone invest in this instrument? With the Fed keeping interest rates near a zero level, for the past seven years, the hunger for higher returns have led many to invest in the “junk bonds” (which offer very high returns compared to the treasury bills).
What is the size of the bond market?
The total bonds issued, since the last financial crisis, have now crossed $9.3 trillion. Yes, you read correctly; it is a trillion with a ‘T’. The bonds issued in 2014, reached a record level at $1.3 trillion and the year 2015 has created another new record. According to the Financial Times, 50% of the bonds issued by the corporate world, are rated as “junk”, (this figure was at 40% during the 2007 financial crisis).
What is corporate America doing with such massive debts?
Has all this massive debt incurred by companies, been used for infrastructure, R & D, upgrade technology or for improved businesses? No! Most of the debt has rolled back into the stock market, in the form of buybacks and dividends. According to Bloomberg news, 104% of the profits earned by the companies in the S&P 500 were used for buybacks or dividends during the first quarter of 2015. Surprised? Don’t be. They went on to say that the last time the figure crossed 100%, was in the second quarter of 2007 and it peaked at 156%, two quarters later. We all know what happened to the stock markets after 2008.
Is it different this time, and will the companies return the money?
If you think so then you are in for surprises, if you think so. According to S&P, the 12-month default rate on junk bonds was at 2.5% in September 2015, up from 1.4% in July 2014. The S&P has downgraded 297 companies within the first three-quarters of this year and upgraded only 172 companies. The rate of the downgrades are the worst since 2009.
According to Bloomberg, the profits of the S&P 500 companies have fallen by $25 billion in the first three quarters of this year. On a share-weighted basis, the profits were down 3.3% on the year in the third quarter (the worst performance since 2009). The fourth quarter earnings are expected to be down by 5%, which will make it three consecutive quarters of negative earnings growth, this year. Aggregate revenues of the group were down by $287 Billion over last year. 17% of all the junk bonds are held by the companies within the energy sector, and with crude oil prices threatening to break the 2009 lows, it is anybody’s guess as to how many of these companies will be able to honor their payments.
The FED is set to raise interest rates in the coming week!
The FED is most likely going to raise rates, for the first time, in almost a decade. The yields on the short end of the market have begun to react and are at their highest level since 2009. With interest rates set to rise, many investors are likely to pile up on the investment grade bonds, rather than remain in the “risky ones”.
Difference in yields between investment grade and junk bonds
The below chart shows the difference in yields between the treasury securities and the dollar-denominated “junk bonds” issued in the US. The spread which reached a low in June of 2014 has been rising consistently, and has reached its highest level since 2012, at 6.71%. It is threatening to close the gap of the highs seen during the 2011 European crisis.
The next chart, shows the movement of the yields, since 1996. It can be seen that barring the last time, whenever we crossed 7.5% levels, the US experienced a recession, as denoted by the shaded area in the graph. In 2011, the US Fed was injecting large amounts of QE into the markets, which helped, but with the US Fed expected to hike rates in the coming week, the picture looks bleak.
Frightened? Do you want to redeem your investment in the “junk bonds”?
The investors of the Third Avenue Focused Credit Fund, also wanted their money back, but the Third Avenue Management “blocked” investors from withdrawing their money and has announced the liquidation of the fund. The investors will now receive a cash distribution on December 16th, 2015, and periodic distributions from the liquidating trust, over the course of the next year.
The Wall Street Journal reported that a few hedge funds are also following the same path as Third Avenue Focused Credit Fund. Hedge-fund firm, Stone Lion Capital Partners, L.P, Caryle Group LP’s and Claren Roan Asset Management, LLC have all taken a similar action and have suspended redemptions. SPDR Barclays High Yield Bond ETF (JNK) is at 2009 levels
The chart below speaks for itself. The drop on the right side, shows the rate at which the ETF has been falling. It’s close to its July 2009 levels, the closing on Friday marked by the red line, on the chart, is very close to the final support marked with the blue horizontal line. Below this support, we will likely see a retest of the lows of 2009.
The next chart, shows a comparison between the ETF and SPY. There has been a long-term divergence during the rise of the stock markets, but the similarity of the fall in both the SPY and JNK can be seen on the left hand side. This indicates that the stock markets have a long way to fall and in order to close the gap between the two. The findings of the chart do not bode well, for the stock markets, in the coming months.
Conclusion:
The large drop in JNK to 2009 levels has the markets in a state of fear and panic. With the FED likely to raise rates this week, the markets look to be on shakey ground. With the makings of the bond market, which is considered to be a precursor to a stock market top which seems to be in place. The path of least resistance of the stock markets is down. To all investors who are planning to buy this drop, Think twice! This is not a “Buy the Bounce Event”.
Comments Off on The Crash of junk bonds is indicating something that has yet to happen in the stock market!
The newest addition of the Bureau of lies’ newest falsified and manipulated document about the employment figures is now out, available for viewing of the ignorant masses. The makers of the report will make sure that they drum it up for the whole world to hear, so that their plans of treachery and deceit stay well on course. Even the mature financial minds at Wall Street will accept it, because they are always in search of positive news to help their financial interests in the market.
TV screens and websites are being used as tools for this grand manipulation with both flashing news that ultimately adds up to one big lie. Here is what the headlines on television and websites read:
“The US Economy Added 173,000 Jobs in August Alone
The US’s Unemployment Rate Falls To 5.1%”
Has anybody noticed? It’s rather unfortunate that the majority of Americans are busy making sense of their latest iGadget, frantically looking to make up their roster at fantasy football, or have just been a victim of the so called Public Education System. They are simply unable (or unwilling) to understand how only 173,000 jobs could decrease the unemployment rate so drastically.
How did this happen then? Well it’s pure and simple, the Bureau of Labor Statistics looks to have blatantly lied. How they do it, they tell the general public who are experiencing unemployment first hand that they (hundreds and thousands of Ordinary Americans) no longer need to work. Convincing many of them that they have enough in their lives with finances that they can live off their assets for the rest of their lives. This all comes down to one word, deception, pure and simple.
Why do they do it, well it is simple, Jean Claude Juncker said to those who are struggling and to our US congressman and politicians, which all have seemingly taken it to heart. He said:
“When The Going Gets Tough, You Have To Lie”
Unmasking the Truth
If the Bureau of Labor Statistics really believes that the unemployment rate at the moment is at 5.1%, which they proudly are declaring the lowest since April 2008, why is the interest rate kept at 0% by the Federal Reserve? The Federal discount rate in April 2008 was 2.5% and the economy was only growing at a paltry, 2%. If their numbers are to be believed, the growth of the economy today is 3.7%. If that was the case, the Federal Reserve’s wouldn’t have kept an emergency level interest rate going.
The Survey done by the establishment shows that there were only 173,000 Jobs added in the month of August. But, you won’t be hearing CNBC or Fox telling you that the total number of fake guess birthdates created on spreadsheets only in the month of August was 111,000. We can talk about this in a future article though…
So there have been hundreds and thousands of jobs created, at least that is what they say. That would mean new businesses opening, and old ones flourishing, but the number of businesses closing down is higher than the number of businesses opening which does not jive with the strong growth numbers they are reporting. But the Bureau of Labor Statistics (BLS) does not work with reality that is visible on ground; it continues to make use of the historical data to predict jobs being created.
The reality is far, far from what is being told to you through the media. Instead of creation of 173,000 jobs, 111,000 have been created as hoax, not existing in reality and another 50,000 jobs are being closed as a result of scores of small businesses closing down each month. If the BLS had tried to be truthful, it would have outlined that the total number of jobs that have been produced amounts to near zero.
Unemployment Rate Down By So Much…Really?
The government wants you to believe that the state of the country’s economy is taking a turn for the better. That riches in the economy are so abundantly available that 1.5 million Americans have decided to voluntarily drop out of the workforce. And while that was happening, 835,000 American have got jobs, which have brought the unemployment rate down by 0.6% from 5.7% to 5.1%.
And to put it politely, and to sum up the discussion, the number of people in the US that are receiving food stamps is a whopping 45.5 million. I find this number insanely huge. That is like all of Canada’s population plus another 50% with no job, no money, and a bleak future. Scary stuff and worse part is that this number continues to climb.
I think the crash of the US economy is in sight and with all due credit to the Federal Reserve. The more they artificially support the market the harder the crash will be.
Within the United States, the US Federal government and the US Federal Reserve Bank interventions have failed. These manipulations, by the central bank, in order to maintain the current stock bubble, and the real estate bubble, are currently reflecting the acts of failed monetary and fiscal policies, as we are presently experiencing.
The reality is that the US economy has already been in contraction for many years now.
The government intervention is failing in Europe, Japan, and now apparently also in China. Government interventions globally are currently becoming more vulnerable The US, Europe, Japan, and China have all been experiencing failures. We are currently witnessing the results of total failures, right under our noses. I believe, we are closer to that point of the Global Financial Meltdown than anyone else may realize. This collapse in China is a major shock, which has triggered a major market sell off within the US markets.
Over $2 trillion has been lost in the U.S. market alone within the past week of August 24th through August 28th, 2015. Globally, I estimate $5 trillion has been lost, in total, during the same time period. A domino effect has been caused by affecting economies globally rippling all simultaneously.
We are currently deal with the unspoken deflation problem. Commodities prices and oil are down sharply the past year. No major economy looks even close to true real expansion.
What is taking place right now, in the stock market, is just a precursor for what is about to happen, shortly. This is my view of foreseeing a pre-crash, and I believe that we should all be aware that this is looks to be the “real deal” and could occur take hold in more serious way before the end of October. This seems to be a bubble of historical proportion. Raising interest rates today is impossible because the market is way too fragile, at present.
We are experiencing times, as we have never before experienced in our life time. This will cause us to experience a major shift with in our culture, our civilization, our social lives and our belief systems to some extent.
The rally in gold is going to be stupendous. Gold will be the strongest currency in our future or at least for a few years as the Great Financial Reset takes place. The SDR (Special Drawing Rights) in which, I have written about in past articles, is nothing more than an index of currencies. In 2015, it will not be able to provide liquidity within the global markets, as it provided during the 2008 bear market.
The stock market has been experiencing a technical oversold rebound following its steep drop. Major damage has been done, and the stock market clearly remains BEARISH. The stock market decline was so extreme, that stocks rose as they” backed and filled” last week. When this volatility is over, the situation will become even graver, as the bear market will stay in force for many months to come.
The Fed’s role, as the custodian of the world’s reserve currency has ultimately failed, as it has ignored its responsibility to the World. Bond-buying has allowed the U.S. to levitate asset values, even though it has failed to stimulate the real economy.
There are currently over $500 Trillion in interest rate derivatives. THEREFORE, how can the FED ever be expected to raise interest rates in a meaningful way? I don’t believe they can! I see the FED currently working on QE 4 into Infinity!!
Legitimate buyers of US Treasury Bonds have largely vanished. There has been a huge decline in official bond holdings and purchases by our typical traditional former allies; China, Russia, Japan and the BRIC countries have actually turned into net “sellers” of US Treasuries since 2011. This created what could have been a huge financial disaster for the Federal Reserve, to whom they were selling large amounts of US Government securities, in order, to absorb the excesses in the market place.
They continued to expand their largest and most secretive Ponzi scheme, in history, to include Belgium, Luxembourg, Ireland, The Cayman Islands, and Switzerland. The US Fed is using currency swap arrangements to secretly serve as a backstop liquidity facility, with the above mentioned countries. QE is being exported through a secretive global integration process by using several front offices, which are under their control. It involves permanent reciprocal currency arrangements, whereby these foreign central banks have been given large lines of credit, by the US Federal Reserve Bank, in order that they can purchase US Treasuries. The manipulation of the central banks of Belgium, Luxembourg, Ireland, The Cayman Islands, and Switzerland have been used to keep these purchases off of the balance sheet of the US Federal Reserve Bank. These manipulations have been a new proxy entity that have been designed, solely for this purpose. This undisclosed “systemic risk” is being spread to secondary nations, without the benefit of knowledge to the general investing public, throughout the Financial World. This will come to be known, as what I believe to be, the Greatest Fraud perpetrated on the American public taxpayers. It will be the systemic failure that will totally bring down our current existing global financial system.
Central banks around the world have entered into a multitude of bilateral currency swap agreements with one another since the financial crisis of 2007. These agreements allow a central bank in one country to exchange currency, its domestic currency, for a certain amount of foreign currency. The recipient central bank can then lend this foreign currency on to its domestic banks, on its own terms and at its own risk. Swaps involving the U.S. Federal Reserve were the most important of all the cross-border policy responses to the crisis, helping to alleviate potentially devastating dollar funding problems among non-U.S. banks.
The swaps have been used by central banks to obtain foreign currency to boost reserves and to lend on to domestic banks and corporations. These swap agreements are designed to protect both central banks involved due to fluctuations in currency values. There is risk that a central bank will refuse or be unable to honor the terms of the agreement. Currency swaps is a meaningful sign of trust between governments.
QE is not a stimulus, but rather a death sentence of the US Dollar. This will bring about the return to the “GOLD TRADING STANDARD”. With my Predictive Trend System Analytics, I shall immediately inform you as to when the bottoms of Gold and Silver have been CONFIRMED, at which time, you will be able to start purchasing these two precious metals, at historically low prices.
Quantitative Easing was implemented when the US Federal Government and the US Federal Reserve stepped in and manipulated monetary policies, in order for them to levitate asset values. This was to artificially increase asset prices and enhance the wealth effect. They were trying to postpone the inevitable crash that we are currently witnessing.
There has not been any economic growth since 2007. This perpetrated fraud will bring down the whole western financial system, and ensure its future devastating collapse. I currently envision the Petro- Gold and the new “Scheiss Dollar” to become a new vision.
Thus, the Global Currency Reset; the new “Scheiss Dollar” will be launched.
S&P 500 Monthly Chart – 7 Year Cycle
The SP500 index (US Stock Market) has now officially exited its up trend. It can be argued that the stock market is either in a stage 3 topping phase or a stage 4 decline. Either way, it’s not good for buy and hold investors.
The major trend line on the chart below has been broken in a big way. The AlgoTrades INNER-Market Analysis tell us to be sitting pretty in cash, or short the market so you can profit from falling prices over the next 6- 18 months.
I do fear a global economic collapse is possible which I talk about in our ETF Trading Newsletter – TheGoldAndOilGuy. In August we started investing in funds that will rise as the stock market falls in value. If you need help with this be sure to check out that newsletter.
S&P 500 Quarterly Chart – BIGGER PICTURE
This chart I feel provides a great perspective on the overall market trend and price patterns. This is the 70 year historical chart. I hope something like this unfolds. Fingers crossed to a nominal 12 month correction/bear market. This will build a new base for the next super cycle.
US Dollar has now reached the upper resistance trend line… we could see weakness in the dollar going forward… Keep in mind this is a quarterly chart, lower prices may still be a few months away.
Stock Market Rises with Fewer Stocks – RED FLAG
Since mid 2014 the US stock market has become move volatile. Fewer stocks participating in the markets move up. This can be seen by comparing the percent of stocks trading above their 200 day moving average and the S&P 500 index.
Last issue I stated “Once the stock market comes to a complete stall it will drop violently.”
What we saw from August 20 – 24th was the break of the bulls back… The market always has a way to keep average investors bullish and left holding the bag of overprices stocks when the music stops. The market could very well rally here and test recent highs or possibly make a new high to be sure investors remain bullish to buy into the next wave of distribution selling.
INNER-Investor Monthly Conclusion:
The months of July and August were incredible months for our automated trading systems as you can see from our recent results. The frustrating part is that it takes some time for us to move and integrate this improved system into the platform to trade everyone’s account. Our trading system has done incredibly well during on the toughest market conditions we have experienced in years, users of our system did not have these trades executed in their accounts as that starts/started on September 1st 2015. It is tough watching all this money being made day after day and the trades are not executed in our users accounts, but the good news is that our systems are live and trades will be executed in users accounts now!
The stock market typically falls 3-7 times faster than it rises, which means we can make more money, and make it faster during a falling market then we can make from a rising market. Now that the trend has turned down we should be off to the races with outsized trading gains once again.
The simple solution to profit from this market is to become a user of ourAutomated Trading System so these trades are executed for you, allowing you to enjoy the finer things in life like spending time with
Comments Off on The beginning of a new financial/stock market cycle
U.S. stocks closed lower Tuesday after a failed attempt to rally from the Dow’s worst 3-day point decline. It’s something I have not seen since the 2008 GLOBAL financial crisis.
The market had its first rally of the downtrend yesterday but it would be a BIG mistake to get bullish for new long-term investments at this point. The major trend is down. The odds favor that this is to be only the first phase of the decline. Today’s rally could take us to 1965 – 2040 level on the SP500. I will be taking short positions in the US markets soon.
GLD has retraced a good portion of its move to 112 as it almost printed 107.. GLD looks as if it is just starting a new downtrend looking for a count to 100/101. It is still intermediately CONFIRMED BEARISH. At this time, since we have new positions on, I prefer to wait till the metals hit bottom and its been CONFIRMED BULLISH before adding a new trade. Silver should have a nice pullback as well. SILVER has now turned Technical BEARISH today.
Please do not jump into the market before the time is up. As we are approaching the 7-year Jewish bear market cycle in the month of Tishrei (September-October), markets are destined to stay volatile. I will immediately inform you as to the turn date to short the US markets.
CURRENT SPX HEAT MAP
INTERNATIONAL MARKETS ALL CONFIRMED BEARISH !
In the last week-and-a-half, the S&P 500 lost nearly $2 trillion in market capitalization, with $900 billion in this week’s two trading sessions alone.
The Dow traveled another 1,600 points during Tuesday’s trading session which added to the 4,900 points the index traveled in down and up moves on Monday.
The SPX approached the low of the first phase of distribution. This is also working cycle wise. If there is a selling climax, I could see about 1830. This should be followed by a mid-decline rally to roughly 2000, about 50% of the decline from 2133 and my automated trading strategies has profited from this market crash. Should the cycle(s) interpretation be correct (bottom late September/early October), I could then work on the second phase of the correction which would take into account the next phase of distribution and its downside potential.
When investors first experienced the financial crisis that occurred back in 2008, they could not foresee that it would reoccur once again, now in 2015. Currently, we are experiencing the next “Great Depression”. I am referring to this specific period of time that is happening now, as the bursting of the “Asset Bubble”. The bursting of this “Asset Bubble” will be more devastating, over time, than the total damage that had occurred during the “Great Credit Crisis of 2008″. This will devastate and destroy what is presently left of our middle classes.
At the present time, we are witnessing the beginnings of the stock market crash of 2015 as discussed in my recent book. If you have been following my analysis of the global financial markets, which I have been extensively informing you of, you would have already been prepared for this occurrence, as early as November 25th, 2014. For my private clients, these major drops in the US Markets came to you as no great surprise, at all. My advice to said clients was precise, informative and accurate. The key to wait for confirmation before taking action when it comes to major trend changes like this.
I issued a FLASH ALERT back on August 5th, 2015 titled “Ugly Outlook – Global Economics, Quantitative Easing And Equities“. I stated that a large broad US Equity Decline may be ready to take place NOW! I also recently posted that there was a confirmation that the Dow Jones Industrial Average had ended its BULLISH rally, and therefore, had reached its “termination pattern”, which was BEARISH. We are now witnessing a classic case of an irrational financial bubble bursting.
Without any doubt, this is what I have been posting and sharing with you, for quite some time now. Our financial markets have been primed for this “crash”. The market’s gain and investment profits have now been eradicated for 2015 with this recent crash.
The Federal Reserve is now in uncharted waters. They are powerless and clueless as to what their next steps should be. They currently lack the knowledge and tools, at this point, to stop the severe continuing contraction within our economy. They have kept interest rates at 0% for far too many years. I fear that our economy could start experiencing interest rates in the negative territory which has already occurred in Europe.
The VIX is a gauge of FEAR. The break out of the Volatility Index (VIX) above 53, on August 24th, 2015, is a MAJOR warning sign that the magnitude of our financial and economic troubles are just beginning. The majority of our problems are soon to be revealed thereby reflecting that we are in an “Economic Deflationary Depression”.
These markets are under heavy distribution with increased heavy volume. This is a sign that institutions are selling large blocks of stock.
Money managers are selling their existing stocks, and locking in their profits. This is not the same scenario which we have seen so many times in the past, in which one “Buying the dips” has been the normal pattern. Unfortunately, those days are now a distant memory, and the markets are not coming back in their roaring fashion, any time soon.
Comments Off on US & Canadian Stock Market Trend & Guidance


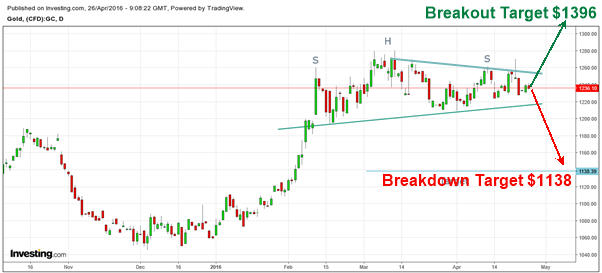
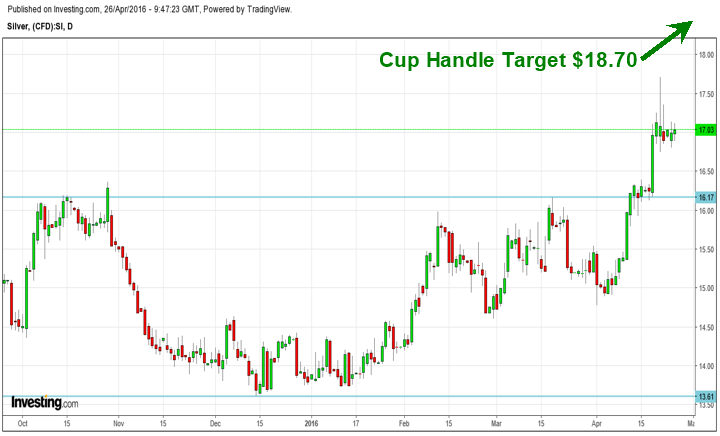
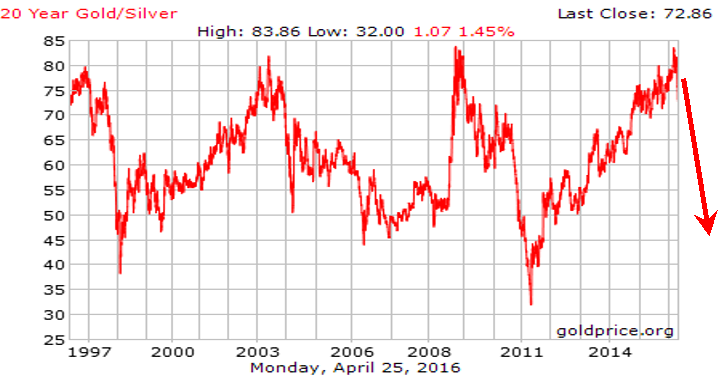
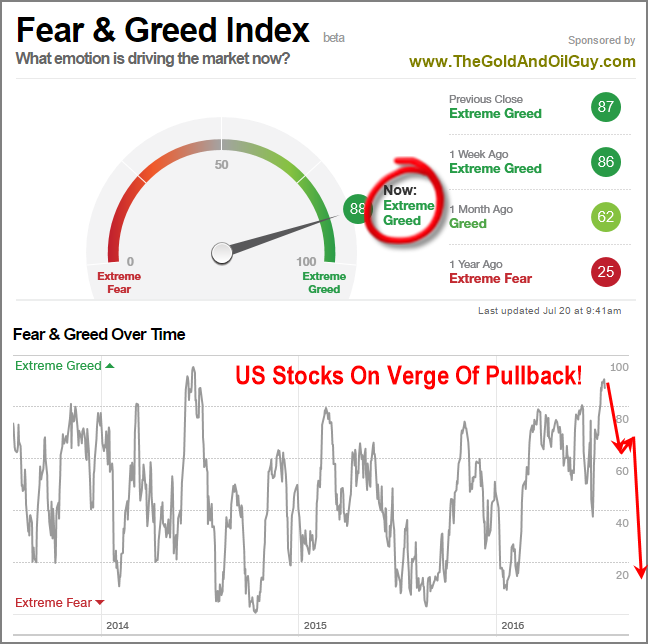
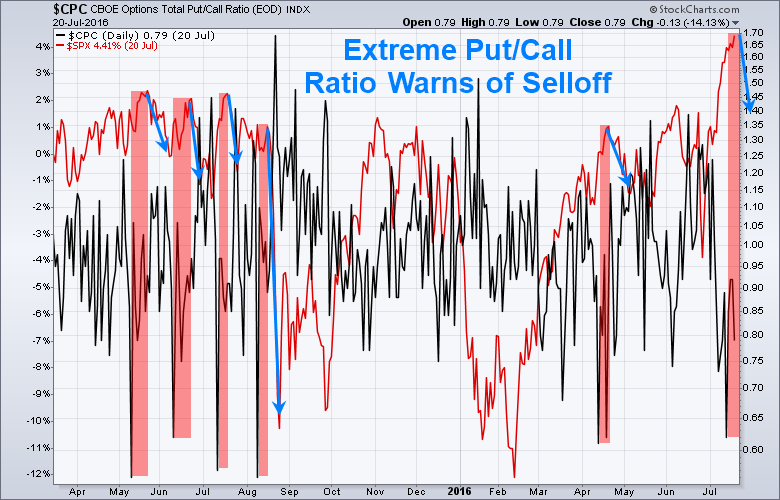
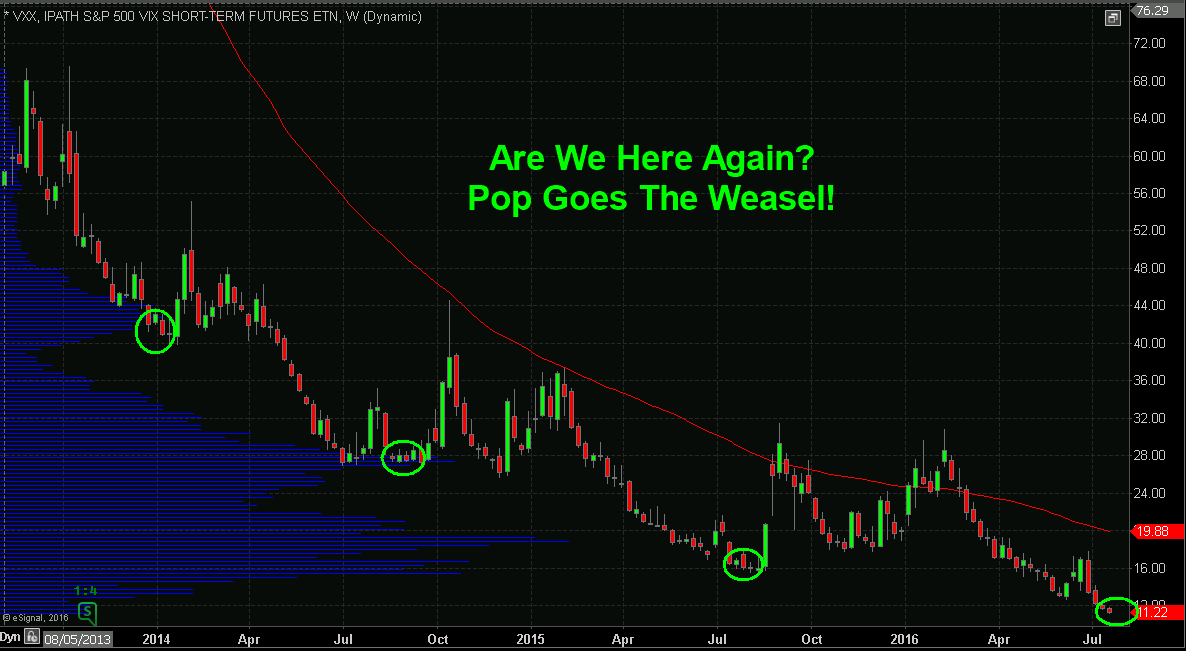


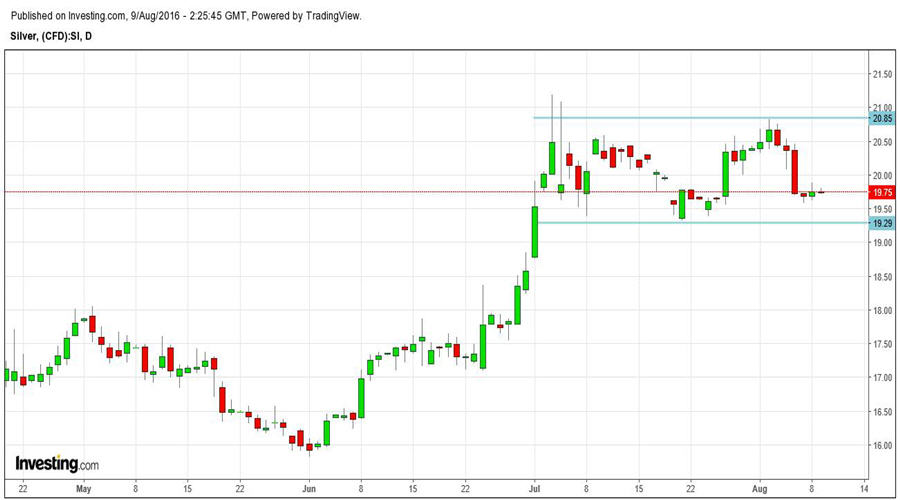
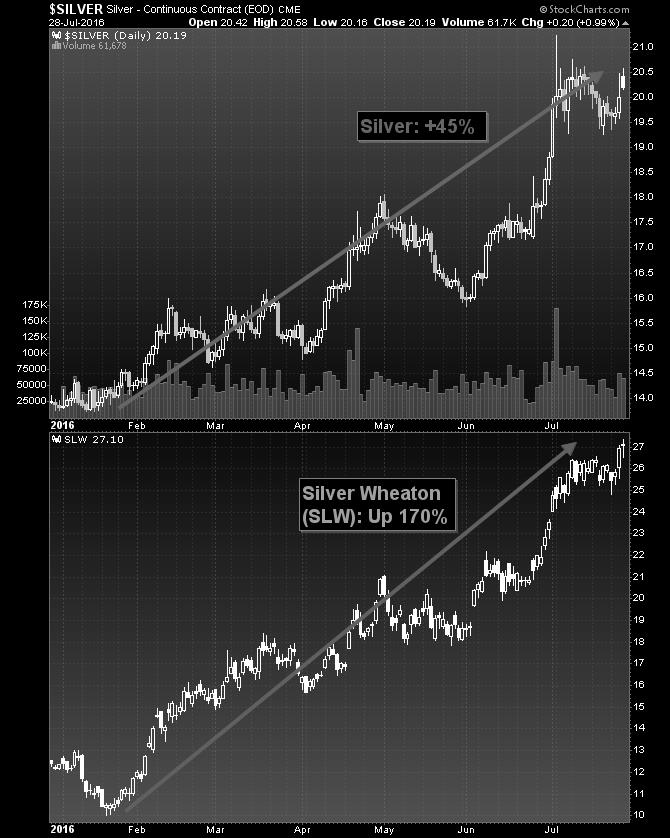
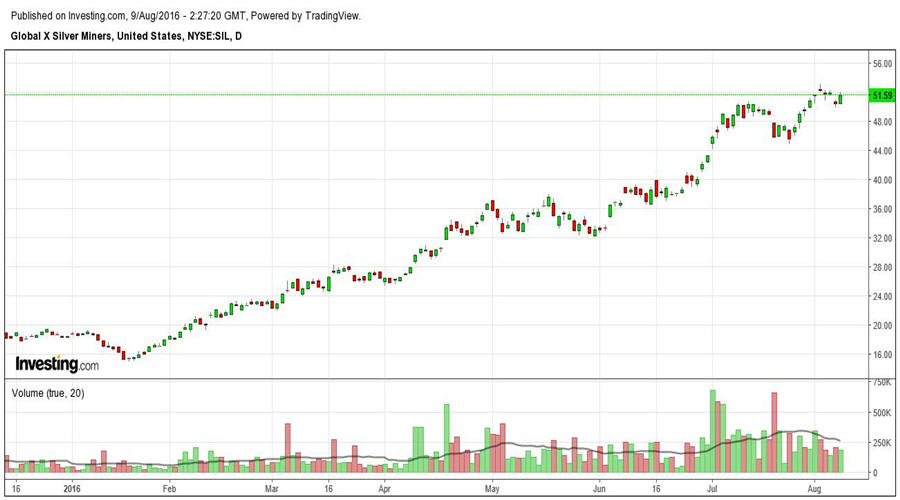
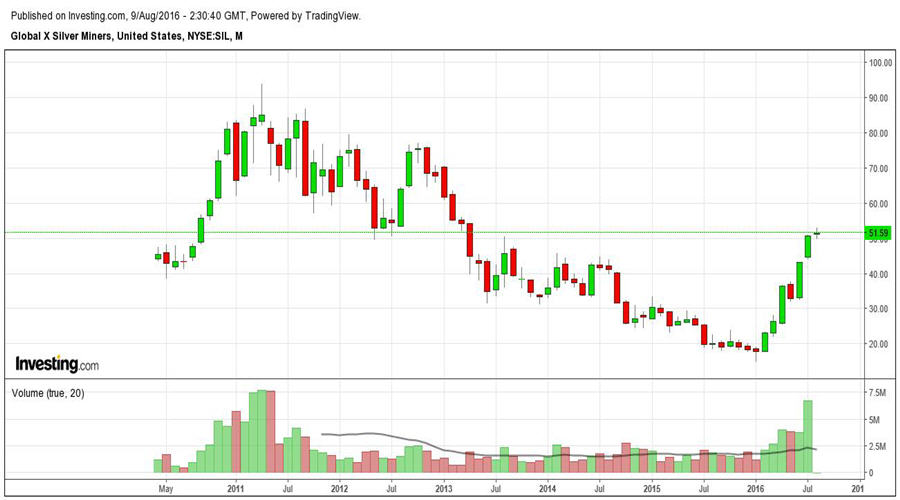


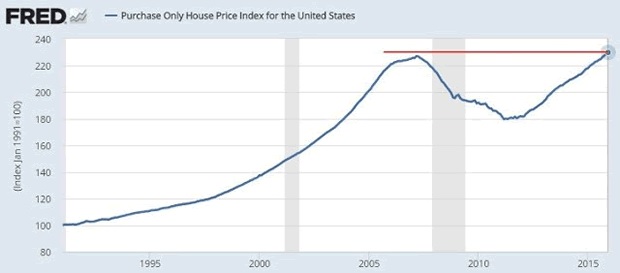
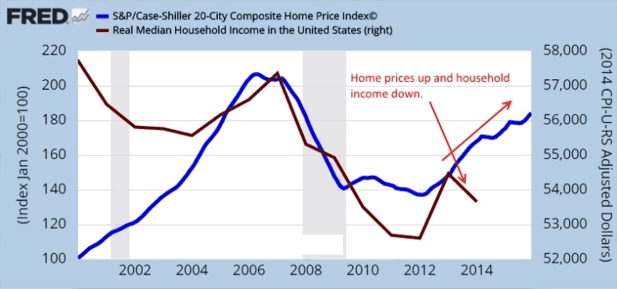

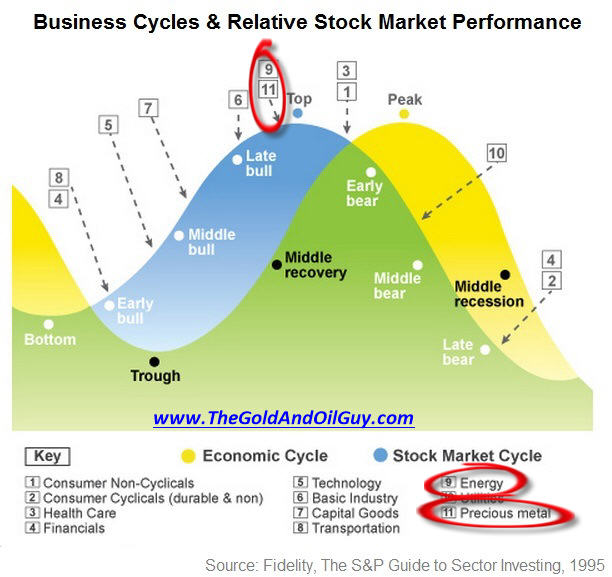
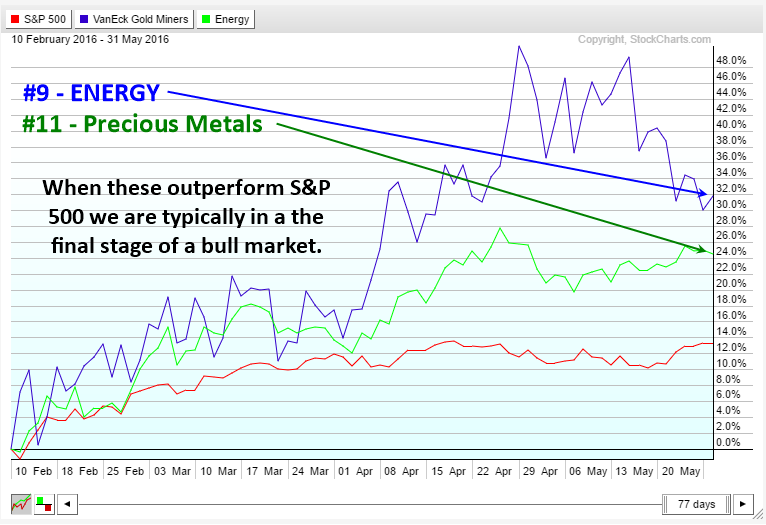
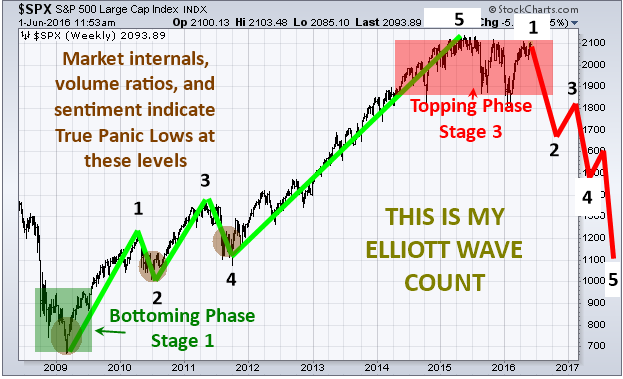

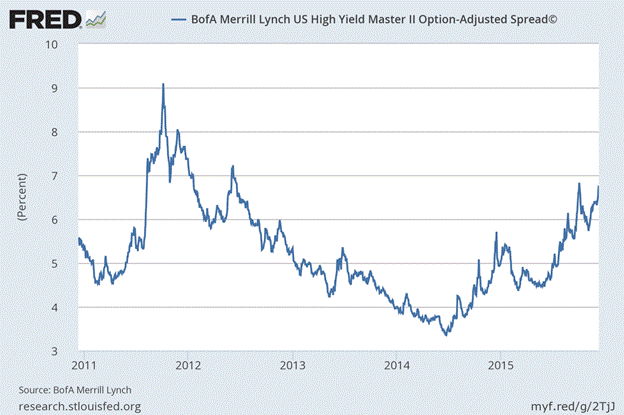
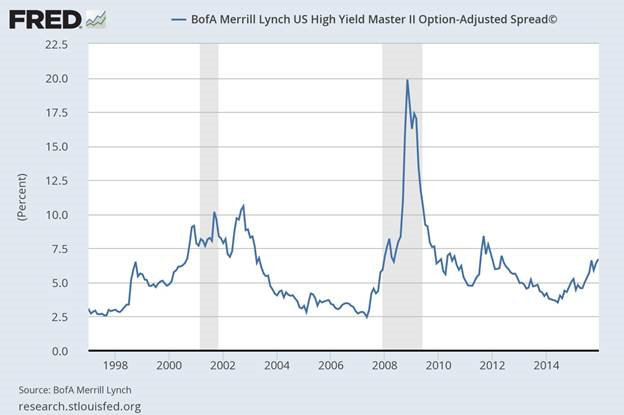
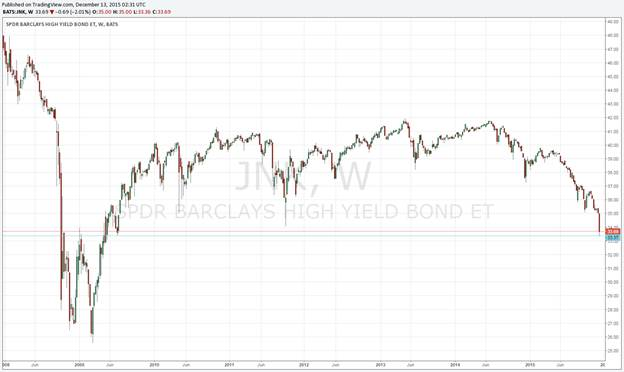
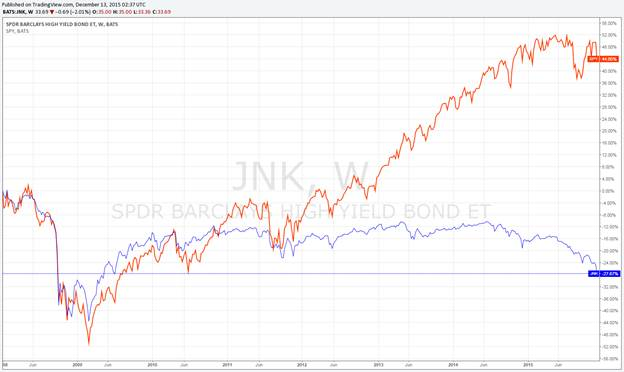


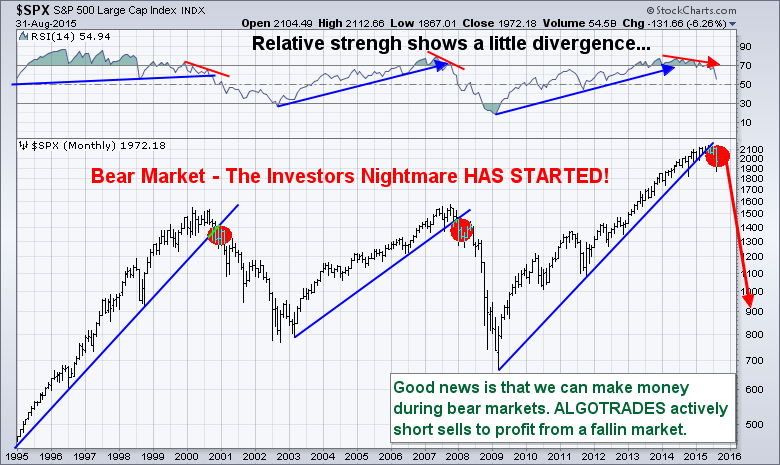
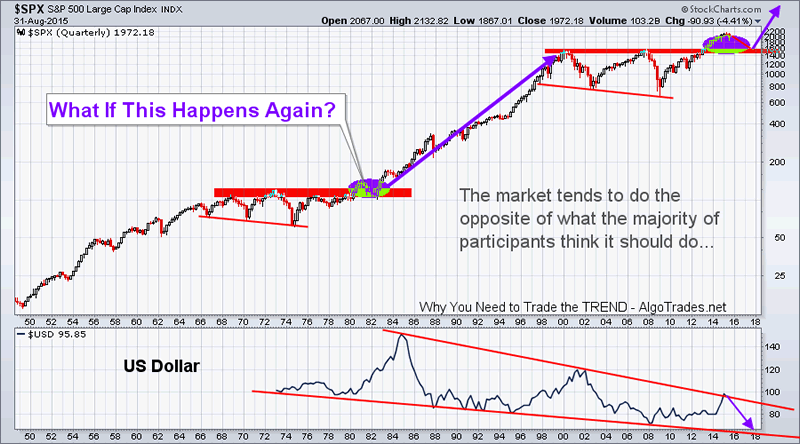
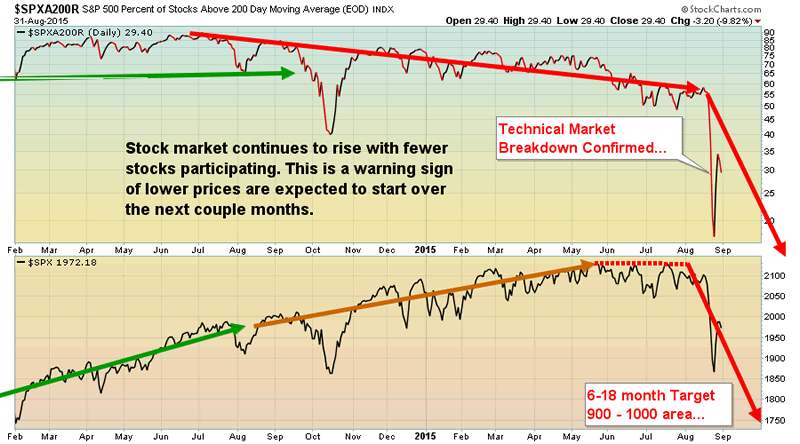


By Chris Vermeulen.
Have you ever been presented with an opportunity and missed out on it? Well, here is an opportunity you Do NOT want to miss out on.