
 World News
World Wide Experts
World News
World Wide Experts

 Harder Questions
Smarter Responses
Harder Questions
Smarter Responses


WASHINGTON, DC – Prospects for growth in global trade in 2016 and 2017 have been downgraded again. The World Trade Organization (WTO) nowexpects that trade this year will increase at its slowest pace since the post-2008 global recession. What is going on?
This is not purely a function of an anemic global economic recovery. After all, trade growth has typically outpaced GDP growth; in the years before the 2008 global financial crisis, the average increase was double that of output. But the ratio of trade growth to GDP growth has been falling since 2012, a trend that will culminate this year, with GDP growth outpacing trade growth for the first time in 15 years.
This reversal is driven partly by structural factors, including a plateau in the expansion of global value chains and a turning point in the process of structural transformation in China and other growth frontiers. The rising share of services in countries’ GDP likely implies further downward pressure on trade flows, given services’ lower trade propensity relative to manufactured goods.
But not all of the forces undermining trade are so long-term. Crisis-related, temporary, and potentially reversible factors have also had an impact. For example, the economic hardship faced since 2008 by many eurozone countries, which have traditionally accounted for a substantial share of global trade, has discouraged consumption, hiring, and much more. The weak recovery of fixed investment in advanced economies has also undermined trade, because investment goods involve more cross-border exchange than consumer goods do.
Perhaps most risky, however, is the growing political backlash against free trade, reflected in a lack of progress in recent rounds of trade liberalization and the implementation of protectionist non-tariff trade barriers. Though such creeping protectionism has not yet had a significant quantitative impacton trade, its emergence has become a major source of concern amid rising anti-globalization sentiment in the advanced economies.
Today’s trade bashing is what happens when economic concerns – including stagnating median incomes and, in some countries, high unemployment rates – turn political. Viewing economic dissatisfaction as an opportunity to win support some shrewd politicians, particularly in the advanced economies, have been pointing the finger at the nebulous, threatening forces of “globalization.” Immigration and trade, they claim, are the cause of citizens’ economic insecurity.
Exhibit A is the current presidential campaign in the United States, which has placed more emphasis on trade than any such campaign in the country’s recent history. In a difficult political environment, both Hillary Clinton and Donald Trump are proposing trade policies that depart from America’s long tradition of liberalization – with potentially dire economic implications.
Clinton, the Democratic candidate, now opposes the Trans-Pacific Partnership (TPP), a trade agreement that President Barack Obama’s administration negotiated with 11 other Pacific Rim countries and that is now awaiting ratification by the US Congress. She has also opposed conceding “market-economy status” to China, because it would make it harder to bring anti-dumping cases against the country. And she has advocated imposing countervailing duties on goods from countries that qualify as exchange-rate manipulators.
Trump, who has been among those leading the protectionist charge, takes these ideas much further. Like Clinton, he opposes the TPP and supports countervailing duties for currency manipulators. But he has also been particularly disparaging about Mexico and China, and is already calling for punitive US tariffs on both. Moreover, he promises to renegotiate and perhaps even abrogate existing trade agreements, alluding to the possibility of a US withdrawal from the WTO.
Clinton’s proposed measures would cause the US to lose out on some gains from trade, with consequences for the world economy. But the damage hardly compares to that which would be wrought by Trump’s proposals. After all, protectionist measures from the US would almost certainly spark reciprocal actions by its trade partners, potentially even spurring a trade war that compounds the economic pain for all.
As the Peterson Institute of International Economics highlighted last month, the negative impact would be felt most strongly by low-skill, low-income workers – precisely the people who are most convinced that less trade is a good thing. Worryingly, the report also shows that the US president has substantial leeway to adopt trade-curbing measures, without effective checks by Congress or the courts.
Obviously, there is a need to address the concerns that have fueled anti-globalization sentiment, politicians in the US and elsewhere should devise policies that will actually help their most vulnerable citizens. But demonizing trade is not the way to do it. On the contrary, as the experience in the 1930s showed, the easiest way to derail an already-feeble global economic recovery is to unleash a protectionist trade war.
Comments Off on Protectionist Creeps
Much has changed since Fidel Castro arrived in Cuba on the Granma yacht in 1956.
Not long ago Cuba and the United States reopened embassies in Washington and Havana for the first time in decades, marking a crucial step towards the normalization of relations. Yet, while much attention will be placed on these international developments, perhaps the most decisive changes for Cuba will be domestic.
Crippled by a US trade embargo since the 1960s, Cuba’s underperforming centralized economy has long been propped up by a series of generous “sugar daddies”, from Soviet Russia to chavista Venezuela.
But Soviet support collapsed with the Berlin Wall, and Caracas is running out of sugar. Havana may not be willing to give up on the revolution, but it cannot afford the status-quo.
On an island known for obstinacy, something has got to give.
Watch The Crossroads Cuba Videos! Pt.1 The Crossroads Cuba
While many Cubans welcome change, any transition faces daunting challenges. Can Cuba liberalize commerce without inviting the staggering inequality endemic to Latin America? And can the state relinquish total power without sacrificing high quality, free public services?
Since assuming power from his brother Fidel in 2006, Raul Castro has gently edged Cuba towards a more market-based economy. The partial liberalization of private enterprise, home ownership and foreign direct investment are all suggestive of an economy in transition.
Cuba has taken similarly measured steps in the political realm, as evidenced by diplomatic normalization with the US. Raúl Castro has indicated that he will retire at the conclusion of his current term in 2018, ceding the Presidency to 55-year-old Vice President Miguel Díaz-Canel.
A preordained handover of power falls far short of true democracy, but it is representative of a broader transition from Cuba’s aging revolutionaries to a new guard of younger, ideological but reform-minded leaders.
There have even been indications that the party may be willing to ever-so-slowly loosen its grip on political power. The Cuban government tolerates a degree of political activism. For example, in last April’s municipal elections, the government permitted two non-party candidates to run for office.
Some online activism is also permitted: bloggers such as Harold Cárdenas Lema ofCuba Joven and Yoani Sanchez of 14ymedio have openly questioned Cuban governance, albeit from very different perspectives. However, limited internet on the island significantly curtails the number of Cubans who can access these blogs.
Of course, public displays of dissent — among many other freedoms of expression — are still firmly prohibited.
Still, something is changing here. Raúl’s reforms have been slow and halting, but they are likely irreversible. Cuba is clearly experiencing a transition. But a transition to what? What’s the end game here?
Watch The Crossroads Cuba Pt. 2 The Economy
The Cuban Economy: More Money, New Problems
Cuba’s fundamental economic problem is a lack of productivity, particularly from a bloated public sector. In response, the government has implemented reforms designed to shed jobs from public roles, with the expectation that people will join an inchoate private sector.
In agricultural centers, for example, the government has granted farmers increased control over what they harvest and where they can sell their produce. While they still must deliver a majority percentage of their output to the government, they can now sell the remainder at a market price.
More recently, “cuenta propistas“ have created opportunities in the cities for private enterprise and nonagricultural co-ops, from the barber, to the tire repairman, to certain craft and souvenir shops.
The Cuban government appears comfortable with these private operations, with entrepreneurs reporting generally unfettered activity. If anything, some private business owners claim, their taxes produce an important revenue stream for the government.
But with a 21st-century economy comes 21st-century problems. A key concern with Cuba’s economic reforms is that not all Cubans can take advantage of them, and some fear that inequality could be widening.
Productivity suffers from decades of underinvestment in infrastructure, equipment and machinery. This inattention is not surprising given the government’s hostility to larger private enterprise, as well as its own lack of funding. International direct investment and credit is also constrained by the US embargo.
With limited credit options, putting together the start-up capital for a private business is difficult for those without access to remittances or tourist revenue. The Afro-Cuban community, for example, may particularly lack access.
Another distorting factor in Cuba’s economy is the awkward dual-currency system. Two types of currency are currently traded in Cuba, one worth significantly more than the other
The Convertible Peso (CUC), used for example in the tourist industry, is worth more than the dollar. The National Peso (CUP), the currency of state salaries, is worth about four cents.
The result is a widening gap between those earning in CUC and those earning in CUP. Given the marked disparity, taxying a tourist across town can gross about as much as a state employee makes in two weeks. This creates incentives pushing Cubans into any activity that generates a cash flow in convertible currency regardless of productivity.
Havana hopes to unify the regimes in the coming months, but this would not close the gap between those with access to tourism revenue and remittances, and those on state salaries.
Watch The Crossroads Cuba Pt. 3 The Cuban Way & The USA
Diplomatic Relations Are Just a Start
Cuba’s complicated domestic transition requires far more support than simply changing the title of a building on the Malecon from “US Interest Section” to “US Embassy”.
Bringing Cuba into the global financial system and allowing the island become a member of development institutions such as the World Bank or the Inter-American Development Bank would be an important step to start closing the investment deficit. Also, given these organizations’ experience in transition economies, it could help the country with the needed structural and institutional reforms while keeping poverty and inequality in check.
Such multilaterals relations would be an important start, but the US could also play a critical role in helping Cuban economy through this period.
No policy from Washington could assist more Cubans — and more effectively undermine Havana’s hard line — then to end the US’s longstanding trade embargo against the island. The US Congress maintains the economic embargo presumably as a punishment for the government’s civil rights violations against the Cuban people.
The irony is that the Cuban people are the ones most severely punished by the policy.
The Cuban transition will not be easy, and it will not happen overnight. But it has an exponentially greater chance of success if the United States joins the large group of countries that already supports Cuba’s transition through constructive engagement rather than embargo.
The Crossroads Overtime: Otaviano Canuto speaks with Samuel George on Cuba’s Transition
Otaviano Canuto is an Executive Director at the International Monetary Fund. All opinions expressed here are his own and do not represent those of the IMF or of those governments he represents at the IMF Board
Samuel George is the Latin America Project Manager for the Bertelsmann Foundation, author of The Pacific Pumas, and creator of The Crossroadsvideo series.
Cornelius Fleischhaker is a junior professional associate at the World Bank and co-author of Five Steps to Kickstart Brazil. All opinions expressed here are the authors’ own and do not necessarily reflect those of the World Bank.
NOTE: The videos in this text are a project of Samuel George and the Bertelsmann Foundation and do not reflect the views of co-authors Otaviano Canuto, Cornelius Fleischhaker, or their institutions.
Comments Off on Not Your Grandpa’s Cuba: A New Light in the Caribbean
Suriname is facing twin – external and fiscal – deficits that originated in the commodity price slump of recent years. In response, the Surinamese government started a four-pronged adjustment program in August 2015 to adapt to new circumstances.
On the back of favorable commodity prices and appropriate domestic policies, the Surinamese economy grew at an average rate of 5% per year – amongst the highest in the Western Hemisphere – in the period 2003-2012. However, like other small commodity-dependent developing economies, Suriname has faced negative growth, external and fiscal deficits derived from falling commodity prices in recent years. The production of alumina, gold, and oil in the Surinamese economy accounted for 88% of exports and 40% government revenue in 2011. The global price decline of those commodities and the closure of the alumina refinery in late-2015 weighed drastically on economic growth (Chart 1).

Suriname’s current-account and fiscal balances have deteriorated (Chart 2). The fiscal balance moved from a small surplus in 2011, prior to the commodity price downfall, to a deficit of 8.8% of GDP last year, with the drop in government mineral revenue being responsible for 82% of that change (IMF, 2016). On the balance of payments side, the current account moved from a surplus of 5.7% of GDP in 2011 to a 15.6% deficit in 2015, although a larger part of the deterioration was due to a sharp increase in imports due to large investments in a new oil refinery and a new gold mine.

To facilitate the adjustment of the exchange rate to changing terms of trade, the government shifted from a pegged to a floating exchange rate regime in March 2016. To close the gap between the official and parallel exchange rates, the Central Bank of Suriname put in place a system of foreign exchange auctions (Chart 3 – left side). Similar to other commodity exporting countries, the local currency lost more than half of its value in dollars, and – together with some utility tariff hikes – was largely responsible for an inflationary spike (Chart 3 – right side).

The government of Suriname took action to adjust to the commodity price shock and to lay the foundation to increase the economy’s resilience to future shocks. The government designed its adjustment effort in 2015 and began its implementation in August 2015 with an immediate strong fiscal adjustment. To finance the transition, soften the adjustment path, and facilitate the implementation of the far-reaching structural reforms that the government outlined in its program, the government approached the IMF and other international organizations in early-2016. These efforts led to an agreement on a Stand-By Arrangement in May 2016 with the IMF (2016) – the first program of Suriname since the country joined the IMF in April 1978. Success of this program is anchored on four pillars.
The reestablishment of fiscal sustainability was a key pillar of the policy response that started in August 2015: through a combination of expenditure cuts and revenue increases, the government reduced the fiscal deficit from an annualized 12.5% of GDP during January-July to 3.5% of GDP during August-December. A key element of the adjustment was the reduction in electricity tariff subsidies, with a 52%average increase in electricity tariffs in November 2015.
The government adjustment program that the IMF agreed to support incorporates additional measures to reduce the fiscal deficit further to 1.4% of GDP by 2018. In order to reach those targets, electricity subsidies and existing exemptions in income taxation for insurance companies will be scrapped; fuel and sales taxes will be hiked; a Value Added Tax and a vehicle tax will be introduced – the former by January 2018 and the latter in the second half of this year; the wage bill will be restrained; and contingency measures will stand ready to be deployed if necessary.
Critical to increase the resilience of government finances going forward are the reforms to strengthen the fiscal policy framework. These include modernization of public financial management, procurement, revenue administration, and treasury functions and the establishment of a sovereign wealth fund to minimize revenue fluctuations stemming from commodity price swings.
Following the Surinamese tradition to maintain a wide social protection network and protect the more vulnerable, the government will improve social cash transfer programs focused on the most vulnerable. By the same token, the reform of electricity prices eliminates one of the most regressive subsidies as 92 % of the subsidies used to accrue to the 10% largest consumers.
Rebuilding foreign reserves to harness confidence and stability is a second pillar of the government program. This is to come with the multilateral and limited commercial financing, fiscal adjustment, and an expected improvement in the external current account resulting from the flexible exchange rate and a strong increase in gold exports as the large investments of recent past come on-stream. The government projects (and the IMF agrees) that the current account will move from a deficit of 15.6% of GDP in 2015 to at least a zero balance in 2017-18. Foreign exchange reserves are, in turn, expected to reach 4 months of imports by end-2018 and stay there afterwards.
Increasing resilience through exchange rate, monetary, and financial policies is a third prong of the program. In order to avoid the propagation of the inflation shock that followed the exchange rate depreciation and other relative price adjustments, domestic liquidity conditions are being kept tight by necessity.
Finally, structural reforms for diversification and improving the business environment have also been included as a fourth pillar. Several areas where the business environment can be improved in a relatively shorter time span have already been identified, including enforcement of contracts, investor protection, registration of property, trade facilitation, exchange restrictions, access to finance and others. Tapping the agriculture sector potential can also be boosted with an improvement of public services concerning plant health, animal health, and fishery sustainable management
.
The government projects that the implementation of its adjustment and reform program will boost economic growth from -2% this year to 2.5% in 2017, taking into account the positive impact from the opening of a new gold mine, and to converge to a medium-term rate of 3%. Consumer price inflation will likely peak at 24% at end-2016 and decline to 6.1% by 2018.
That is a script in which Suriname can appropriately claim success in correcting its economic course after the drastic changes in the global environment. And the credit for the success should be given to the strong ownership of the Surinamese government, which designed the adjustment and reform program and began implementing it even before approaching the international community for its support, and to the Surinamese people, who understood the need for the adjustment and reform efforts to face the storm and have supported its implementation
Comments Off on Suriname: Facing the Storm with a Correction of Course

2015 was the worst year for world trade since the aftermath of the global financial crisis, with figures exhibiting a decline of almost 14% in dollar value terms. In fact, world trade volumes have lagged behind GDP growth since the 2000s, a trend accentuated since the onset of the global financial crisis, whereas global trade increases took place at a higher pace than world GDP prior to the new millennium. Although some transitional – and therefore potentially reversible – explaining factors may be pointed out, some structural trends have also been at play. Given that trade has been a key driver of global growth, income convergence, and poverty reduction, concerns have been raised over whether the current directions of world trade lead towards a lesser development-boosting potential.
World trade suffered another disappointing year in 2015, experiencing a contraction in merchandise trade volumes during the first half and only a low recovery during the second half. (Figure 1). While last year’s trade performance can be associated to the on-going growth transition in China and its reflections on other non-advanced economies – see Constantinescu et al, Trade Turbulence, F&D, March 2016 – the fact is that last year’s performance came after a period since the 2000s in which world trade volumes have lagged behind GDP growth, a trend accentuated since the onset of the global financial crisis and in sharp contrast to global trade increases at a higher pace than world GDP prior to the new millennium.

Source: Netherlands Bureau of Economic Policy, World Trade Monitor, December 2015
Economists have indicated some circumstantial factors to explain this post-GFC pattern (Dadush, 2015) (Didier et, 2015, p. 18). For instance, world GDP and trade figures would be reflecting the fact that the highly open-trade countries of the Eurozone have had a sub-par growth performance relative to the rest of the world. Furthermore, the weak recovery of fixed investments in advanced economies – Canuto (2014a) – has suppressed an important source of trade volume, given the higher-than-average cross-border exchanges that characterize such goods.
More disputed hypotheses have also been argued. More stringent capital requirements and financial regulations might be curbing the availability of trade finance. Additionally, rising “murky” trade-restrictive tax-cum-subsidy policy measures adopted in some key sectors by some countries may also have become more significant than usually perceived (Global Trade Alert 18, 2015).
While those post-crisis factors have certainly played a role, some structural trends seem also to be at play. As suggested by Figure 2, after steadily increasing between the mid-1980s and the mid-2000s, the trade elasticity to GDP has lost steam (though it remained above one, thus implying that trade was still rising faster than GDP). After jumping in previous decades, the world’s exports-to-GDP ratio seems to have started to approach some plateau (or a “peak trade”). Since 2008, world trade has been rising slower than GDP at around 0.8:1, leading to a fall in the share of exports in global GDP. However, even if post-GFC factors were partially reversed, the presence of a long-term trajectory of trade elasticity displaying a slowdown already prior to the recent pattern would suggest no automatic return to the heyday.

Source. Escaith and Miroudot, ch. 7 in Hoekman (2015)
Notes: Merchandise exports only; world GDP and trade at constant 2005 prices; dollar figures for GDP are converted from domestic currencies using official exchange rates. Long-term elasticity is based on 10-year rolling period from 1960-1970 to 2005-2015 (2015 is based on forecasts).
Hoekman (2015) brings a thorough examination of both “cyclical” (post-GFC) and “structural” hypotheses about the global trade slowdown. Regardless of the weight attributed to these factors in explaining recent developments, three processes stand out as relevant for the purpose of analyzing what lies ahead in terms of the link between global trade and development. Two of them were “transitional” – in the sense that they were “one shot” – the unfolding of which underpinned the extraordinary ascent of the global export-GDP ratio. The third one has evolved more gradually and will likely carry a significant transformative role ahead.
The period from the mid-1980s to the mid-2000s was peculiar in several aspects. For one, these decades featured a process of economic reforms that aimed to remove barriers to trade, a multilateral trading system that reduced uncertainty for traders, and technological advances that reduced trade and communications costs. Combined, these trends ushered in years of sustained trade expansion. Average tariffs moved to well below ten percent, and in many countries a significant share of trade became duty-free. Advances in transport (such as containerized shipping) and information and communications technologies greatly reduced the cost of shipping goods and of managing complex production networks. Together these developments led to two major changes in the structure of global trade: (a) the vertical and spatial cross-border fragmentation of manufacturing into highly integrated “global production networks” or “global value chains” (GVCs); and (b) (to a lesser extent) the rise of services trade (Canuto, Dutz & Reis, ch. 3 in Canuto & Giugale, 2010) (Canuto, 2012).
The full establishment of cross-border GVCs intrinsically raises trade measured as gross flows of exports and imports relative to GDP, a value-added measure, because of “double counting” of the former – although the ratio of trade to GDP still increases even when trade is measured on a value-added basis (Canuto, 2013a). Given the then-prevailing technological state of arts in production processes, the policy and enabling-technology breakthroughs above mentioned sparked a powerful cycle of fragmentation, especially in manufacturing, with a corresponding cross-border spread of GVCs.
The re-shaping of the economic geography might have kept the pace with global trade impacts via further dislocation of fragments of GVCs, depending on the evolution of country locational attributes. Technological changes might also have altered optimal spatial configurations of the various manufacturing activities, as well as extended fragmentation to other sectors. This may well be the case ahead, as technologies and country policies keep evolving – some analysts point to a greater reliance on regional production networks, while others refer even to a potential reversal of GVCs because of 3D printing (“additive manufacturing”) (see references in the introduction of Hoekman (2015)).
However, the wave of cross-border manufacturing fragmentation of mid-1980s through the mid-2000s was particularly intense and time-concentrated (Canuto, 2015a). Figure 3 – from Constantinescu et al (2015) – shows that the ratio of foreign value added to domestic value added in world gross exports increased by 2.5 percentage points from 2005 to 2012, after having risen by 8.4 percentage points from 1995 to 2005.

Source: Constantinescu et al (2015)
The wave of fragmentation of manufacturing activity benefited from the incorporation of large swaths of lower-wage workers from Asia and Eastern Europe into the global market economy (Canuto, 2015a). Conversely, the former facilitated a process of growth-cum-structural-transformation with substantial total factor productivity increases in these countries via transfer of population from low-value, low-productivity activities to the production of modern tradable goods, for which foreign trade was instrumental – with China as a special case both in terms of speed and magnitude (Canuto, 2013b) ((Gautier et al, ch. 5 in Hockman (2015)).
The transitional nature of such a lift of world trade relative to world real GDP, even as the latter grew substantially, stemmed from the inevitable tendency of both starting to rise more in line once the intense transformation approached completion. Its extraordinary intensity also reflected a peculiar – and transitory – combination of ultra-high investments-to-GDP and trade-surplus-to-GDP ratios in China with large current-account deficits of the U.S. (Canuto, 2009).
More recently, China has initiated a rebalancing toward a new growth pattern, one in which domestic consumption is to rise relative to investments and exports, while a drive toward consolidating local insertion in GVCs to move up the ladder of value added is also to take place. That rebalancing has been pointed out as one of the factors behind the recent global trade slowdown, given China’s weight in the world economy and a recent trend of “import substitution” as illustrated in Figure 4.

Source: (Constantinescu et al, ch. 2 in Hoekman (2015)
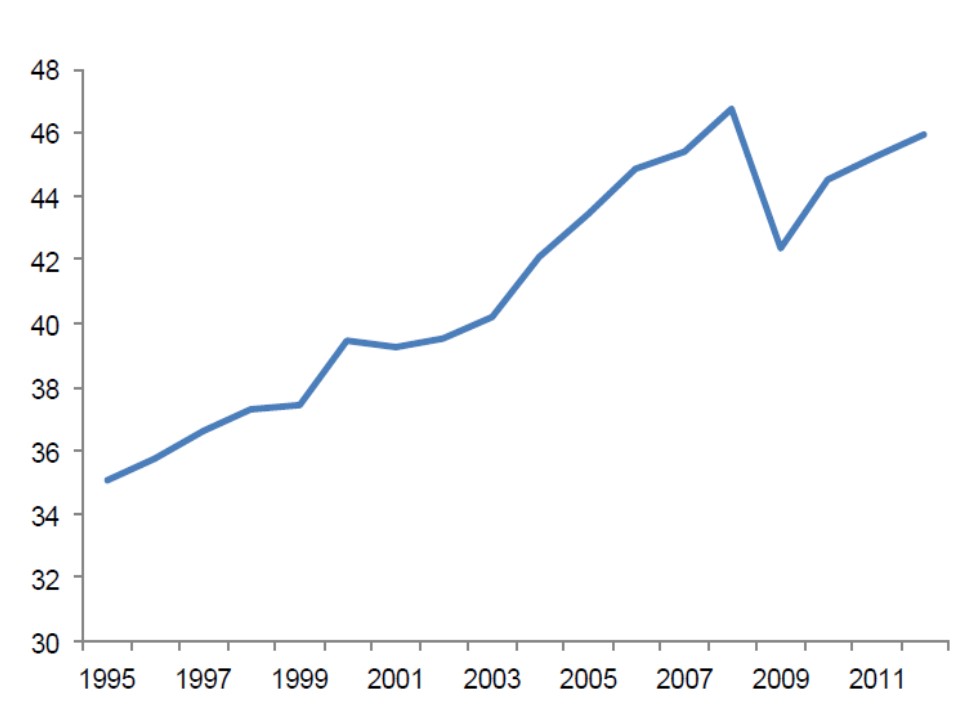
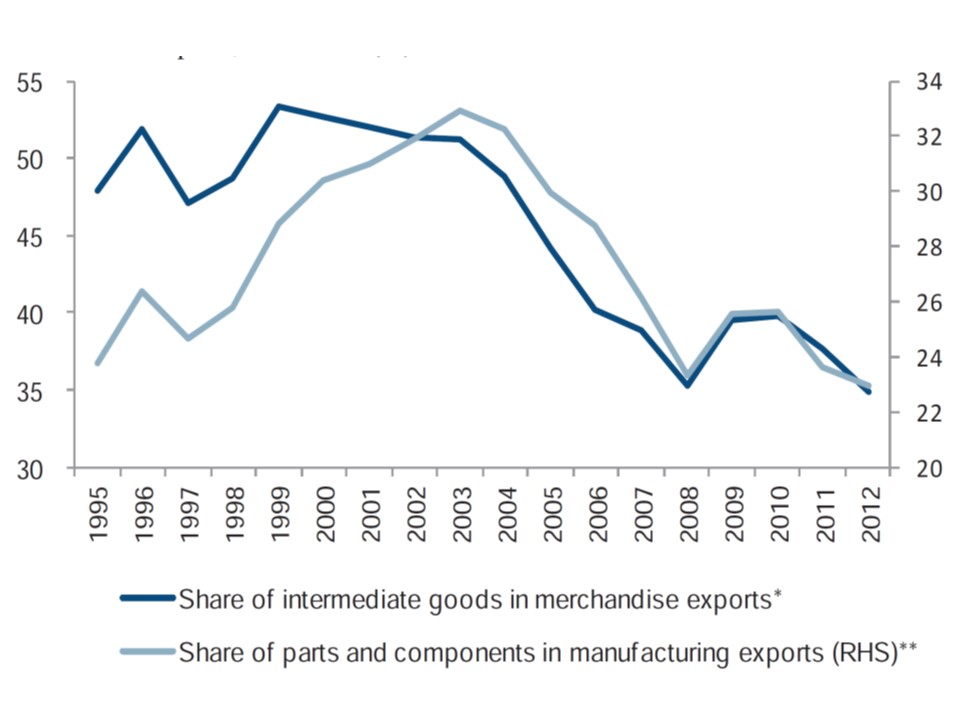
While both the GVCs’ rise and growth-cum-structural-transformation – especially in China – were taking place, with corresponding impacts on the landscape of foreign trade, advanced – or mature market – economies maintained a steady evolution toward becoming services economies – a trend maintained after the GFC. Lower GDP shares of the value added in manufacturing have accompanied rising shares of employment in services (Figures 5 and 6).

Source: Institute of International Finance, “The rise of services – what it means for the global economy”, December 15, 2015

Source: Institute of International Finance, “The rise of services – what it means for the global economy”, December 15, 2015
Both supply and demand factors explain such trends in advanced economies. On the supply side, beyond the higher pace of increases of productivity in manufacturing than in services (with correspondingly different rhythms of reduction in labor requisites), not only did the relative prices of manufactured goods fall, but a substantial part of local production was also off-shored as a result of GVCs and the incorporation of cheaper labor from areas previously out of the market economy world. On the demand side, one may point out both a higher income-elasticity of demand for services – reinforced by aging of the population – and to technology trends favoring “software” vis-à-vis “hardware” – or “intangible” relative to “tangible” assets – as leading to an increasing weight of services in GDP and employment (IIF, 2015).
Those evolutionary features of supply and demand would also be valid for emerging market and developing countries – even if, as suggested in the upper half of Figure 5, they were partially mitigated in China and other Asia/Pacific countries by sucking manufacturing activities from other emerging market and developing economies. In any case, given the state of current technological trajectories, rising shares of services throughout would imply an anti-trade bias, given a still higher trade-propensity of manufacturing.
IIF (2015) goes as far as to argue that this has already brought consequences for the global business cycle, rendering it less influenced by swings in manufacturing output, with shock transmission from advanced economies increasingly taking place via trade of services among themselves and more weakly to manufacturing-dependent emerging market and developing economies. This would be one of the factors behind the abrupt decline of the world trade elasticity and of the recent decoupling of growth between recovering advanced and decelerating emerging economies.
World trade may well live through a new era of rise relative to GDP (Hoekman’s introduction in Hoekman (2015)): on-going technological trajectories may deepen the fragmentation and increase the tradability of services; new vintage trade agreements – including possible TPP and TTIP (Canuto, 2015b) – are giving special attention to restrictions on trade of services. In fact, the content of services in current foreign trade transactions has already been higher than what gross trade figures display (Canuto, 2014b).
Another question is what lies ahead in terms of growth opportunities for non-advanced economies through foreign trade given the evolution of the latter along the lines here described, one in which the factors that led to the “peak trade” seem to have exhausted, at least in the near future ahead. Trade has been a key driver of global growth, income convergence, and poverty reduction. Both developing countries and emerging market economies have benefited from opportunities to transfer technology from abroad and to undergo domestic structural transformation via trade integration in the last decades. One may thus understand why there has been some concern over whether the current pace and direction of world trade lead towards a lesser development-boosting potential.
The nature and height of domestic policy challenges have changed substantially in a three-fold way:
First, China is in a league of its own and its rebalancing-cum-upgrading will condition other emerging market and developing economies. If it lets low-skill labor-intensive manufacturing activities go, a new wave of further GVC dislocations may open opportunities for countries currently endowed with cheap and abundant labor. On the other hand, its densification of local parts of GVCs will represent a competitive challenge to medium-range manufactures produced in other middle-income countries. The net result will also depend on the leakages outward of its domestic demand as it rebalances toward a more consumption- and service-oriented economy.
Second, the directions taken by technological trajectories and aggregate demand in advanced economies seem to point toward a broad alteration of the balance of locational advantages for production fragments, decreasing the weight of labor costs and augmenting the relevance of local availability of other complementary intangible assets. A “double whammy” on production and exports of non-advanced economies may take place: a partial reversal of off-shoring and a slower growth of outlets for their typical exports.
Third, the bar, in terms of what it takes to countervail that double whammy (improvements of the local business environment and transaction costs, quality of economic governance and other conditions favorable to accumulation of intangible assets) has been raised. Nonetheless, provided that such bar is reached, the local provision of – embodied or disembodied – services complementary to those produced or used in advanced economies may flourish. This will be the case, e.g. of natural resource-rich countries that manage to develop related intangible assets in terms of applied-science capabilities.
The run-up to “peak trade” was one of primarily exploring complementarities within GVCs to substitute for existing producers. The post-peak trade era may well be one of building complementarities
Comments Off on What Happened to World Trade?
Emerging market economies (EM) as a special class of financial assets have recently been subject to two competing tales. On the one hand, there is evidence of continued financial deepening and further integration within the global financial system, while the offer of higher yields remains hard to find elsewhere. On the other hand, there are frequent bouts of fear of systemic unwinding of positions triggered by investors “exiting” EM that exhibit signs of weak or unclear macroeconomic foundations.
The upbeat tale finds support, e.g. in the fact that, taking advantage of the relatively benign environment of low interest rates and available global liquidity, many developing economies heretofore perceived as weak candidates have debuted in the sovereign debt markets attracting large volumes of foreign exchange (Gevorkyan and Kvangraven, 2016). More recently, what seemed at times to be a peak in sovereign borrowing has continuously been topped off as investors keep reaching for the yield and flows keep moving to EM. Last month, e.g. the IIF EM Portfolio Flows Tracker and Flows Alert reported a further strengthening of portfolio flows to emerging markets after the Brexit vote. Some geographical disparity has been showed – inflows to EM Asia and Latin America, modest outflows from EM Europe and Africa/Middle East – but non-resident portfolio flows to EM as a group climbed from $13.3 billion in June to $24.8 in July.
The downbeat story, in turn, has occasionally assumed the lead, combining episodes of overall rising risk aversion and groups of EM deemed to be in correspondingly more vulnerable positions. Like the “taper tantrum” in the summer of 2013 when the early references by the Fed to a future end of quantitative easing led to unwinding of positions on the then “fragile 5” EM (Canuto, 2013a), or when fears of a hard landing in China’s growth transition generated portfolio adjustments in other EM (Canuto, 2014a) (Canuto and Gevorkyan, 2016). While concerns about high levels of EM corporate debt leverage have remained at the forefront, easing of fears about China’s landing has more recently improved the risk-adjusted return prospects of EM as illustrated by flow figures of last month.
As the authors of this piece have highlighted in a recently released book – Gevorkyan and Canuto (2016) – those ebb-and-flows in EM financing have been accentuated by a change of narrative regarding EM structural strengths in the last few years. Not long ago, some analysts – including one of us (Canuto, 2010) – were anticipating a switchover in the growth engines of the global economy, with autonomous sources of growth in emerging and developing economies compensating for the drag of struggling advanced economies.
To be sure, the baseline scenario for the post-crisis “new normal” then outlined entailed slower global economic growth than during the pre-2008 boom. For major advanced economies, the financial crisis marked the end of a prolonged period of debt-financed domestic consumption, based on wealth effects derived from unsustainable asset-price overvaluation. Later on, attention came to be increasingly given to several hypotheses of “secular stagnation” in those economies (Canuto, 2014b).
However, 5 years of decreasing growth rates in the emerging market world – see Figure 1 – have thrown some cold shower on the enthusiasm about a switchover of locomotives. Even if there remains a growth differential – with some revival forecast by the IMF for next year – the fact is that the growth downward transition in China’s rebalancing, lower commodity prices, the exhaustion of domestic stimulus policies and the permanence of some structural flaws in most EM have led to a retrenchment of the expectation of a decoupling and even partial rescue of advanced economies by them.

It has become apparent that emerging-market enthusiasts underestimated at least two critical factors (Canuto, 2011; 2013b). First, emerging economies’ motivation to transform their growth models was weaker than expected. The global economic environment – characterized by massive amounts of liquidity and low interest rates stemming from unconventional monetary policy in advanced economies – led most emerging economies to use their policy space to build up existing drivers of growth, rather than develop new ones.
The second problem with the above mentioned emerging-economy forecasts was their failure to account for the vigor with which vested interests and other political forces would resist reform – a major oversight, given how uneven these countries’ reform efforts had been prior to 2008. The inevitable time lag between reforms and results has not helped matters.
The most recent cycle of global financial flows often looks like to be running out of steam, in the wake of the phasing out of the US accommodative monetary policy stance, while concerns over the advanced economies’ recovery remain. The period of large-scale speculative financial flows and broad access to credit in emerging markets does not seem likely to return, despite ebbs and flows already mentioned. Even with occasional reversals of the downfall in foreign capital flows, emerging markets have already been coping with less benign external finance conditions (Figure 2).

As approached in Gevorkyan and Canuto (2016), emerging markets as a class of economies exhibit a lot of heterogeneity in many regards. As highlighted by IIF (2015), notwithstanding a relatively clear dividing line between EMs and advanced economies, EMs are quite heterogeneous across various metrics. Their responses to shocks differ substantially according to their economic structures, such as dependence on external financing and on commodity exports.
Take for example the case of smaller, net importer, economies in transition in Eastern Europe and Former Soviet Union. There the institutional basis and economic structure are yet to evolve in a solid, established, form able to withstand unexpected and severe external pressures (see e.g. Gevorkyan, 2015 and Gevorkyan, 2011).
Taking all of the above together three critical points emerge as core features of medium term developments in the broader group of emerging markets, small countries included.
First, growth rates will remain sub-par across those heavy-weight EM dragged down by recent underperformance (e.g. Brazil, Russia), while China is expected to settle to growth rates much lower than in the period up to 2011 and India still needs structural reforms as a precondition to lift its growth pace to its potential.
Second, EM will continue to capitalize on global low interest environment and abundant liquidity even as they implement structural adjustment policies and reforms, as well as while part of their non-financial corporates deal with the legacy of the excess debt leverage built until recently.
Third, as a result, a propensity to undergo periodic episodes of instability and volatility in global financial markets will persist. Get ready for a continuous dispute between the two financial tales about EM, as well as to increasing efforts of differentiation among their assets.
Comments Off on Tales of Emerging Markets
The Chinese economy is rebalancing while softening its growth pace. China’s spillovers on the global economy have operated through trade, commodity prices, and financial channels. The global reach of the effects from China’s transition have recently been illustrated in risk scenarios simulated for Latin American and the Caribbean economies.
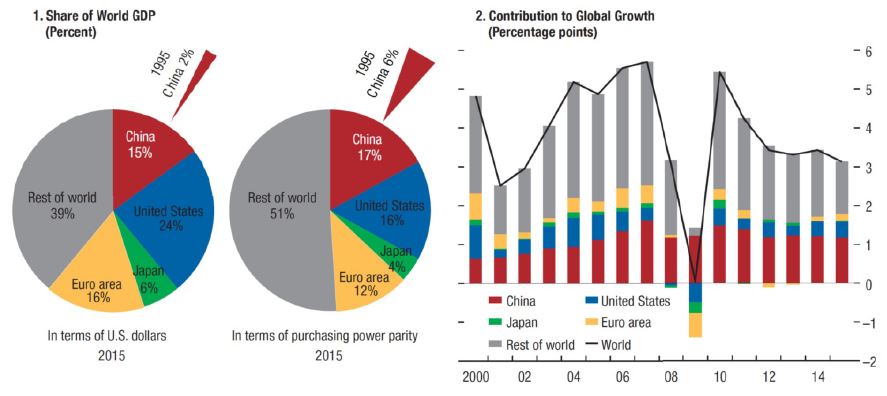
The weight of the Chinese economy in the global economy rose on its way to become the world’s second largest economy at market exchange rates and first in terms of purchasing power parity. As noted by the IMF (2016a, p.47), approximately one third of global growth during 2000-15 took place in China, while its exports increased from 3 percent to 9 percent as a share of world exports (Chart 1)
More recently, China’s economic growth has been morphing from one led by public investment and exports of manufactures, towards one where consumption and services are the main drivers (Canuto, 2013a) (IMF, 2016a). The new growth pattern entails lowering the GDP growth rates to levels that are more balanced and sustainable, based on rising purchasing power of its population and less dependent on huge trade deficits elsewhere in the global economy.
“China’s transition may, however, face bumps. First of all, some complex and time-consuming structural reforms will need to be implemented.”
China’s transition, on the other hand, may face bumps. First of all, some complex, time-consuming structural reforms will need to be implemented. The provision of public services must be widened, in order to convince households to raise their propensity to consume. The business environment will have to be reconfigured as a necessary step to make possible moving up the sophistication ladder in value chains and overcoming so-called “middle income traps” (Agenor, Canuto and Jelenic, 2012) (Agenor, Canuto and Jelenic, 2014). The existing universe of state-owned enterprise will also need to be reformed.
Furthermore, there is the legacy of corporate debt and excess capacity in former lead sectors that resulted as a consequence of policies implemented to avoid a hard landing in the aftermath of the global financial crisis. This legacy has been at the origin of occasional financial market jitters more recently. Fears of disorderly financial unraveling and abrupt exchange-rate depreciations have been behind episodes of capital outflows and loss of foreign reserves – Canuto and Gevorkyan (2016) – even if a more benign scenario has prevailed in recent months.
In hindsight one now understands the core role played by China’s growth-cum-structural-change in the upswing and – in the last five years – downswing phases of the cycle during which developing and emerging market countries went from “switching over as global locomotives” – Canuto (2011) – to “getting lost in the transition” (Canuto, 2013b). Notwithstanding idiosyncratic, country-specific factors and policies underpinning the growth performance in those economies, they have all been impacted by the evolution of China’s economy – including the growth resilience exhibited by the latter after the global financial crisis, despite the cost of rising financial and capacity imbalances. The recent rebalancing of the Chinese economy has naturally also brought spillovers.
There are three channels through which those spillovers from China to the rest of the world have operated (IMF, 2016a, ch.2). First, there is trade as a direct channel. A faster-than-expected slowdown in imports and exports has reflected not only a deceleration in investment and manufacturing activities, but also a movement of densification of domestic value chains to the detriment of imports of intermediates or export-related inputs. China’s foreign trade was a key factor behind the world trade slowdown last year (Canuto, 2016).
Second, there are spillovers through commodity prices. The growth slowdown and rebalancing in the Chinese economy has been a major factor affecting the demand and prices of commodities. This is matched by developments on the supply side, following technological innovations and new capacities that emerged during the upswing phase of the super-cycle.
Third, there are the direct and indirect spillovers through financial channels. As bouts of uncertainty about the smoothness of China’s growth slowdown and policy changes often spark global risk aversion episodes, financial spillovers extend way beyond those economies that have developed deeper financial links with China. Interestingly, while the “taper tantrum” derived from U.S. monetary policy signals in the summer of 2013 – (Canuto, 2013c) – the turbulences in emerging markets’ exchange rates and capital flows in January 2014 could be traced to financial events in China (Canuto, 2014). This has also been the case in August 2015 and January this year.
Spillovers from China, as it undergoes its growth-slowdown-cum-rebalancing are illustrated in recent simulations of the impact on Latin America and the Caribbean as reported last month by the International Monetary Fund – IMF (2016b) – and the Inter-American Development Bank – IDB (2016).
The IMF’s Regional Economic Outlook for the Western Hemisphere developed a risk scenario for Latin American and the Caribbean economies associated with a sudden bout of financial market turmoil in China. The simulation is based hypothetically on a wide set of the latter’s financial and real estate assets losing value, corporate risk premiums increasing, a new wave of capital outflows being triggered, the Renmimbi depreciating by about 15 percent, and falling investment and output. The supposed impact on the Chinese economy is a move of China’s growth 2 percentage points down relative to the IMF’s baseline in 2016 and 2017.
Such shock would affect the region not only through direct trade linkages, but also as a result of commodity prices being pulled downwards, with substantial declines in the case of minerals and fuels and smaller corrections in world food prices. As one would expect from the diversity of exposure to commodity prices in the region – Canuto (2015) – effects would tend to be highly heterogeneous notwithstanding their overall significance.
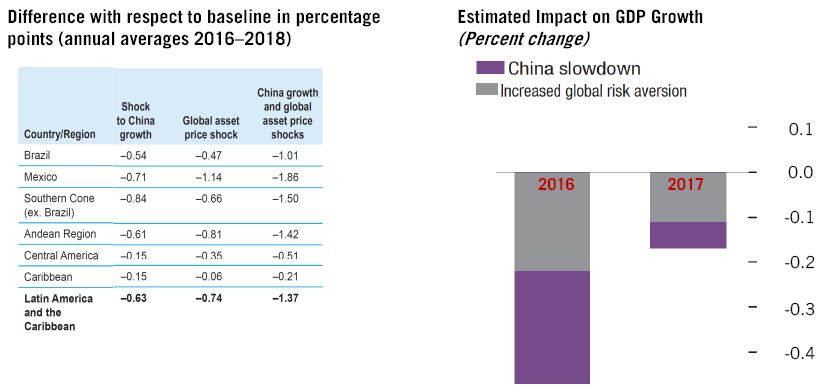
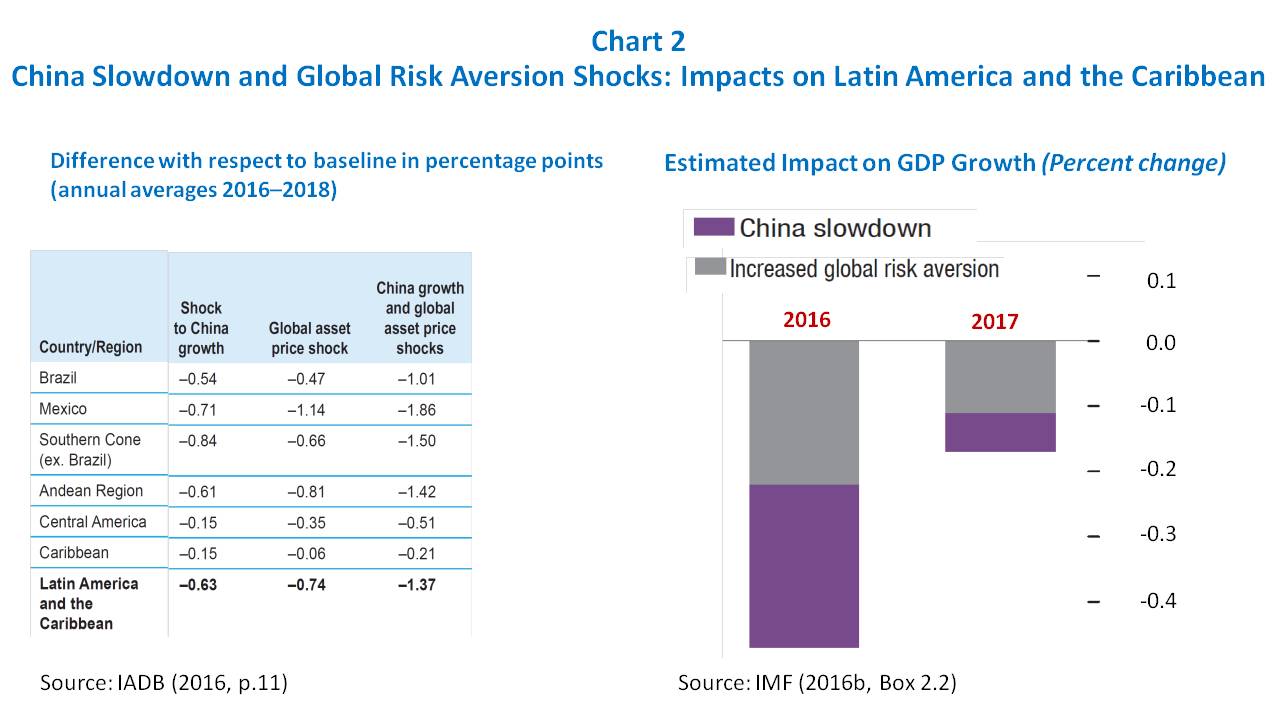
The IMF’s risk scenario also includes the effects of a rise in global risk aversion following the simulated financial turmoil in China, leading to a re-pricing of sovereign debt in the region. The overall results of both simulated stress factors are depicted on the right side of Chart 2 (IMF, 2016b, p.42):
“Based on model simulations, the cyclical slowdown in China could reduce growth in Latin America and the Caribbean by about ¼ percentage point in 2016 relative to the [IMF’s]World Economic Outlook baseline. In addition, an increase in sovereign risk premiums triggered by higher global risk aversion would cut growth by another ¼ percentage point. The overall impact declines in 2017 but is still negative (total of about 0.2 percentage point).”
The latest annual macroeconomic report of the Inter-American Development Bank also features risk scenarios for the region, that include the impact of a shock to China’s economic growth (of approximately 3 percent of GDP) and a global asset price shock (measured as a 10 percent fall in equity prices) – IDB (2016, p.9-10). The combined effect of both shocks would be something close to 1.4 percent per annum for 2015-2017 (Chart 2, left side). As illustrated in the IMF simulation, the impacts would be heterogeneous among countries but broadly significant.
China’s economic rise has also entailed increasing repercussions of its development in the rest of the world, including Latin America and the Caribbean. No wonder there is so much attention and hope for smoothness in China’s current economic rebalancing. After all, what happens in China does not stay in China…
Comments Off on IMF: China’s Spill-Overs on Latin America and the Caribbean
From theoretical and risk management points of view, a countercyclical fiscal policy can be useful for at least three compelling reasons (see Brahmbhatt & Canuto (2012) and World Bank (2014)). First, by leaning against the wind, governments can continue to provide goods and services and maintain public investment even in the event of a drop in public revenues. Second, in a downturn, a countercyclical fiscal policy can help governments increase social assistance and insurance to a large number of citizens affected by more adverse macroeconomic conditions. Third, as witnessed during the global financial crisis of 2008-09, a countercyclical fiscal policy can help countries stimulate the economy and cope better with the effects of a prolonged recession.
However, developing countries often orient government consumption and investment in the same direction as that of the cycle in general economic activity. In so doing, they amplify upswings and worsen recessions – what (Kaminsky, Reinhart, & Végh, 2004) termed as the “when it rains, it pours” phenomenon.
A simple inspection of Figure 1, which plots the value of fiscal stances in periods of expansion versus those registered in downturns, seems to lend partial support to the “when-it-rains-it-pours” phenomenon. Most of the countries in the upper and lower right quadrants of the chart are developing economies (in blue) and most importantly upper middle-income countries. In contrast, most of the high income countries (in red) appear on the upper and lower left quadrants with fiscal stances that largely contribute to long-term fiscal sustainability. However, the chart also confirms earlier findings in the literature showing that a number of developing countries have graduated from fiscal policy pro-cyclicality (c.f.,Frankel et al. (2013)).
These quadrants help categorize countries into four groups:
Figure 1

Source: Carneiro and Garrido (2015).
Some of the results may seem counter-intuitive but they actually uncover those countries that save for a rainy day, and those that let it pour when it rains.
For instance, one may be surprised to see Chile, a country that has earned a reputation of fiscal prudency and good overall macro management, in the fourth quadrant, which indicates risks to fiscal sustainability. As it turns out, Chile is, on average, for the period 1990-2011, moderately pro-cyclical in booms, and markedly anti-cyclical in downturns. Their ability to sustain a strong fiscal position arises from having a system of buoyant tax revenues and the great contribution of the private sector to economic activity, so the country is able to register solid, positive fiscal balances both in booms and recessions with marked improvements in its overall fiscal stance.
Compare this performance with that for Greece, for example, especially during the post-financial crisis period when it showed deteriorating fiscal balances, faster increase in expenditures relative to revenues, and poor economic performance, with an exacerbated contribution to volatility derived from a more pro-cyclical fiscal stance. With this, there is no doubt that Greece has yet to earn enough stars to join the same status as Chile’s.
As it turns out, many resource-rich countries remain clustered in the bottom right-hand quadrant. This is where things turn from moderate showers to a downpour too quickly. For this group of countries, in good times, all is well that ends well, but as soon as things turn sour so does their governments’ ability to lean against the wind.
Carneiro and Garrido (2015) have also found evidence in support of the idea that institutional quality is an important determinant of a country’s fiscal stance. This is an important result that suggests that efforts to graduate from fiscal policy pro-cyclicality need to be accompanied by policy reforms that seek to strengthen the ability of countries to save in good times to generate fiscal buffers that could be used in bad times. In that regard, initiatives such as the establishment of fiscal councils and the adoption of fiscal rules, the development of sound debt management strategies that reinforce fiscal discipline, and the strengthening of macro prudential regulations appear to be necessary conditions for graduation from pro-cyclicality.
Comments Off on When it comes to fiscal policy, it’s better to save for a rainy day than to let it pour

The Chinese economy is rebalancing while softening its growth pace. China’s spillovers on the global economy have operated through trade, commodity prices, and financial channels. The global reach of the effects from China’s transition have recently been illustrated in risk scenarios simulated for Latin American and the Caribbean economies.
The weight of the Chinese economy in the global economy rose on its way to become the world’s second largest economy at market exchange rates and first in terms of purchasing power parity. As noted by the IMF (2016a, p.47), approximately one third of global growth during 2000-15 took place in China, while its exports increased from 3 percent to 9 percent as a share of world exports (Chart 1)

More recently, China’s economic growth has been morphing from one led by public investment and exports of manufactures, towards one where consumption and services are the main drivers (Canuto, 2013a) (IMF, 2016a). The new growth pattern entails lowering the GDP growth rates to levels that are more balanced and sustainable, based on rising purchasing power of its population and less dependent on huge trade deficits elsewhere in the global economy.
China’s transition, on the other hand, may face bumps. First of all, some complex, time-consuming structural reforms will need to be implemented. The provision of public services must be widened, in order to convince households to raise their propensity to consume. The business environment will have to be reconfigured as a necessary step to make possible moving up the sophistication ladder in value chains and overcoming so-called “middle income traps” (Agenor, Canuto and Jelenic, 2012) (Agenor, Canuto and Jelenic, 2014). The existing universe of state-owned enterprise will also need to be reformed.
Furthermore, there is the legacy of corporate debt and excess capacity in former lead sectors that resulted as a consequence of policies implemented to avoid a hard landing in the aftermath of the global financial crisis. This legacy has been at the origin of occasional financial market jitters more recently. Fears of disorderly financial unraveling and abrupt exchange-rate depreciations have been behind episodes of capital outflows and loss of foreign reserves – Canuto and Gevorkyan (2016) – even if a more benign scenario has prevailed in recent months.
In hindsight one now understands the core role played by China’s growth-cum-structural-change in the upswing and – in the last five years – downswing phases of the cycle during which developing and emerging market countries went from “switching over as global locomotives” – Canuto (2011) – to “getting lost in the transition” (Canuto, 2013b). Notwithstanding idiosyncratic, country-specific factors and policies underpinning the growth performance in those economies, they have all been impacted by the evolution of China’s economy – including the growth resilience exhibited by the latter after the global financial crisis, despite the cost of rising financial and capacity imbalances. The recent rebalancing of the Chinese economy has naturally also brought spillovers.
There are three channels through which those spillovers from China to the rest of the world have operated (IMF, 2016a, ch.2). First, there is trade as a direct channel. A faster-than-expected slowdown in imports and exports has reflected not only a deceleration in investment and manufacturing activities, but also a movement of densification of domestic value chains to the detriment of imports of intermediates or export-related inputs. China’s foreign trade was a key factor behind the world trade slowdown last year (Canuto, 2016).
Second, there are spillovers through commodity prices. The growth slowdown and rebalancing in the Chinese economy has been a major factor affecting the demand and prices of commodities. This is matched by developments on the supply side, following technological innovations and new capacities that emerged during the upswing phase of the super-cycle.
Third, there are the direct and indirect spillovers through financial channels. As bouts of uncertainty about the smoothness of China’s growth slowdown and policy changes often spark global risk aversion episodes, financial spillovers extend way beyond those economies that have developed deeper financial links with China. Interestingly, while the “taper tantrum” derived from U.S. monetary policy signals in the summer of 2013 – (Canuto, 2013c) – the turbulences in emerging markets’ exchange rates and capital flows in January 2014 could be traced to financial events in China (Canuto, 2014). This has also been the case in August 2015 and January this year.
Spillovers from China, as it undergoes its growth-slowdown-cum-rebalancing are illustrated in recent simulations of the impact on Latin America and the Caribbean as reported last month by the International Monetary Fund – IMF (2016b) – and the Inter-American Development Bank – (IDB, 2016).
The IMF’s Regional Economic Outlook for the Western Hemisphere developed a risk scenario for Latin American and the Caribbean economies associated with a sudden bout of financial market turmoil in China. The simulation is based hypothetically on a wide set of the latter’s financial and real estate assets losing value, corporate risk premiums increasing, a new wave of capital outflows being triggered, the Renmimbi depreciating by about 15 percent, and falling investment and output. The supposed impact on the Chinese economy is a move of China’s growth 2 percentage points down relative to the IMF’s baseline in 2016 and 2017.
Such shock would affect the region not only through direct trade linkages, but also as a result of commodity prices being pulled downwards, with substantial declines in the case of minerals and fuels and smaller corrections in world food prices. As one would expect from the diversity of exposure to commodity prices in the region – Canuto (2015) – effects would tend to be highly heterogeneous notwithstanding their overall significance.
The IMF’s risk scenario also includes the effects of a rise in global risk aversion following the simulated financial turmoil in China, leading to a re-pricing of sovereign debt in the region. The overall results of both simulated stress factors are depicted on the right side of Chart 2 (IMF, 2016b, p.42) :
Based on model simulations, the cyclical slowdown in China could reduce growth in Latin America and the Caribbean by about ¼ percentage point in 2016 relative to the [IMF’s]World Economic Outlook baseline. In addition, an increase in sovereign risk premiums triggered by higher global risk aversion would cut growth by another ¼ percentage point. The overall impact declines in 2017 but is still negative (total of about 0.2 percentage point).
The latest annual macroeconomic report of the Inter-American Development Bank also features risk scenarios for the region, that include the impact of a shock to China’s economic growth (of approximately 3 percent of GDP) and a global asset price shock (measured as a 10 percent fall in equity prices) – IDB (2016, p.9-10). The combined effect of both shocks would be something close to 1.4 percent per annum for 2015-2017 (Chart 2, left side). As in the IMF simulation, the impacts would be heterogeneous among countries but broadly significant.
China’s economic rise has also entailed increasing repercussions of its development in the rest of the world, including Latin America and the Caribbean. No wonder there is so much attention and hope for smoothness in China’s current economic rebalancing. After all, what happens in China does not stay in China…
Comments Off on China’s Spillovers On Latin America and the Caribbean
For centuries, Latin America’s economies have revolved around exporting commodities – be it digging up minerals and hydrocarbons, planting soya or coffee, or taking advantage of what animals leave behind, the region has historically relied on shipping natural resources overseas.
Depending on the era, this could certainly be a lucrative endeavor, but commodity prices are notoriously fickle, and a focus on natural resources stunted the region’s efforts to build the manufacturing supply chains that have been instrumental in East Asia’s rapid industrialization.
In the post-World War II era, many Latin American countries attempted to address this commodity reliance by implementing import-substitution industrialization policies. In practice, this meant high tariffs to discourage imports, thus protecting domestic industry.
But without international competition, Latin American products often turned out over-priced and underwhelming. And when the region did try to liberalize in the 1990s, it did not work out so well.
As the 20th century gave way to the 21st, a number of Latin American countries returned to commodities, including agricultural products produced using increasingly sophisticated technologies. And they also went back to protectionist measures such as local content requirements aimed at supporting a domestic manufacturing sector struggling with currency appreciation.
This was a fine strategy while Chinese demand for raw materials pushed prices through the roof. But those prices have fallen in recent years, and the region faces a familiar challenge: How to move beyond commodity exports and towards successful integration into international trade networks.

As timing would have it, just as Latin American countries such as The Pacific Pumas (Chile, Colombia, Mexico and Peru) seek deeper integration into global trade, the world debates a series of mega trade deals.
How these deals will affect the region is a subject of a new Bertelsmann Foundation study, A Chain Reaction? Effects of Mega-Trade Deals on Latin America. So what did it find?
Let’s start with the Trans-Pacific Partnership – TPP – an agreement between mostly Asian and American countries—including Mexico, Chile, and Peru. According to the modeling Bertelsmann did with the Ifo Institute, Peru could be a big winner here. Their model suggests TPP could lead to a 2.4 percent increase in real income. Specifically, they see a 45 percent value-added boost to the metal sector. These results stem from the theory that once tariffs are lowered, Peruvian producers are more likely to refine commodities domestically and to export more valuable intermediate goods. In other words, instead of just digging it up and shipping it abroad, more steps towards a final product would be conducted in Peru.
For Chile and Mexico, however, TPP may not be such a big deal. Both countries already have deep trade agreements with major TPP partners, so our model suggests a new agreement might only have a marginal impact.
The Trans-Atlantic Trade and Investment Partnership—TTIP—the proposed trade agreement between the US and EU, could pose more of a threat to Latin America. Many Latin American countries trade extensively with the US. If the US and EU come to an agreement, Latin America could lose its insider-access to US markets.
For example, Mexico, which has traded freely with the US since the implementation of NAFTA in 1994, conducts nearly 80 percent of its trade with Uncle Sam. Mexico would still retain certain advantages, such as proximity and cost of labor, but increased US trade with the EU could syphon-off a degree of trade. If the EU gets NAFTA-like access, Mexican exports to the US could fall by over five percent.
What about the countries that are not involved at all?
For example, Mercosur countries on the region’s Atlantic coast are not participants in TPP, TTIP, or any of the other mega-deals we analyzed.
The biggest of these countries, Brazil, is not a member in any of the mega-deals, and maintains relatively high tariffs. The model used in the report suggests that in terms of growth, the mega-deals will not have a major effect either way.
But they will effect Brazil’s export portfolio. With less relative access to markets participating in the mega-deals (such as the US, EU and Japan), Brazil could increasingly rely on trade with China—another outlying country—and one which does not need Brazil’s manufacturing goods. In our model, Brazil’s manufacturing sector would shrink in all scenarios, threatening to leave to country back where it started: digging things out of the earth and sending them abroad. (For more on the pacts’ effects on
Brazil, be sure to see Otaviano Canuto’s “Are Mega-Trade Agreements a Threat to Brazil?“.)
Dealing with Mega-Deals: Opportunities and Challenges
But all is not lost. The regional mega-deals currently under negotiation do provide an opportunity for countries to enhance their integration in global value chains. This is particularly relevant in Latin America, where cross-border connections have been largely absent due to the long shadow of import-substitution industrialization policies.
In many cases, remaining outside of transnational value chains resulted in loss of competitiveness of domestic industries, which lack access to low-cost inputs and the latest technology – see Canuto (2015) on the Brazilian case. Too often the response has been to increase trade barriers, further separating the domestic market from global integration. Consequently, the cost of being left out increases.
The new mega-deals come at a time when Latin American countries, especially the large economies, which have avoided integration, are in crisis. Now could be an opportunity to re-align with global trade.
For better or worse, TPP and TTIP could redefine global trade in the 21st century. At the moment, a Latin America perspective is largely lacking in the negotiation process; in TTIP, it is excluded by definition. But Latin American countries can move unilaterally to ensure that tariffs and regulations match what could become the new global standard.
Of course, alternatively, they could rebuild protective economic walls. But if they do, later on down the road, they just might have to pay for it.
Comments Off on TTIP & TPP – A Threat to Latin America?

Trade has been a key driver of global growth, income convergence, and poverty reduction. Both developing countries and emerging market economies have benefited from opportunities to transfer technology from abroad and to undergo domestic structural transformation via trade integration in the last decades. Yet, more recently, concerns have been raised over whether the current pace and direction of world trade lead towards a lesser development-boosting potential.
What happened to world trade? Is it cyclical or structural?
World trade suffered another disappointing year in 2015, experiencing a contraction in merchandise trade during the first half and only low growth during the second half. This follows a similar pattern since the onset of the global financial crisis (GFC), in which world trade volumes have lagged behind GDP growth (Figure 1).
Figure 1
World Real GDP and Trade Volume
(Annualized quarterly percentage change)
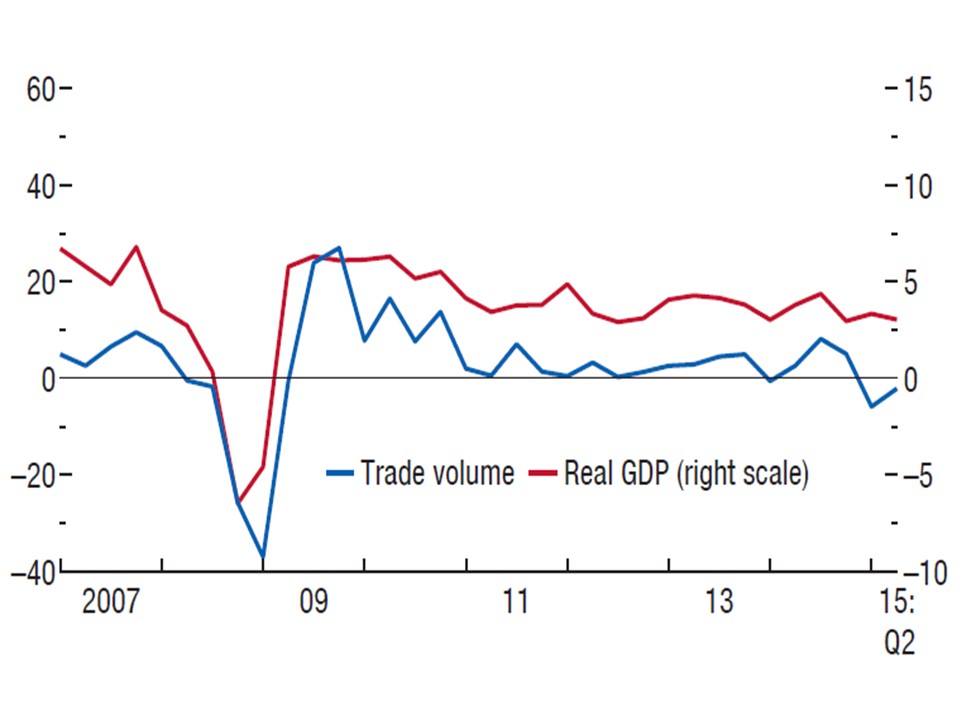
Source: IMF, World Economic Outlook, October 2015.
Economists have indicated some circumstantial factors to explain this post-GFC pattern (Dadush, 2015) (Didier et, 2015, p.18). For instance, world GDP and trade figures would be reflecting the fact that the highly open-trade countries of the Eurozone have had a sub-par growth performance relative to the rest of the world. Furthermore, the weak recovery of fixed investments in advanced economies –Canuto (2014a) – has suppressed an important source of trade volume, given the higher-than-average cross-border exchanges that characterize such goods.
More disputed hypotheses have also been argued. More stringent capital requirements and financial regulations might be curbing the availability of trade finance. Additionally, rising “murky” trade-restrictive tax-cum-subsidy policy measures adopted in some key sectors by some countries may also have become more significant than usually perceived (Global Trade Alert 18, 2015).
While those post-crisis factors have certainly played a role, some structural trends seem also to be at play. As suggested by Figure 2, after steadily increasing between the mid-1980s and the mid-2000s, the trade elasticity to GDP has lost steam (though it remained above one, thus implying that trade was still rising faster than GDP). After jumping in previous decades, the world’s exports-to-GDP ratio seems to have started to approach some plateau (or a “peak trade”). Since 2008, world trade has been rising slower than GDP at around 0.8:1, leading to a fall in the share of exports in global GDP. However, even if post-GFC factors were partially reversed, the presence of a long-term trajectory of trade elasticity displaying a slowdown already prior to the recent pattern would suggest no automatic return to the heyday.
Figure 2
Trade-income elasticity and Exports-GDP ratio – global economy
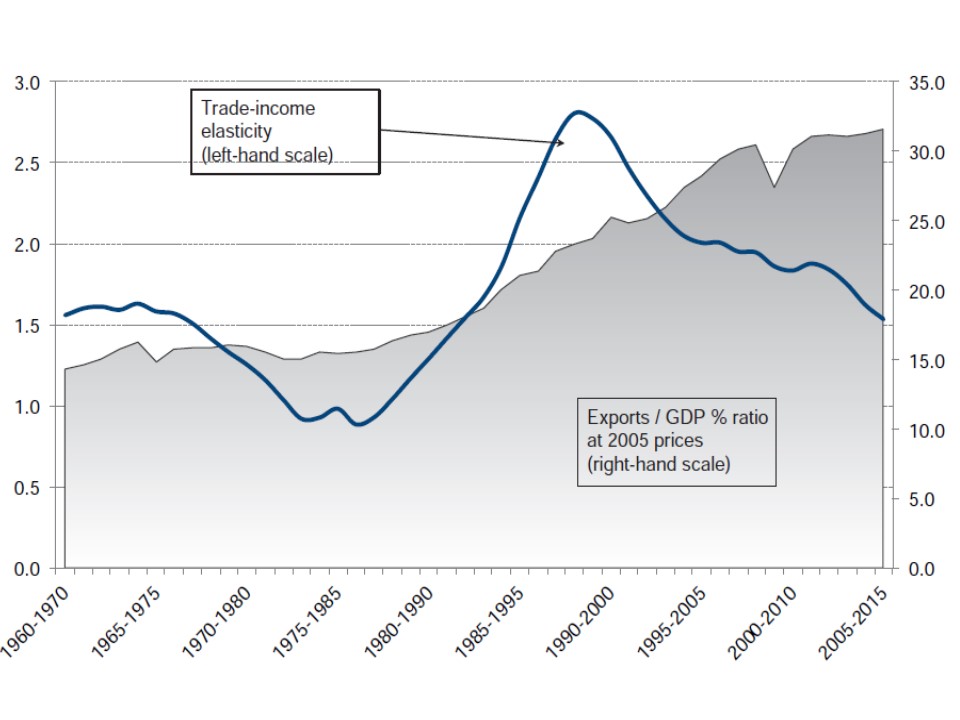
Source: Escaith and Miroudot, ch. 7 in Hoekman (2015).
Notes: Merchandise exports only; world GDP and trade at constant 2005 prices; dollar figures for GDP are converted from domestic currencies using official exchange rates. Long-term elasticity is based on 10-year rolling period from 1960-1970 to 2005-2015 (2015 is based on forecasts).
Hoekman (2015) brings a thorough examination of both “cyclical” (post-GFC) and “structural” hypotheses about the global trade slowdown. Regardless of the weight attributed to these factors in explaining recent developments, three processes stand out as relevant for the purpose of analyzing what lies ahead in terms of the link between global trade and development. Two of them were “transitional” – in the sense that they were “one shot” – the unfolding of which occurred behind the extraordinary ascent of the global export-GDP ratio. The third one has evolved more gradually and will likely carry a significant transformative role ahead.
A major wave of vertical and spatial fragmentation of production has passed
The period from the mid-1980s to the mid-2000s was peculiar in several aspects. For one, these decades featured a process of economic reforms that aimed to remove barriers to trade, a multilateral trading system that reduced uncertainty for traders, and technological advances that reduced trade and communications costs. Combined, these trends ushered in years of sustained trade expansion. Average tariffs moved to well below ten percent, and in many countries a significant share of trade became duty-free. Advances in transport (such as containerized shipping) and information and communications technologies greatly reduced the cost of shipping goods and of managing complex production networks. Together these developments led to two major changes in the structure of global trade: (a) the vertical and spatial cross-border fragmentation of manufacturing into highly integrated “global production networks” or “global value chains” (GVCs); and (b) (to a lesser extent) the rise of services trade (Canuto, Dutz & Reis, ch. 3 in Canuto & Giugale, 2010) (Canuto, 2012).
The full establishment of cross-border GVCs intrinsically raises trade measured as gross flows of exports and imports relative to GDP, a value-added measure, because of “double counting” of the former – although the ratio of trade to GDP still increases even when trade is measured on a value-added basis (Canuto, 2013a). Given the then-prevailing technological state of arts in production processes, the policy and enabling-technology breakthroughs above mentioned sparked a powerful cycle of fragmentation, especially in manufacturing, with a corresponding cross-border spread of GVCs.
The re-shaping of the economic geography might have kept the pace with global trade impacts via further dislocation of fragments of GVCs, depending on the evolution of country locational attributes. Technological changes might also have altered optimal spatial configurations of the various manufacturing activities, as well as extended fragmentation to other sectors. This may well be the case ahead, as technologies and country policies keep evolving – some analysts point to a greater reliance on regional production networks, while others refer even to a potential reversal of GVCs because of 3D printing (“additive manufacturing”) (see references in the introduction of Hoekman (2015)).
However, the wave of cross-border manufacturing fragmentation of mid-1980s through the mid-2000s was particularly intense and time-concentrated (Canuto, 2015a). Figure 3 – from Constantinescu et al (2015) – shows that the ratio of foreign value added to domestic value added in world gross exports increased by 2.5 percentage points from 2005 to2012, after having risen by 8.4 percentage points from 1995 to 2005.
Figure 3
Ratio of Foreign Value Added to Domestic Value Added
in World Gross Exports (%)
Source: Constantinescu et al (2015)
A major wave of trade-cum-structural-transformation has passed – with China as a special case
The wave of fragmentation of manufacturing activity benefited from the incorporation of large swaths of lower-wage workers from Asia and Eastern Europe into the global market economy (Canuto, 2015a). Conversely, the former facilitated a process of growth-cum-structural-transformation with substantial total factor productivity increases in these countries via transfer of population from low-value, low-productivity activities to the production of modern tradable goods, for which foreign trade was instrumental – with China as a special case both in terms of speed and magnitude (Canuto, 2013b) ((Gautier et al, ch. 5 in Hockman (2015)).
The transitional nature of such a lift of world trade relative to world real GDP, even as the latter grew substantially, stemmed from the inevitable tendency of both starting to rise more in line once the intense transformation approached completion. Its extraordinary intensity also reflected a peculiar – and transitory – combination of ultra-high investments-to-GDP and trade-surplus-to-GDP ratios in China with large current-account deficits of the U.S. (Canuto, 2009).
More recently, China has initiated a rebalancing toward a new growth pattern, one in which domestic consumption is to rise relative to investments and exports, while a drive toward consolidating local insertion in GVCs to move up the ladder of value added is also to take place. That rebalancing has been pointed out as one of the factors behind the recent global trade slowdown, given China’s weight in the world economy and a recent trend of “import substitution” as illustrated in Figure 4.
Figure 4
China’s Share of Imports of Parts and Components
in Exports of Merchandise
Source: Constantinescu et al, ch. 2 in Hoekman (2015)
Advanced countries are becoming services economies
While both the GVCs’ rise and growth-cum-structural-transformation – especially in China – were taking place, with corresponding impacts on the landscape of foreign trade, advanced – or mature market – economies maintained a steady evolution toward becoming services economies – a trend maintained after the GFC. Lower GDP shares of the value added in manufacturing have accompanied rising shares of employment in services (Figure 5).
Figure 5
Global manufacturing and employment in services

Source: Institute of International Finance, “The rise of services – what it means for the global economy”, December 15, 2015.
Both supply and demand factors explain such trends in advanced economies. On the supply side, beyond the higher pace of increases of productivity in manufacturing than in services (with correspondingly different rhythms of reduction in labor requisites), not only did the relative prices of manufactured goods fall, but a substantial part of local production was also off-shored as a result of GVCs and the incorporation of cheaper labor from areas previously out of the market economy world. On the demand side, one may point out both a higher income-elasticity of demand for services – reinforced by aging of the population – and to technology trends favoring “software” vis-à¬-vis “hardware” – or “intangible” relative to “tangible” assets – as leading to an increasing weight of services in GDP and employment (IIF, 2015).
Those evolutionary features of supply and demand would also be valid for emerging market and developing countries – even if, as suggested in the upper half of Figure 5, they were partially mitigated in China and other Asia/Pacific countries by sucking manufacturing activities from other emerging market and developing economies. In any case, given the state of current technological trajectories, rising shares of services throughout would imply an anti-trade bias, given a still higher trade-propensity of manufacturing.
IIF (2015) goes as far as to argue that this has already brought consequences for the global business cycle, rendering it less influenced by swings in manufacturing output, with shock transmission from advanced economies increasingly taking place via trade of services among themselves and more weakly to manufacturing-dependent emerging market and developing economies. This would be one of the factors behind the abrupt decline of the world trade elasticity and of the recent decoupling of growth between recovering advanced and decelerating emerging economies.
Has the window of opportunity of developing via trade integration narrowed?
World trade may well live through a new era of rise relative to GDP (Hoekman’s introduction in Hoekman (2015)): on-going technological trajectories may deepen the fragmentation and increase the tradability of services; new vintage trade agreements – including possible TPP and TTIP (Canuto, 2015b) – are giving special attention to restrictions on trade of services. In fact, the content of services in current foreign trade transactions has already been higher than what gross trade figures display (Canuto, 2014b).
Another question is what lies ahead in terms of growth opportunities for non-advanced economies through foreign trade given the lines of evolution of the latter along the lines here described, one in which the factors that led to the “peak trade” seem to have exhausted. The nature and height of domestic policy challenges have changed substantially in a three-fold way:
First, China is in a league of its own and its rebalancing-cum-upgrading will condition other emerging market and developing economies. If it lets low-skill labor-intensive manufacturing activities go, a new wave of further GVC dislocations may open opportunities for countries currently endowed with cheap and abundant labor. On the other hand, its densification of local parts of GVCs will represent a competitive challenge to medium-range manufactures produced in other middle-income countries. The net result will also depend on the leakages outward of its domestic demand as it rebalances toward a more consumption- and service-oriented economy.
Second, the directions taken by technological trajectories and aggregate demand in advanced economies seem to point toward a broad alteration of the balance of locational advantages for production fragments, decreasing the weight of labor costs and augmenting the relevance of local availability of other complementary intangible assets. A “double whammy” on production and exports of non-advanced economies may take place: a partial reversal of off-shoring and a slower growth of outlets for their typical exports.
Third, the bar, in terms of what it takes to countervail that double whammy (improvements of the local business environment and transaction costs, quality of economic governance and other conditions favorable to accumulation of intangible assets) has been raised. Nonetheless, provided that such bar is reached, the local provision of – embodied or disembodied – services complementary to those produced or used in advanced economies may flourish. This will be the case, e.g. of natural resource-rich countries that manage to develop related intangible assets in terms of applied-science capabilities.
The run-up to “peak trade” was one of primarily exploring complementarities within GVCs to substitute for existing producers. The post-peak trade era may well be one of building complementarities.
* Written from my notes for a presentation at “The role of the US in the world economy”, OMFIF, Federal Reserve Bank of Atlanta, 12-13 November 2015.
Comments Off on Has the Global Trade-Development Link Peaked?
After a exponential rise in foreign exchange reserves accumulation by emerging markets from 2000 onwards, the tide seems to have turned south since mid-2014. Changes in capital flows and commodity prices have been major factors behind the inflection, with the new direction expected to remain, given the context of the global economy going forward. Although it is too early to gauge whether the on-going relative unwinding of such reserves defenses will lead to vulnerability in specific emerging markets, the payoff from strengthening domestic policies has broadly increased.
One of the landmarks of the global economy in the new millennium has been the steep rise in foreign-exchange reserves held by central banks. From a total of US$ 1.8 trillion in 2000, global reserves reached a peak of US$2 trillion by mid-2014. They have declined since then (Figure 1).
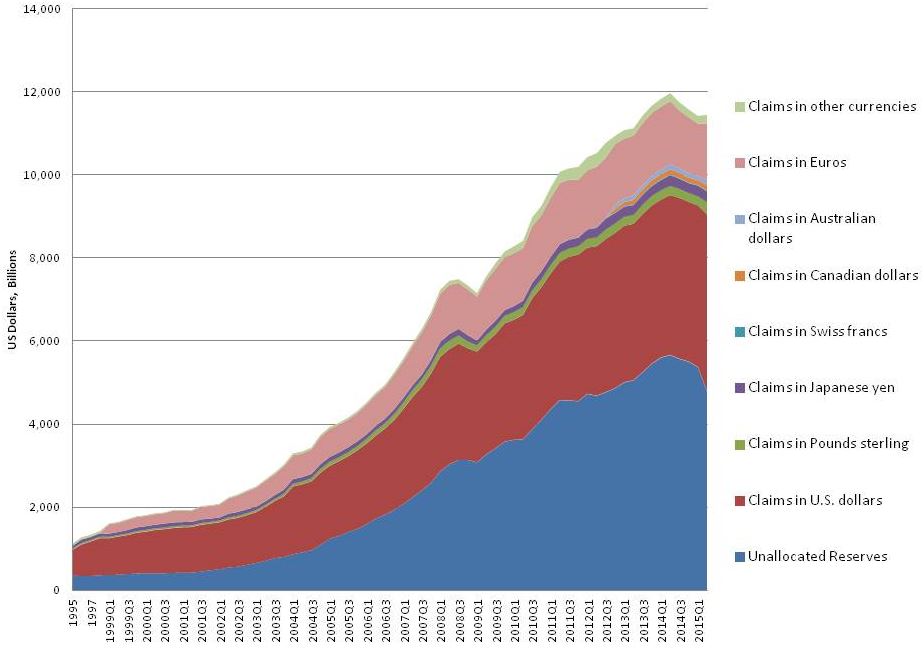
The accumulation of foreign exchange reserves by emerging market economies has been a major factor during both upward and downward phases of the tide. Although the growth of reserves in China and other non-advanced Asian economies accounted for more than half of the expansion of reserves during the new millennium, emerging economies of other regions also experienced substantial increases (IMF, Assessing Reserve Adequacy, February 2011). After a brief slowdown during the global financial crisis, the pace of accumulation by emerging market economies partially recovered, until the decline started around mid-2014 – this time also taking place in China (Figure 2).
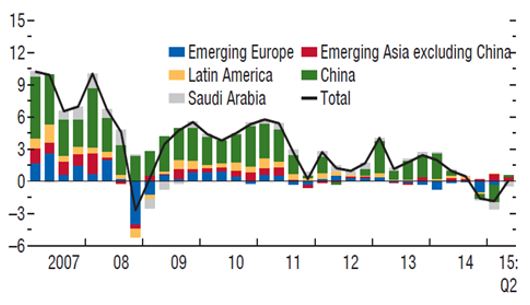
The global decrease of foreign exchange reserves by central banks since the second half of 2014, is to some extent explained by exchange rate changes, namely the euro and yen depreciation vis-à-vis the dollar, given the proportion of reserve assets denominated in the former currencies (Figure 1). In addition, changing trends in capital flows to emerging market economies and the sustained fall of oil prices – see Canuto, O., BRICS apart as oil prices plunge, CFI, April 2015 – were major contributory factors behind the decline in reserves accumulation (IMF, 2015 External Sector Report, July 2015).
“One of the landmarks of the global economy in the new millennium has been the steep rise in foreign exchange reserves held by central banks.”
Broadly speaking, capital flows to emerging market economies slowed down after mid-2014. The “taper tantrum” of 2013 and the corresponding U.S. Treasury-10 sudden yield rise – see Canuto, O., Emerging Markets and the Unwinding of Quantitative Easing, CFI, October 2013 – was followed by a gradual descent over the following year. Nonetheless, interest rate spreads started climbing again after mid-2014 for emerging market economies and other risky assets – like U.S. high yield corporate bonds. Sovereign spreads expanded considerably, particularly for commodity exporters and countries affected by rising geopolitical risks. While global liquidity conditions remained loose, the perception of a general growth deceleration in emerging market economies – see Canuto, O., Lost in Transition, Project Syndicate, December 2013 – and the strengthening U.S. economic recovery, altered investors’ relative asset demands. Although idiosyncratic, country-specific developments played a role, as the overall enthusiasm for emerging markets assets wound down.
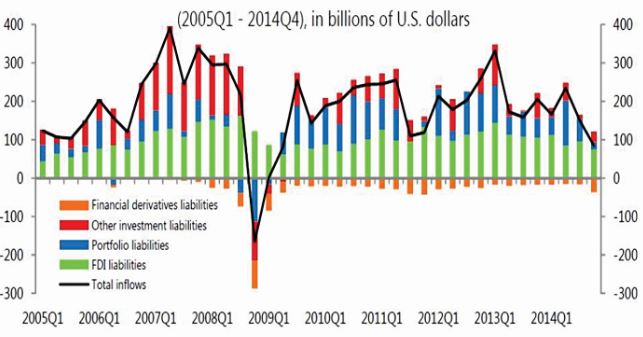
Changes in capital flows to China have been remarkable. The combination of a huge current account surplus and a private sector capital surplus from 2001 onwards, led Chinese authorities to stockpile dollar reserves from US$ 170 billion in 2000 to US$ 4 trillion in August 2014, in order to contain what would have otherwise been a major exchange rate appreciation. The real exchange rate nonetheless appreciated by around 40 per cent after 2007, while the current account surplus moved down from 11 per cent of GDP in 2000 to 2 per cent last year. Moreover, private capital flows turned negative since mid-2014, partially as a result of unwinding interest carry trades, given expectations of no further exchange-rate appreciation and interest rate reductions. According to Gavyn Davies, Financial Times, September 21, 2015:
“In the past 12 months, private sector capital outflows have proceeded at a generally orderly pace, but have still forced China to reduce its reserves by $400 billion in order to prevent a precipitous drop in the exchange rate. It was not until the PBOC announced an adjustment to its exchange rate mechanism on 11 August, triggering fears of future devaluation, that the capital outflow hit crisis proportions. During August, the reserves dropped by $94 billion on the official figures, and many analysts think that disguised intervention in futures and options markets increased the genuine figure for currency support to over $170 billion last month.”
The deceleration of gross capital inflows also happened to other emerging markets (Figure 3). Such a change was not uniform – Russia suffered a collapse of flows, whereas India retained stable gross inflows – but the tide has clearly reversed since last year for most emerging markets. Given slowly changing current-account balances, shrinking capital inflows were mostly matched by the decline in net purchases of foreign assets shown in Figure 2.
In addition, due to the plunge in oil prices the highly concentrated group of large oil exporters – 10 countries account for 75 per cent of world oil exports – were now confronted with shrinking current account surpluses and reduced foreign asset accumulation. Figure 4 depicts the resulting evolution of gross international reserves of the 29 large economies covered by the annual “External Sector Report” of the IMF. As indicated in the latest issue (IMF, July 2015, p.14):
“The pattern of slowing reserve accumulation is broad based and includes declines in international reserves holdings by some oil exporters (e.g. Russia, Saudi Arabia), reflecting reduced oil export revenue as well as the riyal’s peg to the U.S. dollar and the managed float of the ruble in place till late 2014, and to a lesser extent Malaysia. As an exception to the general pattern, in Switzerland, strong capital inflows and appreciation pressure starting in late 2014 led to rising reserve holdings in the context of an exchange rate floor with respect to the euro established in 2011. The central bank removed that floor in mid-January 2015, with limited intervention after end-January.”
The underlying factors behind the recent reversion in capital flows and reserves accumulation by emerging markets are expected to remain in place in the near horizon. Quantitative easing (QE) policies in the Eurozone and Japan are not expected to create a liquidity “push” factor for capital flows to emerging markets commensurate with that of the U.S. QE. Furthermore, global economic prospects as envisaged by the latest IMF’s World Economic Outlook point to a slight pick-up in growth for advanced economies, whereas emerging market and developing economies are expected to exhibit further growth deceleration. After mid-2014, most countries facing depreciation pressures against the rising U.S. dollar have opted to not spend reserves on a large scale to sustain their currencies, which favors the likelihood of future current-account adjustments to the new reality of capital flows. Nevertheless, the realignment of current-account balances is expected to happen gradually, while it is highly possible that net capital outflows will correspond to some extent with the depletion of reserves for some time going forward.
What about the adequacy of emerging markets reserves? They are costly to hold, as they usually imply a negative carry trade, with yields on reserve assets typically lower than interest rates paid on outstanding long-term debt and/or opportunity costs of frozen capital. Therefore they must serve some purpose. Given that reserve levels are certain to fall, could this inadvertently result in inadequately low levels?
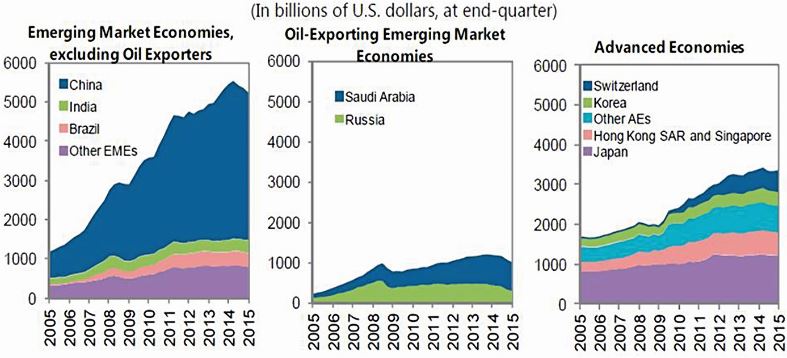
Foreign exchange reserves are stored for several reasons, as illustrated by reserve managers in their responses to a survey conducted by the IMF (Assessing Reserve Adequacy, February 2011). Apart from savings for future generations (as is the case when Sovereign Wealth Funds are added as reserves), management of exchange rate levels, bank recapitalization costs or others – like matching domestic currency in the case of currency boards – reserves are held mostly for precautionary reasons. Monetary authorities need to keep assets readily available and liquid to address potential balance of payments needs: to serve as a buffer for liquidity needs, smooth exchange rate volatility, guard the economy against shocks and so on. Ironically, the confidence creditors place in the stability provided through the acquisition of reserves ends up reducing the spreads on the bonds issued, and therefore diminishing the negative carry trade on the invested reserves.
The heightened precautionary stance in some economies appears to be correlated with greater financial deepening and integration with the rest of the world, particularly if it holds a negative net international investment position. This has been a “hardly-won” lesson learned through the multiple experiences of “sudden stops” in capital flows and recurring crises in emerging markets and advanced economies, since the dawn of the current era of financial globalization over several decades – Smith, G. and Nugee, J.,
The Changing Role of Central Bank Foreign Exchange Reserves, OMFIF, 2015.. In effect, notwithstanding the necessity for reserves accumulation to avoid domestic currency appreciation in some countries, the build-up of huge piles of foreign exchange reserves depicted in Figure 1 cannot be understood without being cognizant of the increasing weight attributed to precautionary motives.
What are the adequate levels of reserves for any given country remains an elusive question. The IMF (Assessing Reserve Adequacy-Specific Proposals, April 2015) proposes adequacy considerations by types of economies, differentiating them in accordance with financial and economic flexibility and degree of market access. Traditional benchmarks – import cover, ratios of reserves to short-term debt, ratios of reserves to broad measures of money, or combinations of those – are often used by analysts, but they require further country-specific considerations. Models of optimal reserve estimation – like the one developed by O. Jeanne and R. Rancière, IMF Working Paper WP/06/229, 2006 – attempt to balance avoided economic costs (in terms of output and consumption potentially lost) with the opportunity costs of storing reserves, and also takes into consideration degrees of risk aversion. As all this remains a work in progress, precaution tends to favor the retention of reserves above such indicators to ensure there is a reasonable buffer in place.
Notwithstanding the difficulties in assessing the extent to which the on-going dwindling of foreign exchange reserves will result in individual emerging economies becoming too vulnerable, one can expect a relative weakening vis-à-vis the ascent phase until mid-2014. Another unambiguous takeaway is the need to be cognizant of the fact that foreign exchange reserves are not the only defense a country may have against shocks. Sound macroeconomic and prudential policies are the ultimate determinants of a country’s resilience to both endogenous and exogenous shocks..
Reserves are likely not enough to counter sudden capital outflows and crises, sooner or later, in the presence of high and unsustainable public debt, persistently high inflation due to inadequate monetary policy, currency misevaluation, and deficient financial supervisory and regulatory frameworks that prove ineffective to curb contingent risks from the financial sector. High volumes of reserves may partially compensate for policy weaknesses in some of these dimensions from the standpoint of capital holders. However the payoff for improving domestic policies has broadly risen for emerging markets in the context of the current global economic environment.
Comments Off on IMF: Whither Emerging Markets Foreign Exchange Reserves
After a exponential rise in foreign exchange reserves accumulation by emerging markets from 2000 onwards, the tide seems to have turned south since mid-2014. Changes in capital flows and commodity prices have been major factors behind the inflection, with the new direction expected to remain, given the context of the global economy going forward. Although it is too early to gauge whether the on-going relative unwinding of such reserves defenses will lead to vulnerability in specific emerging markets, the payoff from strengthening domestic policies has broadly increased.
Emerging markets foreign exchange reserves reached a peak in mid-2014
One of the landmarks of the global economy in the new millennium has been the steep rise in foreign-exchange reserves held by central banks. From a total of US$ 1.8 trillion in 2000, global reserves reached a peak of US$2 trillion by mid-2014. They have declined since then (Figure 1)
Figure 1 – World Currency Composition of Official Foreign Exchange Reserves

Source: IMF
The accumulation of foreign exchange reserves by emerging market economies has been a major factor during both upward and downward phases of the tide. Although the growth of reserves in China and other non-advanced Asian economies accounted for more than half of the expansion of reserves during the new millennium, emerging economies of other regions also experienced substantial increases (IMF, Assessing Reserve Adequacy, February 2011). After a brief slowdown during the global financial crisis, the pace of accumulation by emerging market economies partially recovered, until the decline started around mid-2014 – this time also taking place in China (Figure 2).
Figure 2 – Changes in Foreign Exchange Reserves of Emerging Market Economies (percent of GDP)
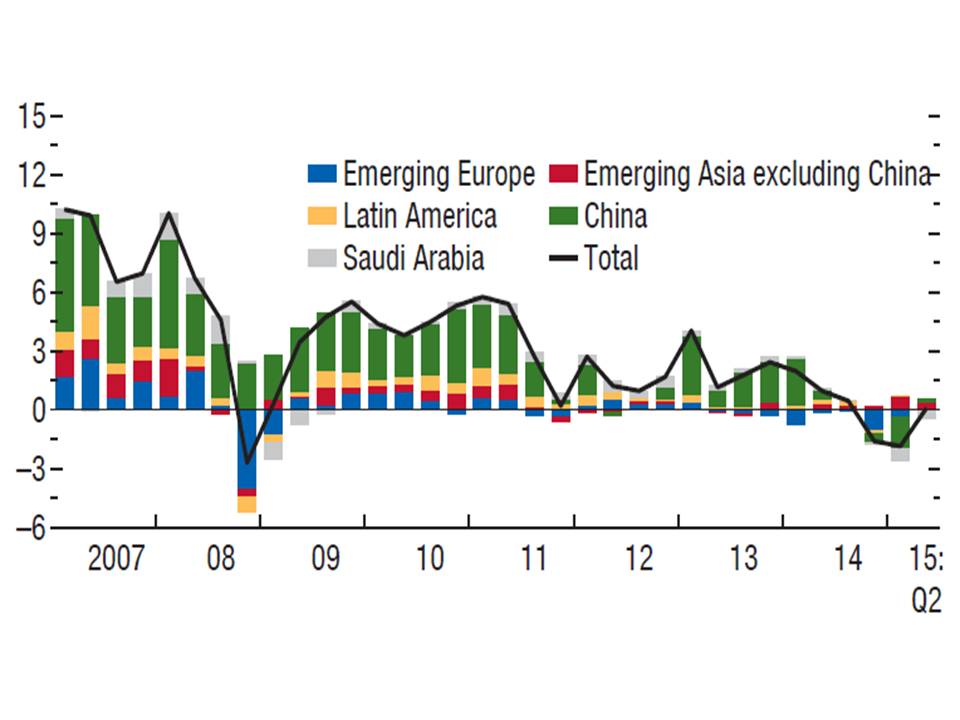
Source: IMF, World Economic Outlook, October 2015
Capital flows and oil prices explain the inflection of reserves accumulation
The global decrease of foreign exchange reserves by central banks since the second half of 2014, is to some extent explained by exchange rate changes, namely the euro and yen depreciation vis-à-vis the dollar, given the proportion of reserve assets denominated in the former currencies (Figure 1). In addition, changing trends in capital flows to emerging market economies and the sustained fall of oil prices – see Canuto, O., BRICS apart as oil prices plunge – were major contributory factors behind the decline in reserves accumulation (IMF, 2015 External Sector Report, July 2015).
Broadly speaking, capital flows to emerging market economies slowed down after mid-2014. The “taper tantrum” of 2013 and the corresponding U.S. Treasury-10 sudden yield rise – see Canuto, O., Emerging Markets and the Unwinding of Quantitative Easing – was followed by a gradual descent over the following year. Nonetheless, interest rate spreads started climbing again after mid-2014 for emerging market economies and other risky assets – like U.S. high yield corporate bonds. Sovereign spreads expanded considerably, particularly for commodity exporters and countries affected by rising geopolitical risks. While global liquidity conditions remained loose, the perception of a general growth deceleration in emerging market economies – see Canuto, O., Lost in Transition – and the strengthening U.S. economic recovery, altered investors’ relative asset demands. Although idiosyncratic, country-specific developments played a role, as the overall enthusiasm for emerging markets assets wound down.
Changes in capital flows to China have been remarkable. The combination of a huge current account surplus and a private sector capital surplus from 2001 onwards, led Chinese authorities to stockpile dollar reserves from US$ 170 billion in 2000 to US$ 4 trillion in August 2014, in order to contain what would have otherwise been a major exchange rate appreciation. The real exchange rate nonetheless appreciated by around 40 per cent after 2007, while the current account surplus moved down from 11 per cent of GDP in 2000 to 2 per cent last year. Moreover, private capital flows turned negative since mid-2014, partially as a result of unwinding interest carry trades, given expectations of no further exchange-rate appreciation and interest rate reductions. According to Gavyn Davies, Financial Times, September 21, 2015:
“In the past 12 months, private sector capital outflows have proceeded at a generally orderly pace, but have still forced China to reduce its reserves by $400 billion in order to prevent a precipitous drop in the exchange rate. It was not until the PBOC announced an adjustment to its exchange rate mechanism on 11 August, triggering fears of future devaluation, that the capital outflow hit crisis proportions. During August, the reserves dropped by $94 billion on the official figures, and many analysts think that disguised intervention in futures and options markets increased the genuine figure for currency support to over $170 billion last month.”
The deceleration of gross capital inflows also happened to other emerging markets (Figure 3). Such a change was not uniform – Russia suffered a collapse of flows, whereas India retained stable gross inflows – but the tide has clearly reversed since last year for most emerging markets. Given slowly changing current-account balances, shrinking capital inflows were mostly matched by the decline in net purchases of foreign assets shown in Figure 2.
Figure 3 – Gross Capital Inflows to Emerging Markets (excluding China)
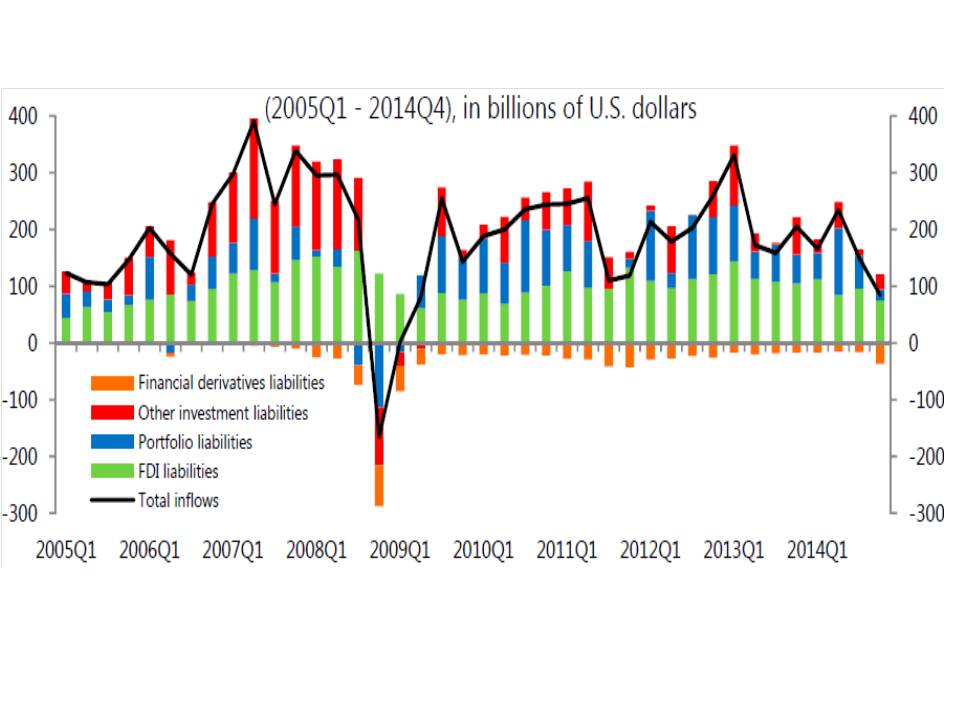
Source: IMF, 2015 External Sector Report, July 2015
In addition, due to the plunge in oil prices the highly concentrated group of large oil exporters – 10 countries account for 75 per cent of world oil exports – were now confronted with shrinking current account surpluses and reduced foreign asset accumulation. Figure 4 depicts the resulting evolution of gross international reserves of the 29 large economies covered by the annual “External Sector Report” of the IMF. As indicated in the latest issue (IMF, July 2015, p.14):
“The pattern of slowing reserve accumulation is broad based and includes declines in international reserves holdings by some oil exporters (e.g. Russia, Saudi Arabia), reflecting reduced oil export revenue as well as the riyal’s peg to the U.S. dollar and the managed float of the ruble in place till late 2014, and to a lesser extent Malaysia. As an exception to the general pattern, in Switzerland, strong capital inflows and appreciation pressure starting in late 2014 led to rising reserve holdings in the context of an exchange rate floor with respect to the euro established in 2011. The central bank removed that floor in mid-January 2015, with limited intervention after end-January.”
Figure 4 – Gross International Reserves, 2005Q1-2015Q1
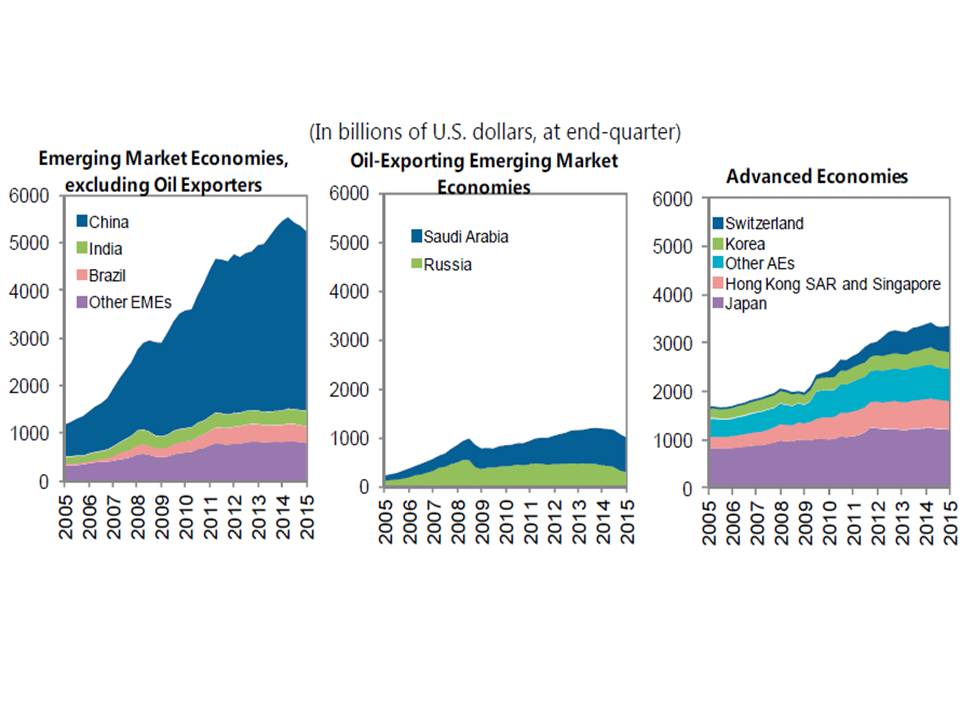
Source: IMF, 2015 External Sector Report, July 2015
Will dwindling foreign exchange reserves lead to vulnerability in emerging markets?
The underlying factors behind the recent reversion in capital flows and reserves accumulation by emerging markets are expected to remain in place in the near horizon. Quantitative easing (QE) policies in the Eurozone and Japan are not expected to create a liquidity “push” factor for capital flows to emerging markets commensurate with that of the U.S. QE. Furthermore, global economic prospects as envisaged by the latest IMF’s World Economic Outlook point to a slight pick-up in growth for advanced economies, whereas emerging market and developing economies are expected to exhibit further growth deceleration. After mid-2014, most countries facing depreciation pressures against the rising U.S. dollar have opted to not spend reserves on a large scale to sustain their currencies, which favors the likelihood of future current-account adjustments to the new reality of capital flows. Nevertheless, the realignment of current-account balances is expected to happen gradually, while it is highly possible that net capital outflows will correspond to some extent with the depletion of reserves for some time going forward.
What about the adequacy of emerging markets reserves? They are costly to hold, as they usually imply a negative carry trade, with yields on reserve assets typically lower than interest rates paid on outstanding long-term debt and/or opportunity costs of frozen capital. Therefore they must serve some purpose. Given that reserve levels are certain to fall, could this inadvertently result in inadequately low levels?
Foreign exchange reserves are stored for several reasons, as illustrated by reserve managers in their responses to a survey conducted by the IMF (Assessing Reserve Adequacy, February 2011). Apart from savings for future generations (as is the case when Sovereign Wealth Funds are added as reserves), management of exchange rate levels, bank recapitalization costs or others – like matching domestic currency in the case of currency boards – reserves are held mostly for precautionary reasons. Monetary authorities need to keep assets readily available and liquid to address potential balance of payments needs: to serve as a buffer for liquidity needs, smooth exchange rate volatility, guard the economy against shocks and so on. Ironically, the confidence creditors place in the stability provided through the acquisition of reserves ends up reducing the spreads on the bonds issued, and therefore diminishing the negative carry trade on the invested reserves.
The heightened precautionary stance in some economies appears to be correlated with greater financial deepening and integration with the rest of the world, particularly if it holds a negative net international investment position. This has been a “hardly-won” lesson learned through the multiple experiences of “sudden stops” in capital flows and recurring crises in emerging markets and advanced economies, since the dawn of the current era of financial globalization over several decades – Smith, G. and Nugee, J., The Changing Role of Central Bank Foreign Exchange Reserves, OMFIF, 2015.. In effect, notwithstanding the necessity for reserves accumulation to avoid domestic currency appreciation in some countries, the build-up of huge piles of foreign exchange reserves depicted in Figure 1 cannot be understood without being cognizant of the increasing weight attributed to precautionary motives.
What are the adequate levels of reserves for any given country remains an elusive question. The IMF (Assessing Reserve Adequacy-Specific Proposals, April 2015) proposes adequacy considerations by types of economies, differentiating them in accordance with financial and economic flexibility and degree of market access. Traditional benchmarks – import cover, ratios of reserves to short-term debt, ratios of reserves to broad measures of money, or combinations of those – are often used by analysts, but they require further country-specific considerations. Models of optimal reserve estimation – like the one developed by O. Jeanne and R. Rancière, IMF Working Paper WP/06/229, 2006 – attempt to balance avoided economic costs (in terms of output and consumption potentially lost) with the opportunity costs of storing reserves, and also takes into consideration degrees of risk aversion. As all this remains a work in progress, precaution tends to favor the retention of reserves above such indicators to ensure there is a reasonable buffer in place.
Notwithstanding the difficulties in assessing the extent to which the on-going dwindling of foreign exchange reserves will result in individual emerging economies becoming too vulnerable, one can expect a relative weakening vis-à-vis the ascent phase until mid-2014. Another unambiguous takeaway is the need to be cognizant of the fact that foreign exchange reserves are not the only defense a country may have against shocks. Sound macroeconomic and prudential policies are the ultimate determinants of a country’s resilience to both endogenous and exogenous shocks..
Reserves are likely not enough to counter sudden capital outflows and crises, sooner or later, in the presence of high and unsustainable public debt, persistently high inflation due to inadequate monetary policy, currency misevaluation, and deficient financial supervisory and regulatory frameworks that prove ineffective to curb contingent risks from the financial sector. High volumes of reserves may partially compensate for policy weaknesses in some of these dimensions from the standpoint of capital holders. However the payoff for improving domestic policies has broadly risen for emerging markets in the context of the current global economic environment.
Comments Off on Whither emerging markets foreign exchange reserves

Industrialised and developing countries have differing fiscal strategies for dealing with the business cycle. But are countries’ strategies different according to whether they are industrialised? This column presents new evidence suggesting that the picture is complex. Procyclical fiscal policies remain the norm amongst most non-industrialised developing countries, but some key developing countries have recently moved toward a counter-cyclical stance as a result of strengthening institutions.
From a theoretical point of view, procyclical fiscal policies remain a puzzle. In neoclassical models, the optimal fiscal policy stance is either a-cyclical (Barro 1979) or counter-cyclical (Baxter and King 1993). In Keynesian models, on the other hand, with the presence of sticky prices or wages, the optimal fiscal policy stance is counter-cyclical (Christiano et al. 2011, Nakata 2013). And from a risk management point of view, a countercyclical fiscal policy can be useful for at least three compelling reasons (see World Bank 2014):
First, by leaning against the wind, governments can continue to provide goods and services and to maintain public investment even in the event of a drop in public revenues;
Second, in a downturn, a countercyclical fiscal policy can help governments increase social assistance and insurance to a large number of citizens affected by more adverse macroeconomic conditions;
Third – as we witnessed during the global financial crisis of 2008-09 – a countercyclical fiscal policy can help countries stimulate the economy and cope better with the effects of a prolonged recession. It has been argued that, in the last 6 years, the underutilisation of counter-cyclical fiscal policies in crisis-ridden advanced economies has been partly responsible for their sluggish post-crisis recovery (Canuto 2014).
A significant number of authors have documented the more procyclical behaviour of fiscal policy in developing countries. Industrialised countries, in turn, tend to behave largely in a counter-cyclical or, at worst, a-cyclical fashion – except for the more recent precocious adoption of fiscal adjustment in particular countries. An idea put forward by Kaminsky et al. (2004) was that for developing countries (especially upper middle-income countries), macroeconomic policies and especially fiscal policy tend to reinforce the business cycle (the ‘when-it-rains-it-pours’ syndrome).
Evidence on the procyclical pattern of fiscal policy in developing countries was first found by Gavin and Perotti (1997), who showed that Latin American was much more expansionary in good times and contractionary in bad times. Talvi and Vegh (2000) then showed that such behaviour was far from being a trademark of Latin America alone as many other developing countries across the world espoused a procyclical fiscal policy stance. There are a number of different explanations as to why developing countries tend to behave in this way vis à vis industrialised economies. Some of the reasons most commonly found in the literature include credit constraints faced by developing countries, which would prevent them from raising money in international capital markets in bad times and would force them to adopt a contractionary fiscal policy in downturns (Gavin and Perotti 1997). Political economy considerations would also seem to play a role as good times could encourage fiscal profligacy (Tornell and Lane 1999, Alesina and Tabellini 2005).
On the other hand, Frankel et al. (2013) have suggested a recent change of pattern, with many emerging market economies ‘graduating’ out of procyclical fiscal policy. Using a proxy for fiscal cyclicality based on a time series of real government expenditures smoothed by the Hodrick-Prescott filter, the authors were able to classify the countries according to their ‘ability to graduate’ from fiscal procyclicality. A negative (positive) correlation coefficient between the cyclical component of government spending and GDP indicates a counter-cyclical (procyclical) fiscal policy stance. Countries with negative coefficients in two subsequent periods (1960-1999 against 2000-2009) were classified as established graduates, for example, as opposed to countries with positive coefficients in both sub-periods which were classified as ‘still in school’.
Two of us (Carneiro and Garrido 2015) have recently re-addressed this empirical question.1 Two implicit assumptions are made as to why countries change their fiscal stance:
That is, changes are mostly associated with policy shifts within given administrations – which may or may not be politically motivated (as incumbent administrations tend to spend more ahead of elections) – or across administrations after elections (that is, policy shifts are influenced by ideological principles).
This assumption is not uncontroversial. For instance, Rigobon (2004) argues that fiscal policy shocks drive output and not the other way around, while Ilzetzki and Vegh (2008) find causality running both ways.
Keeping these assumptions in mind, the study re-computed correlation coefficients for the fiscal cyclicality proxy for the period 1990-2011 by differentiating what happens in fiscal policy in different parts of the business cycle. It may be the case that a country’s average fiscal stance within a period differs during years of expansion compared to that adopted in years of downturn in economic activity. Countries that are, on average, procyclical in booms and downturns, would tend to exacerbate their business cycle. Those that are counter-cyclical in both, booms and downturns have a fiscal policy that contributes to stabilising the cycle.
But countries may not always be procyclical or counter-cyclical. Whenever a country exhibits an average counter-cyclical fiscal stance in booms, and a procyclical stance in downturns, other things equal, it will likely improve its medium- to long-term fiscal sustainability profile. A country that is procyclical in booms and counter-cyclical in downturns would, all else being equal, deteriorate its fiscal sustainability profile.
Figure 1 plots the value of the fiscal stance proxy in periods of expansion (when the cyclical component of real GDP are positive) versus that registered in downturns. High-income countries are those in red while developing economies are in blue.2 We identify four groups of countries and split them into four quadrants:
Other things equal, such a stance contributes to exacerbating output volatility. Not surprisingly, we find many resource-rich economies in this category. In addition, many upper middle-income countries appear in this group.
Other things equal, such fiscal behaviour improves a country’s fiscal sustainability profile.
Other things being equal, such a stance contributes to stabilising output around its long-term trend. Expectedly, most high-income countries fall into this category.
A simple visual inspection of Figure 1 seems to lend partial support to the ‘when-it-rains-it-pours’ phenomenon. Most of the countries in the upper and lower right quadrants of the chart are developing economies (in blue) and, most importantly, upper middle-income countries. In contrast to that, most of the high income countries appear on the upper and lower left quadrants with fiscal stances that largely contribute to long-term fiscal sustainability. However, it also confirms earlier findings in the literature showing that a number of developing countries have graduated from fiscal policy procyclicality (see Frankel et al. 2013).
Figure 1. Fiscal cyclicality in booms and downturns (1990-2011)

Source: Carneiro and Garrido (2015).
Some of the results in Figure 1 may seem counter-intuitive but they actually uncover the good, the bad and the ugly.
For instance, one may be surprised to see Chile, a country that has earned a reputation of fiscal prudency and good overall macro management, in the fourth quadrant. As it turns out, Chile is, on average, for the period 1990-2011, moderately procyclical in booms and markedly anti-cyclical in downturns. Its ability to sustain a strong fiscal position arises from having a system of buoyant tax revenues and the great contribution of the private sector to economic activity, so the country is able to register solid, positive fiscal balances both in booms and recessions with marked improvements in its overall fiscal stance.
Chile remains pretty much among the good guys. Compare this performance with that of Greece, for example, especially during the post-financial crisis period when it showed deteriorating fiscal balances, faster increases in expenditures relative to revenues, and poor economic performance, with an exacerbated contribution to volatility derived from a more procyclical fiscal stance. With this, there is no doubt that Greece has yet to earn enough stars to join Chile’s quadrant.
And what about the ugly? As it turns out, many resource-rich countries remain clustered in the bottom right-hand quadrant. This is where things get too ugly too quickly. For this group of countries, in good times, all is well that ends well, but as soon as things turn sour so does their governments’ ability to lean against the wind.
Carneiro and Garrido (2015) have also confirmed that institutional quality is an important determinant of a country’s fiscal stance. This is an important result that suggests that efforts to graduate from fiscal policy procyclicality need to be accompanied by policy reforms that seek to strengthen the ability of countries to save in good times to generate fiscal buffers that could be used in bad times. Initiatives such as the establishment of fiscal councils and the adoption of fiscal rules, the development of sound debt management strategies that reinforce fiscal discipline, and the strengthening of macro prudential regulations appear to be necessary conditions for graduating from procyclicality.
Disclaimer: The views expressed here are those of the authors and do not necessarily represent those of the institutions with which they are affiliated.
Comments Off on Procyclical emerging market policy: New evidence

Since last year there has been much talk of possible financial stress stemming from increased debt leverage in non-financial corporates of emerging markets economies. A recent study has brought to light some key evidence on the Latin American case (Bastos et al, 2015).
Back in 2013, I called attention to new features of international long-term private debt finance in developing countries that arose since the global financial crisis. While global cross-border bank lending with maturities at or beyond five years slowed down after 2008, bond issues have more than filled the void, explaining a rise in total flows since then. While banks in advanced economies – especially in Europe – were deleveraging, unconventional monetary policies and hype about emerging and frontier markets comprised a favorable backdrop for a massive surge in the latter’s bond issuance (Chart 1).
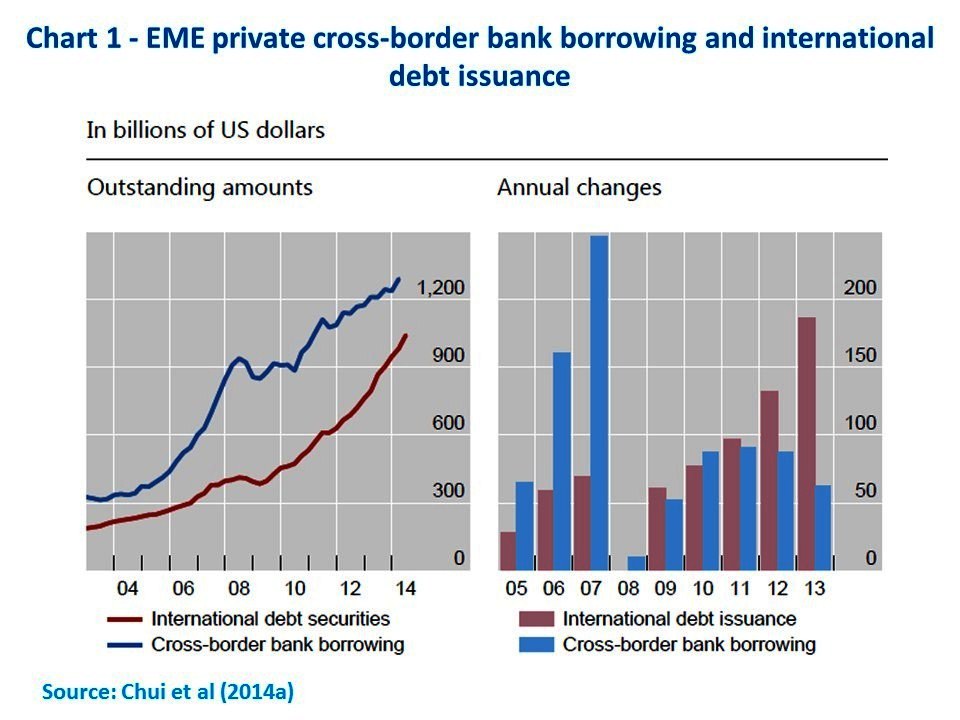
On the flipside, leverage in many emerging market countries (EM) climbed with a particular jump among non-financial corporates (Chart 2) – as highlighted in the December issue of the IIF’s Capital Markets Monitor (p.4):
“(…) the outstanding volume of EM non-financial corporate bonds has reached a record of more than US$2.5 trillion. Altogether, the increase in borrowing–by 20 percentage points–has boosted the debt-to-GDP ratio of the non-financial corporates to about 80% in emerging markets.”

As depicted in Chart 3, China stands out, not only in magnitude – the non-financial corporate sector debt moved up 48 percentage points to close of 150% of GDP between the first quarter of 2009 and June 2014 – but also because of the dominance of domestic circuits, with a rising role played by the shadow banking system. Other, EM economics (including Turkey, Brazil, Czech Republic, India and Russia among those covered in the IIF’s sample of countries) also saw their non-financial corporate indebtedness increase to levels close to 50% of GDP, with bond issuances in both foreign and local currencies (Chart 4). According to the IIF, international bond markets were at around 30% of the US$1.6 trillion issued by EM non-bank corporates since 2009.
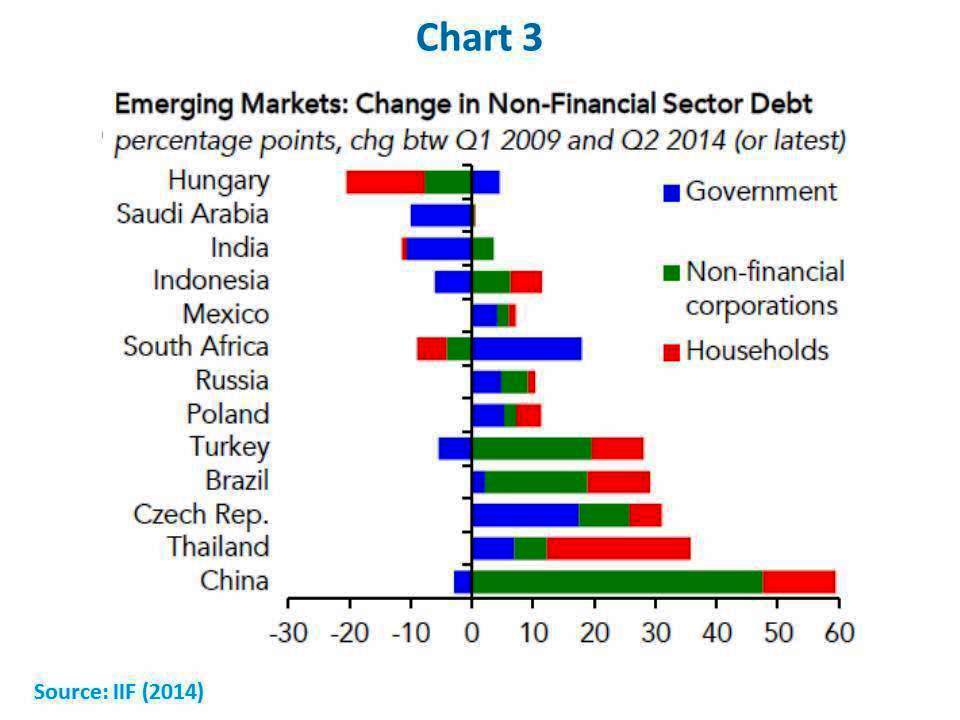
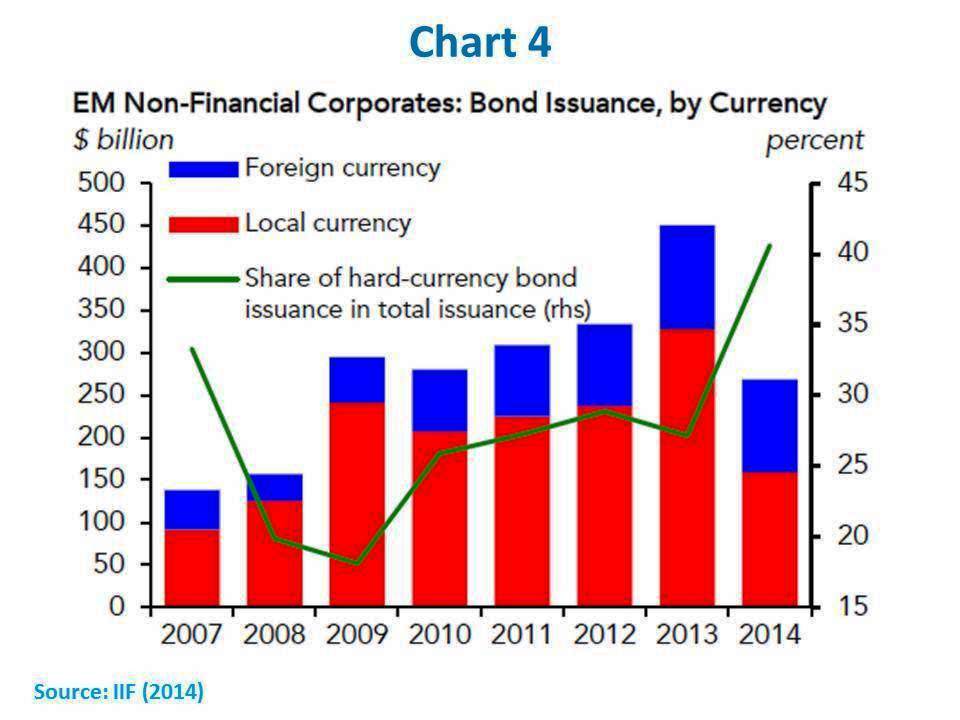
No wonder then that concerns about EM non-financial corporate debt started surfaced last year (for example see Chui et al (2004a) in the September issue of the BIS Quarterly Review).
Given the forthcoming normalization of the US monetary policy and current dollar-appreciation trends, would EM corporate balance sheets be highly vulnerable to rolling and foreign currency risks? Furthermore, wouldn’t they also be fragile given lower growth prospects for EMs as well as falling commodity prices? Might such potential fragility generate spillovers onto local banks and the international financial system, sparking damaging feedback loops more broadly?
After the global financial crisis, shortcomings in existing systems of monitoring of macro-financial linkages have been acknowledged – see Canuto and Cavallari (2013). As an attempt to spot “dark corners”, where “danger lurks”, prior to getting too close to them – to use Olivier Blanchard (2014)‘s terminology — paying attention to extraordinary surges in specific financial markets about to undergo potential shocks has become the new practice.
Latin American Non-Financial Corporate Finance: how deep are the “pockets of risks”?
In the case of Latin America, a major study by Bastos et al (2015) has just been released. Using micro-level data on bond issuances and corporate balance sheets for close to 1,000 listed non-financial companies between 2003 and 2013 in 5 major economies (Brazil, Chile, Colombia, Mexico, and Peru), the authors gauge whether non-financial corporate balance sheets have become more vulnerable to shocks and how their risk configuration has evolved.
Let me highlight here four of their major findings:
First, like their counterparts in other EMs, non-financial corporates in those 5 countries have recently increased their balance sheet leverage ratios, a result consistently found across different measures. However, that leverage is still lower than ten years ago. The surge in debt ratios since 2010 represents a rebound from previous reductions of leverage, being accompanied in some instances by a decline in non-debt liabilities.
Second, and relatedly, the active bond issuances in the past few years (Chart 5) has meant a change in the composition of liabilities, with bond issuances replacing bank loans. Latin American non-financial corporates’ debt finance mirrored the broader compositional shift in long-term private debt financing to EMs previously mentioned.
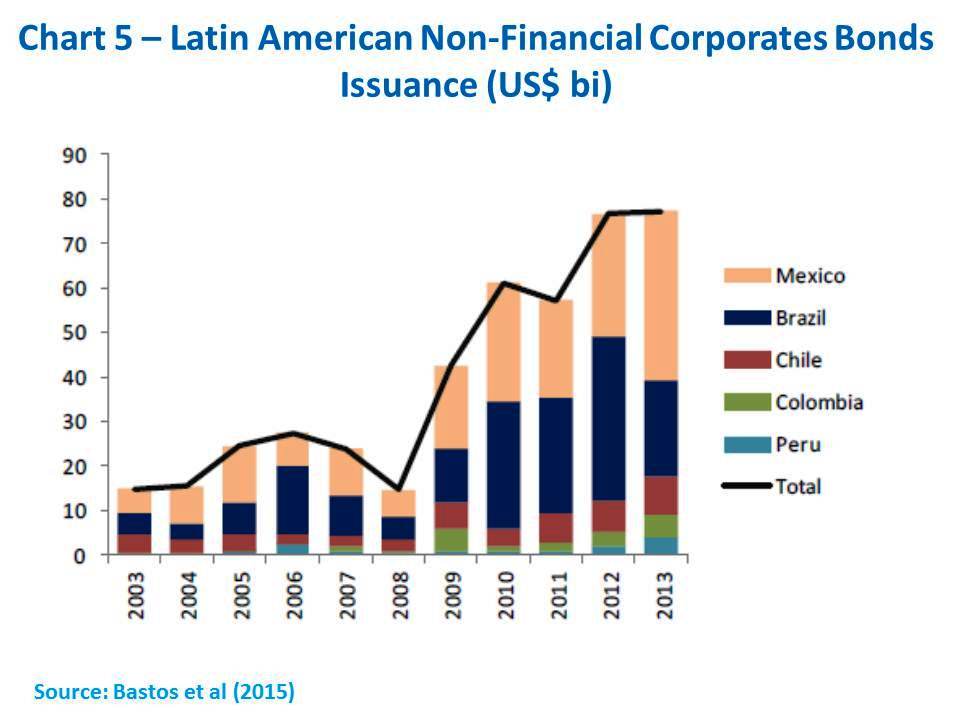
Third, such shifting debt liabilities have been accompanied by a switch in types of risk exposure. On the one hand, the average maturity of their debt has lengthened and amortization profiles are now smoother, with lower interest rates being locked-up across the yield curve, as well as floating-rate debt shares maintained at low levels. On the other, the share of foreign-currency debt has expanded, which in turn means greater exposure to foreign currency shocks.
Naturally hedged debtors (commodity and manufacturing exporters) were responsible for a substantial chunk of bond issues, but domestically-oriented sectors were also issuers. At the same time, the extent of financial hedging against foreign-currency risks is not easy to gauge.
As Bastos et al note (p.4):
“The extent of un-hedged exchange rate exposure in the corporate sector cannot be ascertained with a significant degree of confidence, given that systematic and comprehensive information on relevant offsetting variables (notably natural hedges from net export proceeds, foreign currency income from multinational operations and FX derivative positions) is not simple to construct.”
Fourth, the authors find that, although debt servicing capacity has stayed generally stable, there are areas of weakness. Those “pockets of risk” are to be found especially in parts of Mexico’s corporate sector and in Brazil. Slower earnings growth have until recently been outweighed by lower borrowing costs. However, not only the financial-cost landscape is likely to be altered as US monetary policy becomes normal in the near future, but non-brilliant prospects also lie ahead for commodity prices and economic growth in the region – see World Bank (2015) and Werner (2015).
Overall, it does not look like major financial excesses in terms of non-financial corporate debt leverage or deteriorating debt-servicing capacity have taken place. Indeed, the surge in bond issuance has served to a large extent to manage corporate liabilities. Nonetheless, even if a major financial danger does not seem to be lurking around a dark corner, given current levels of leverage and expected moves by US monetary policymakers, as well as commodity price softness, the region should not count on some sort of corporate leverage-based way out of its currently subpar economic prospects. Furthermore, there remains a blind spot in the case of non-naturally-hedged corporate foreign-exchange risk exposure.
While the overall picture for the non-financial corporate sector of those five large Latin American countries looks less threatening than what some doomsayers warn of four aspects of the Brazilian case warrant attention and monitoring:
First, the post-crisis high-profile role played domestically by low-cost public banks’ provision of finance, helping some corporates to keep low borrowing costs. That now is bound to retrench as part of the ongoing fiscal consolidation program.
Second, the weight of debt built up through foreign subsidiaries and other off-shore vehicles, either to support operations abroad and/or to escape from capital controls and taxes. In this regard, Chui et al (2004a) singled out Brazil and China as major EMs where local corporates resorted to issuance of international debt via overseas subsidiaries, including non-banking vehicles – in Brazil’s case, a regionally peculiar feature also highlighted by Bastos et al (2015). As approached by Chui et al (2014b), this raises difficulties with respect to measuring foreign debt inflows from a country’s balance-of-payments standpoint. Flows recorded as foreign direct investment in Brazil correspond partially to foreign debt issuance by subsidiaries or other offshore vehicles. It also makes it harder to discern whether bond issuance is driven by real activities rather than financial operations.
Thirdly, the massive program of foreign-exchange swaps offered by Brazil’s central bank since the “taper tantrum” of 2013 – with its notional value having recently reached around US$ 110 bi, or a bit less than 1/3 of the value of foreign reserves. Swaps are denominated in local currency, but they have become the flipside of low-cost foreign-exchange hedging for both financial and non-financial corporates. Unwinding such programs and allowing for local-currency depreciation will be a welcome move but action should be caution and gradual.
Finally, the outcome of Petrobrás on-going corporate-governance crisis will likely contain a downward adjustment on the asset side of its balance sheet. Additionally, while the process unfolds, its suppliers in the private non-financial corporate sector will remain subject to financial rollover risks, at least until the crisis abates.
All opinions expressed here are the author’s own and do not necessarily reflect those of the World Bank.
Comments Off on Latin American Corporate Finance: Is There a Dark Corner?

I am among those economists who have argued that expansive fiscal policy has been missing as a lever to support recovery in advanced economies, especially in the Eurozone — see here and here.
At the same time, I have cast doubts on recent attempts of using it to prop up growth in some emerging markets — see here and here in the case of Brazil.
In a recent debate, I was asked whether I was using a double standard, by taking an anti-austerity opinion on advanced economies, while favoring it elsewhere.
Chapter 3 of the latest World Bank’s Global Economic Prospects (GEP) sheds new light on that question. As part of a three-pronged rationale for fiscal policy, countercyclical policies may be used as a tool for macroeconomic stabilization. However, as approached in the report, two related preconditions must be in place for expansive fiscal policies to work:
First, there must be enough fiscal space available. Fiscal space corresponds to how far the fiscal stimulus can go without jeopardizing fiscal solvency and the government balance-sheet soundness (in terms of both maturity profile and dependency on nonresident creditors, which may raise rollover or liquidity risks for sovereign debt). Policies that can stress private sector balance sheets and thereby generate contingent fiscal liabilities are also to be reckoned.
Second, fiscal policy must be effective in terms of raising the level of economic activity. Such effectiveness may be gauged by the “fiscal multiplier,” i.e. the output increase resulting from one unit of local-currency increase in government consumption. The report highlights the strong evidence pointing out how the sizes of such multipliers vary in accordance with macroeconomic conditions and country characteristics.
In the world of fiscal policy, cycles are important. The fiscal multiplier tends to be smaller during expansions than in recessions, because of lesser installed capacity and unemployed labor, as well as a likely smaller share of households facing liquidity constraints.
The availability of fiscal space is also of paramount importance and is a big factor in determining the effectiveness of fiscal policy. When fiscal space is narrow, the multiplier tends to be dampened through two channels: interest rates tend to move up across the board as a consequence of perceived higher sovereign credit risks; additionally, private agents are more likely to anticipate future tax increases and in turn trim their spending.
The GEP chart below displays World Bank estimates of fiscal multipliers for a sample of Emerging Market Economies (EMEs) and Frontier Market Economies (FMEs) for different levels of fiscal spaces — measured as fiscal balances as percent of GDP — at horizons of one and two years. The conclusion follows:
“In sum, the empirical evidence presented here suggests that wider fiscal space is associated with more effective fiscal policy in developing countries. This result holds for different types of fiscal space measures using various empirical approaches.”
Chart 1 — Fiscal multipliers by fiscal space
 Source: Global Economic Prospects, January 2015 (p.131)
Note: Fiscal space is narrow (wide) when fiscal balances are low (high). Solid lines represent the median, and shaded areas around the solid lines are the 16-84 percent confidence bands.
So, how does what we now know about the fiscal multiplier/fiscal space dynamic help me respond when I am accused of applying “double standards”? Differences in cyclical stages and fiscal spaces lead to different assessments of fiscal policy effectiveness — something obvious to economists, but not necessarily something policymakers take to heart.
Back in 2012, I argued here that fiscal policy had then taken a restrictive turn in the US and in the Eurozone as a whole for reasons other than exhaustion of fiscal space. As for Eurozone countries under stress, given their dire conditions in terms of unemployment and idle capacity, the discussion above helps us understand why their own fiscal multipliers — operating downwards — ended up delivering a greater shot in the arm than many expected. To wit, the claim that fiscal austerity has been over-prescribed as necessary medicine with respect to the US and Eurozone as a single economic entity.
Contrast this with the situation in many EMEs and FMEs. As approached by the GEP, after building fiscal space by shrinking debt and closing deficits during the 2000s, most of those countries were able to use it for countercyclical fiscal stimulus during the Great Recession of 2008-09. Furthermore, they could take advantage of historically low global interest rates then prevailing. That fiscal space has not subsequently been built up again and since the era of of abnormally low interest rates is bound to end one can understand calls for caution when it comes to any move to over-extend an expansionary fiscal stance. The report suggests institutional frameworks — fiscal rules, stabilization funds and medium-term expenditure frameworks — that can help those countries widen their fiscal space and enhance policy outcomes.
The Brazilian case may be seen as one in which both cycle and space limits to expansionary fiscal policies are currently binding. Brazil’s round of expansionary fiscal policies implemented in 2012-2014, did not lift “animal spirits” as hoped. This was due not only to structural reasons, but also because of the perception of fiscal deterioration and the need for monetary policy tightening since 2013. Looking ahead, the fiscal squeeze starting to be implemented this year is also required not only to restore fiscal confidence, but also to underpin the process of upward correction in regulated prices and of exchange rate devaluation, the inflationary impact of which would lead to much higher interest rates in the absence of a support from fiscal policy – see here.
In sum, one might say that, instead of “double standards”, the asymmetrical stance of fiscal policies that I have been advocating may rather be seen as standards that make sense given different levels of economic slack and fiscal space in diverse economies.
Comments Off on Fiscal Policy: Cycle and Space Matter
International trade has undergone a radical transformation in the past decades as production processes have fragmented along cross-border value chains. The Brazilian economy has remained on the fringes of this production revolution, maintaining a very high density of local supply chains. This article calls attention to the rising opportunity costs incurred by such option taken by the country.
Moving Tectonic Plates under the Global Economic Geography
In recent decades, international trade has gone through a revolution, with the wide extension of the organization of production in the form of cross-border value chains. This extension was a result of the reduction of tariff and non-tariff barriers, the incorporation of large swaths of workers in the global market economy in Asia and Central Europe, and technological innovations that allowed modularization and geographic distribution of production stages in a growing universe of activities. International trade has grown faster than world GDP and, within the former, the sales of intermediate products has risen faster than the sale of final goods.
The geography of industrial production has changed dramatically, with unskilled labor-intensive sectors moving out of advanced economies rapidly. Although the “hollowing out” of such jobs in advanced economies may have been, to a greater or lesser extent, determined by biases in trends of technological progress, the transfer of unskilled labor-intensive segments of supply chains has been part of the explanation. On the other side of such transfers, low-income countries have experienced rapid economic growth processes stemming from the structural transformation that has resulted from the large-scale migration of workers from subsistence to modern tradable activities.
Sharp changes in relative prices in the global economy have accompanied this process. While labor prices fell – as well as prices of manufactured products, according to their labor intensiveness – prices rose for natural resource-intensive goods, following an increase in demand coming from economically-growing low-income areas.
The logic of value chains was also extended to other sectors beyond manufacturing. Producers are opting for less self-sufficient, in-house capacities, choosing to sub-contract activities that are not essential to their business. This is also one reason for the expansion of services in GDP accounting in recent decades. Commodity chains have increasingly relied on sophisticated services both upstream and downstream. The content of services embedded in industrial products has also increased. Additionally, technological innovations have increased the marketability of various services, as expressed in the growth of international trade in services.
The opportunities and challenges of the international industrial division of labor are reconfigured in this new world of cross-border value chains. For low-income economies, one can say that it has become relatively easier – especially for small countries – to increase their local industrial production, since joining the market through labor-intensive segments of existing chains allows them to circumvent the limits of (a lack of) scale and sophistication in local markets. Nevertheless, such entry is volatile and can easily be undone and relocated soon after any adverse signal comes out. This process of entry – with easy exit – corresponds to a window of opportunity for local accumulation of skills and a leap forward.
For high- and middle-income economies, in turn, it has become increasingly difficult to maintain competitiveness in those segments. It should also be noted though that some technological trajectories currently in early stage – such as 3D printing – may require the substitution of qualified for unqualified labor in a wide range of segments of existing chains, partly reversing the spatial dynamics described above.
Middle-income economies are also facing a new landscape in other aspects. On the one hand, technological spillovers, productivity increases, and wider market access are now facilitated via entry at points that require intermediate sophistication levels within existing value chains. On the other, the consolidation of existing value chains raises the stakes in terms of the competition for core positions. For consolidated and mature branches, creating new chains and challenging established ones is the only alternative.
Foreign Trade Statistics and Value-Added Trade
The statistics of exports and imports no longer serve as a gauge of how countries’ foreign trade affects their allocation of factors of production. With the fragmentation of production systems and the back-and-forth cross-border movement of products at intermediate stages, one cannot ignore multiple accounting, either within a sector or in other branch in which they serve as inputs.
Only recently have data on sector-specific added-value country exports started to become available, thanks to a joint OECD-WTO initiative, (OECD/WTO, 2013) where one can find information on sector-specific gross exports minus imports in the same industry and from other lines of the input-output matrix of a country. Results are often very different from those visualized with statistics of gross exports and imports (Canuto, 2013).
For example, the database of trade in added value of OECD/WTO reveals that once the content of services embedded in other branches is taken into account, international trade volumes are much larger than the 25% suggested by gross trade figures – see Figure 1. They account for over fifty percent of total exports in countries like the US, UK, France, Germany and Italy and, perhaps surprisingly, almost a third in China. In fact, as shown in Hoekman & Jackson (2013), domestic and imported services appear embedded in the various branches of manufacturing, mining and agricultural sectors. It follows that the quality of services available to a country’s industrial sector, whether domestic or imported, greatly affects the country’s competitiveness.
Value-added trade statistics also give a view of how Brazil maintains a level of density in its chains of domestic industrial production above what one would expect in the case of a middle-income country. Figure 2 shows ratios of value added (VA) relative to gross exports (X) in various countries. China provides a particularly telling comparison point against Brazil. While the weight of commodities partly explains why the ratio is so high in the case of the total export bill (left side), the index is also very high in most manufacturing branches, as illustrated on the right side of Figure 2 in the case of machinery and equipment (World Bank, 2014).
Brazil has remained outside the process of cross-border production fragmentation. There are few exceptions, like Embraer, which operates in the center of its own global value chain. The automotive Mercosur regional network also seems to escape the rule, but it is in fact the extension of a chain with a low degree of integration with the rest of the world. High coefficients of VA to X demonstrate local levels of production far above what one would expect for a middle-income economy with average levels of technological sophistication.


Opportunity Costs of the High Density of Brazilian Production Chains
Geographic distances from advanced economies – reduced but not completely annulled by revolutions in transport and communications – partially explain why Brazil’s production-chain density remains well above its notional counterfactual. After all, in many branches, cross-border production chains are regional and focus on dynamic markets of high-income countries (Asia, Europe and North America).
However, the Brazilian deviation from its notional density levels also reflects trade and local-content policies, which have remained more prevalent than in most of Brazil’s peer countries including China (World Bank, 2014). Likewise, Brazil’s precarious logistics and high transaction costs in trading across borders are incompatible with the logic of cross-border value chains.
Eliminating these factors would reduce the deviation between actual and notional densities, leading to a corresponding closure of less competitive production chain segments and a rise in import substitution. On the other hand, the businesses left standing would be more competitive and final products would have lower production costs and/or higher quality. Furthermore, in dynamic terms, such as when the adjustment implications of changing chain densities unfold, gains would increase by dint of greater technological spillovers and market extension relative to the current scenario.
The technological dynamics and cost reductions in the global economy due to the increase in value-chain fragmentation have been significant, increasing the opportunity cost of the ongoing gap between actual and notional production densities. For example, despite rising trade barriers, Mercosur’s coefficient of imports from China keeps moving up. Private investors, in turn, tend to shun commitment to production lines that they see as survivors only in conditions of permanent protection.
In an economy with labor shortages and aspirations of rising worker purchasing power, productive activities would be strengthened by the availability of cheaper local consumer goods and equipment, as wage and investment costs would be lower. That would facilitate the creation of global value chains with a core in the country in natural resource-associated industries, where there clearly exists a greater scope.
Of course, public policy support remains essential. However, this support should be more horizontal in nature, rather than further encouraging the ongoing high density of production chains
Comments Off on The High Density of Brazilian Production Chains
By Otaviano Canuto.

Brazil’s macroeconomic management will face four major immediate challenges in the near future. The response to them will be strengthened if we could have some indication of how to steer the Brazilian economy back to a growth route.
A first major challenge will be the upward realignment of domestic regulated prices, in a context of still high inflationary pressures. Since the second half of 2012, inflation has remained near or above 6.5 percent p.a. — the upper limit of the annual inflation target. The main inflationary factors in recent years — services and non-tradable goods — appear to be slowing down at the margin, but the ongoing correction of regulated prices, until recently repressed, has still some way to go (Chart 1).
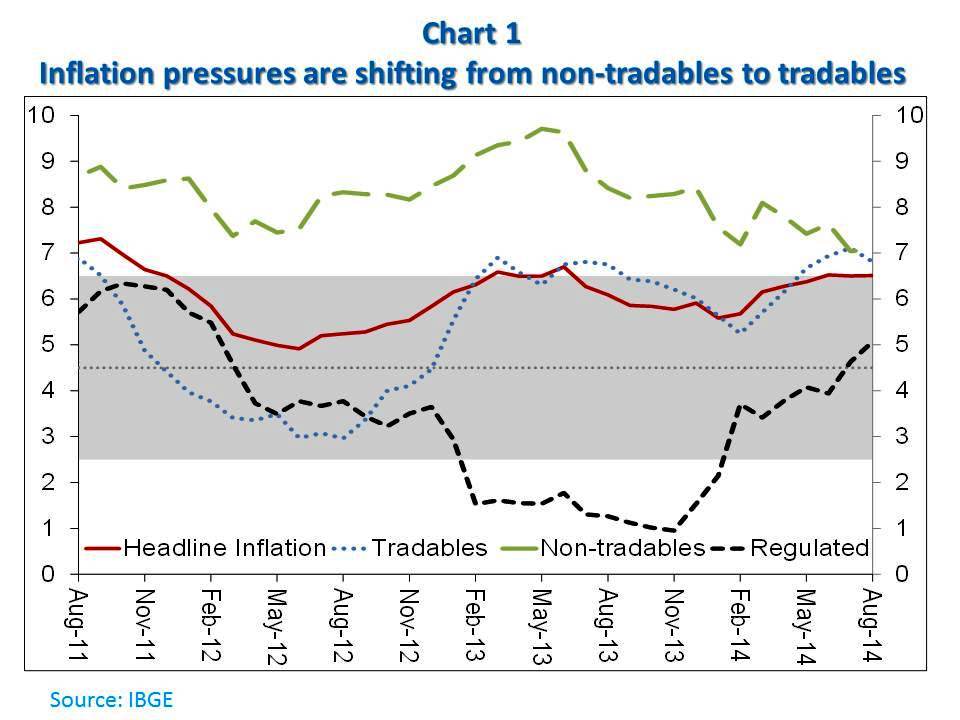
Difficulties to decelerate inflation will be compounded by another potential challenge, namely, the pressure toward local currency depreciation that will likely accompany the process of normalization of U.S. monetary policy, with some increase in their interest rates expected for 2015. There will be at least higher volatility of interest and exchange rates, which tends to lower the attractiveness of Brazilian securities. In fact, one can assume that the Brazilian Real would have already reached more devalued levels today were it not for the foreign currency hedge transactions massively offered by the Central Bank since the “taper tantrum” of last year (the notional value of which has reached US$ 100bn).
Flows of foreign direct investment have remained stable since 2011, but they have no longer been sufficient to cover the current-account deficit of the balance of payments since last year, when the latter surpassed a range of 3.5 percent of GDP (Chart 2). To the extent that some retrenchment in portfolio capital inflows takes place, the pressure toward foreign-exchange devaluation will be stressed. The challenge then will become an opportunity for partial recovery of the industrial competitiveness eroded in recent years, as long as the effects of nominal foreign-exchange devaluations are not unwound by a subsequent acceleration in inflation.

The third challenge will be to respond to such inflationary pressures without resorting to massive doses of monetary tightening in addition to the one already in effect, while those adjustments in relative prices (exchange rate and regulated prices) happen. After all, the Brazilian economy is in its fourth year of low growth, with industrial production remaining stagnant at levels close to 2010 (Chart 3). Bank credit has not slowed more sharply only because of the expansion of public banks’ portfolios, which today exceed in size the total lending by private banks (Chart 4).
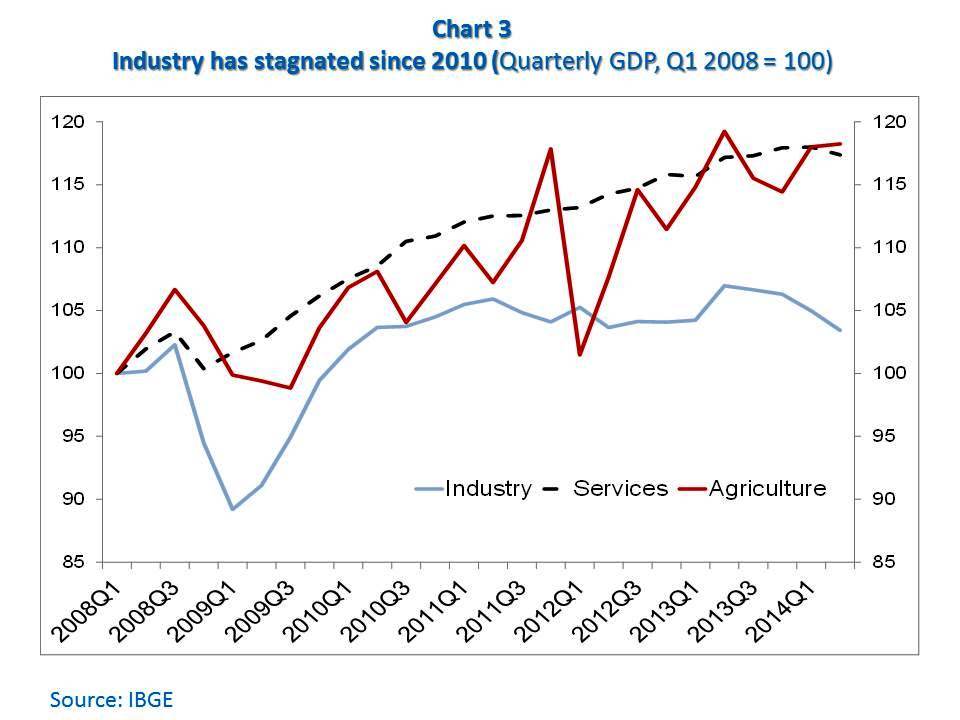
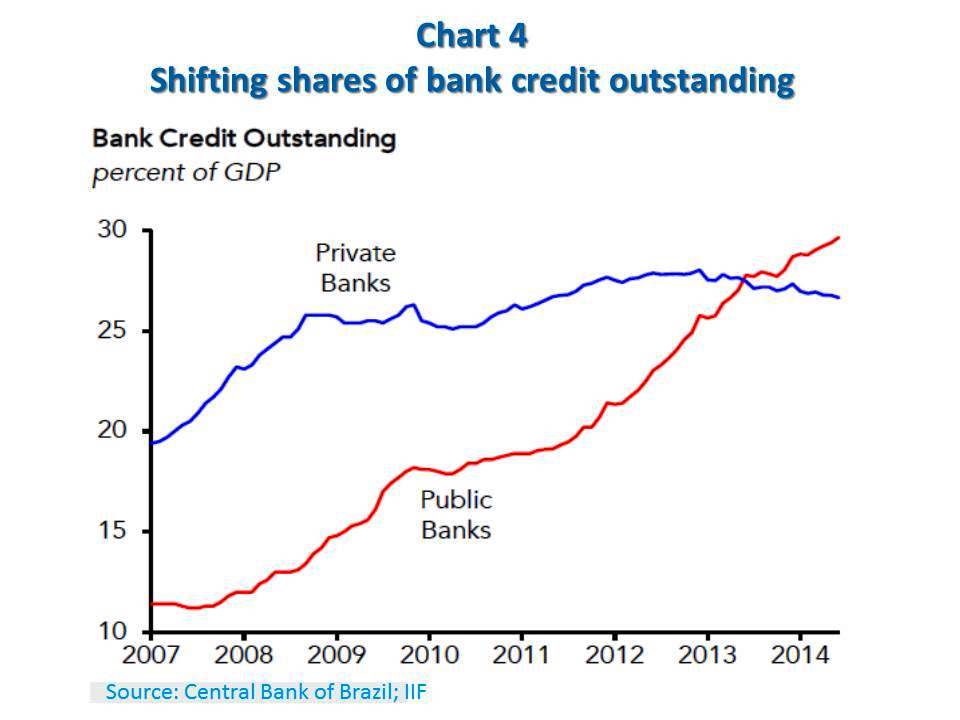
Fiscal policy will be the key to addressing this challenge, insofar as it can reduce the burden of responsibility placed on monetary authorities. The primary public sector surplus has shrunk since 2012 and is unlikely to reach its goal for this year (Chart 5). A reversal of fiscal — and para-fiscal, through the injection of funds by the Treasury on public banks — expansionism would ease the requirement in terms of higher interest rates to control inflation.
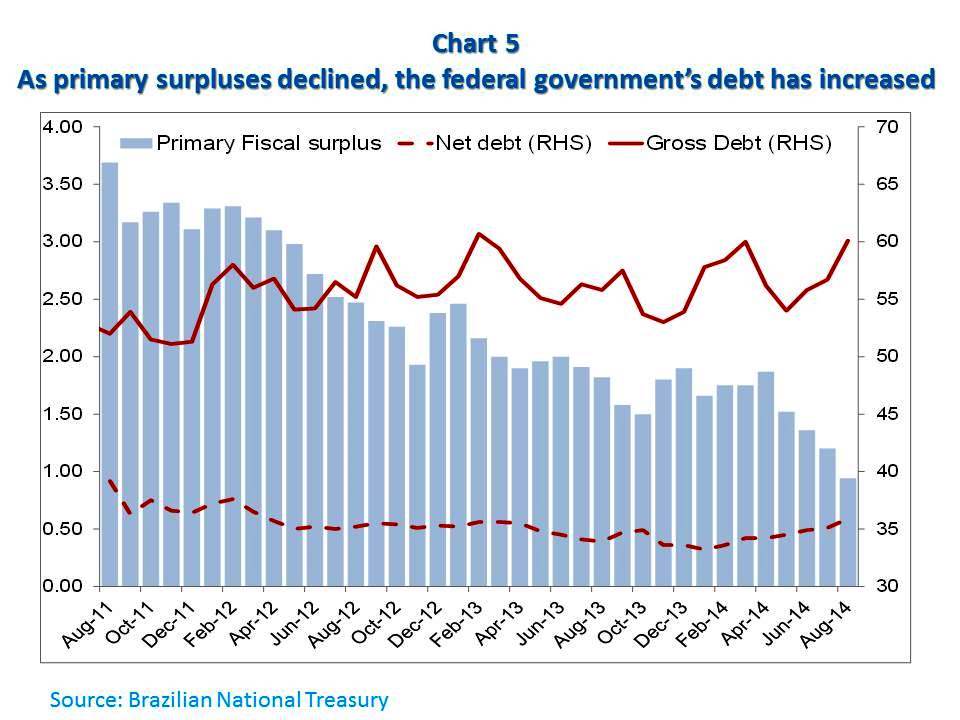
Such review of the fiscal stance would meet the fourth great challenge, which is to reverse the perception of fiscal deterioration of recent years, thus mitigating the risk of losing the “investment grade” ratings of Brazil’s public debt. Given the limits to very ambitious changes in fiscal targets in the short term, due to inflexibility in the current structure of public expenditures, establishing multi-annual targets for primary balances and/or caps on public spending to GDP ratios would enhance the credibility of the fiscal adjustment effort.
Strictly speaking, if the answers to these four major immediate challenges are taken as credible, improvements in confidence and expectations of private agents will facilitate the crossing of turbulences. This will be the case particularly if private investments, in decline since the middle of last year, start to reflect a higher optimism about future macroeconomic performance.
Therefore a plan to a return to growth must be presented upfront. There is now a widespread understanding that systematic increase in Brazil’s “total factor productivity” (TFP) will be needed from now on if the growth-with-social-inclusion that prevailed in the 2000s is to return. For this to happen, more and better continuing education of workers will be an obvious necessary condition. However, there are also other areas where Brazil can find sources of increased TFP while the educational improvement materializes.
The first is infrastructure. In addition to its role as gross fixed capital formation, sustainable investments in infrastructure would alleviate bottlenecks that have become increasingly tight in the recent past. The reduction of wasted resources, as a consequence of such investments, would cause not only widespread productivity gains, but also more robust private investment in other sectors. Key here will be to fine tune the division of responsibilities between the public and private sectors in the investment and operation of the various segments of infrastructure services, according to their different capacities to manage corresponding risks.
Additionally, horizontal productivity gains could be achieved through reforms in various operating parameters of the private sector, namely, those in Brazil’s business environment. For example, the annual Doing Business report, done annually by the World Bank for 189 countries, indicates that a Brazilian company today spends, according to the simulation presented in the work, 2,600 man-hours per year just to pay taxes while the average in Latin America and the Caribbean and the OECD are, respectively, 367 and 176. Building permits take 460 days in Brazil, against 225 and 143 in the latter. These and other similar cases mean that human and material resources are wasted on activities that do not generate value, something harmful to both the competitiveness of enterprises as well as, at the macro level, the TFP in Brazil.
Simplifying the tax system should be, in our judgment, an immediate priority in such a microeconomic agenda, as the bang for the buck in terms of reduction of resource waste would be significant and across the board. Improving the legal and tax framework in which the labor market operates should also be high on the agenda, as Brazil is a country where, compared to their peers in levels of per-capita income, private companies invest less in training of its personnel. Disincentives embedded in current tax and labor laws are among the reasons for such underperformance.
The foreign trade chapter of the Brazilian business environment is also noted as unfriendly to investments and technological learning. Transaction costs and difficulties to access technologies, equipment, and supplies from outside have limited the local scope for innovation, productivity increases, and competitiveness. Physical investments in logistics infrastructure will bring a positive contribution in this case, but an evaluation of the costs of the complex structure of tariff and non-tariff barriers, which trade protection in the country has become is highly due.
The third area with a great potential contribution to TFP and economic growth, with effects spanning across the previous two, would be a review of public spending. For an economy with a high tax burden and proportion of public spending in GDP such as Brazil, improvements in the quality of the latter have significant direct and indirect impacts. More generally, international experience has shown how transparency, evaluation of results, accountability, and competition in public procurement reduce corruption and improve the quality of public spending. There is also evidence that the quality of public services (education, health etc.) responds positively to the presence of incentives that reward good performance. Improvements in the quality of public spending would provide gains not only as a significant part of GDP, but also as part of the production inputs used by the private sector.
Potential gains in TFP to be accrued with the review of public spending go beyond the search for more efficiency and effectiveness. To the extent that one may locate benefits and public subsidies that do not find justification in terms of poverty reduction or needs of the productive system, their elimination would make room for tax reduction or redirection of the corresponding resources.
Brazil therefore has four major short-term macroeconomic challenges and three broad areas of medium-term reform where it is possible to increase the potential for economic growth. Fixing the short term while launching long-term growth foundations will be essential in retaking the course of sustainable development and social inclusion. After all, it is easier to navigate any turbulence when the destination is in sight.
This text is based on a presentation by the author at the Brazil-US Business Council (October, 30). A shorter version will appear at the November Bulletin of The Official Monetary and Financial Institutions Forum (OMFIF ). The opinions expressed here are the author’s and should not be attributed to the World Bank.
Follow Otaviano Canuto on Twitter: www.twitter.com/ocanuto
Comments Off on Navigating Brazil’s Path to Growth
The world economy faces huge infrastructure financing needs that are not being matched on the supply side. Emerging market economies, in particular, have had to deal with international long-term private debt financing options that are less supportive of infrastructure finance. While unconventional monetary policies in advanced countries in the aftermath of the global financial crisis have led to a global liquidity glut, some traditional sources of long-term finance have been strained and alternatives have not been able to adequately compensate. The threat of an eventual reversal of the global liquidity abundance makes even more urgent that emerging market and developing countries find new sources to tap for long-term funding, if they are to fill their infrastructure gap and keep growing. Domestic institutional investors and strengthened local long-term debt markets will be key in that regard. Official development banks can be of help to the extent that they focus on their potential “additionality.”
The world economy faces huge needs of infrastructure finance…
Last year, a report by McKinsey Global Institute (2013) estimated that, in order to realize its potential global growth from then to 2030, the world would have to invest in infrastructure (roads, bridges, ports, power plants, water facilities, and other forms) in the range of $57-67 trillion, depending on three different methodologies (Chart 1). To give an idea of what a tall order such a challenge will be, the report notes that the lower bound of the range corresponds to nearly 60 percent above the amount spent in the last 18 years and it is larger than the estimated value of today’s infrastructure.
Source: McKinsey (2013).
The share of infrastructure finance requirements in emerging market economies (EMEs) in those figures corresponds to 37 percent. As those estimates do not embed “development goals” beyond where emerging market and developing economies are nowadays, as well as additional expenditures associated with adaptation to climate change and sustainability needs, they may be considered a lower bound (Swiss Re and IIF, 2014). The World Bank estimates that these countries need to invest in infrastructure at a rate of an additional $1 trillion per annum through 2020, just to keep pace with the demands of urbanization, growth, climate change, and global integration.
… but the financing gap is yawning
Several factors have been leading to a shortfall of infrastructure finance supply, including in advanced economies. Public sector funding has faced stringent conditions. With a few exceptions — like China — most advanced and emerging market economies have become more fiscally constrained in the last few years, as counter-cyclical fiscal policies have reached their limit, either for political and/or debt sustainability reasons. On the private sector financing side, there is an ongoing transition toward a new configuration of infrastructure finance that has left a void: while banks have been retrenching, their replacement by non-bank institutions, wherever feasible, has been inadequate.
Some combination of bond issuance and bank lending is what usually works best in debt finance of greenfield investments in new projects and the creation of new productive assets. Banks are better equipped to address issues of information asymmetries, particularly at the early stages of project design in cases of complex financing needs — like infrastructure — whereas the arms-length relationship typical of long-term bond issues and institutional investors is more appropriate for extending and consolidating investment financing. Infrastructure assets are appropriate investments for pension funds, insurance companies, and other long-term financial institutions (mutual funds, sovereign wealth funds, etc.) because they tend to match their long-term liabilities, provide inflation-protected yields, and have a lower correlation to other financial assets. A significant presence of mature long-term debt markets and institutional investors as ultimate asset holders enhances the risk-transfer and risk-transformation functions of financial intermediation as a whole and can make the system more stable.
The problem is that the financial crisis has been followed by a bank retrenchment from the field, without non-bank institutions filling the finance gap. The weight of banking can be gauged by its share in global project finance (Chart 2). In that context, infrastructure financing by banks has been curtailed as part of a deleveraging process which is still in course.
This is particularly the case for European banks, which had traditionally played a significant international role in infrastructure financing prior to the global financial crisis. Their balance-sheet repair and capital-ratio adjustment, since the euro-zone crisis — as depicted in Chart 3 — has been obtained mainly by retrenchment on the asset side of their balance sheets, by unwinding existing positions and shunning new commitments.

Such propensity to retrench has been widespread among banks in crisis-afflicted countries, given the higher levels of balance-sheet risk aversion. Remaining uncertainties about the crisis recovery, coupled with prospective regulatory changes (e.g. Basel III) penalizing liquidity and maturity mismatches in deposit-taking institutions, have led banks in general to reduce leverage, shorten finance terms, and raise counterparty requirements across the board.
Source: IIF
On the other side of the finance spectrum, had the financing previously supplied by banks been replaced by pension funds, insurers and mutual funds, their portfolio allocation to infrastructure debt would currently correspond to 12.5 percent; in reality, the actual current allocation is less than 1 percent of global pension fund assets (Swiss Re and IIF, 2014). To be sure, as noted above, bank and non-bank infrastructure finance are not perfect substitutes, given their distinctive abilities and willingness to deal with different risks along an investment cycle — as illustrated in the revealed preference of non-banks toward “brownfield” relative to “greenfield” investment projects. However, given prevailing trends in banking, it is no wonder that so much attention has been dedicated to what it will take to raise “infrastructure as an asset class” — see the 10-point agenda outlined by IIF (2014) — and raise the profile of non-bank institutions as a necessity in order to fill the infrastructure finance gap.
EMEs have faced a cross-border infrastructure finance drought amidst a liquidity glut…
Has the relative abundance of capital flows to EMEs since 2008 meant that they have been spared from the challenges associated with the yawning infrastructure finance gap? Despite massive foreign capital inflows to EMEs in recent years (Chart 4), it is doubtful that these will constitute a sufficient solution to the EMEs’ infrastructure finance gap. While foreign direct investments have maintained an exuberant pace and can play a significant role in funding infrastructure investments, long-term debt finance — fundamental to many projects — has not performed up to the needed levels.
There is a relevant underlying change of composition in the debt component of those heavy capital inflows. International long-term debt flows to developing countries — bonds and syndicated bank lending with maturities at or beyond five years — fared well indeed from 2000 to 2012, reaching a fourfold increase in nominal terms at the end of the period, despite a blip in 2008-09 (Canuto, 2013a). However, this rise comes with an important caveat: lending from foreign banks has declined in absolute terms since 2007, a trend hardly reversible in the foreseeable future. Bond issuance has been primarily used to refinance existing debt at lower costs, or simply to replace syndicated lending that was not being rolled over.
Bond purchases surged after the crisis, reflecting a combination of unconventional monetary policies in large advanced economies, as well as hype about growth prospects in developing countries (Canuto, 2013b; 2013c). However, not only are bond flows experiencing the effects of the current unwinding of those two factors, but they have been imperfect substitutes to bank’s infrastructure financing via long-term lending (Canuto et al, 2014). The mere abundance of international liquidity of latter years has not been conducive to an equivalent creation of new productive assets in developing countries.
As for cross-border asset acquisition by institutional investors and other long-term financial institutions, assuming that the above-mentioned agenda of tasks for the full development of infrastructure as an asset class is accomplished, one should keep in mind the competition for infrastructure investments in home (advanced) economies, in a context of perceived risks unfavorable to EMEs.
On the other hand, if hypotheses of secular stagnation in some advanced economies are right — Canuto, O., 2014 — long interest rates will remain too low to comply with retirement pension needs for a long time. In this scenario, it is worth recalling that today:
“Two particularly pernicious and inter-related challenges confront the global financial system. On the one hand, pools of trillions of dollars of savings, particularly in OECD economies, are trapped in sub-optimal investments earning poor returns. On the other, many developing countries face a serious shortage of capital, even for investments that can generate high financial and economic return. The world’s financial system fails to intermediate between the two at any scale. ” (Kapoor, 2014)
Source: IIF.
Country sample: BRICS, Turkey, Mexico, Chile, Poland and Indonesia. Note: f = IIF forecast, e = IIF estimate. Inward – Other: Other Inward Investment (mainly bank loans, but also trade credit and official lending, plus some more obscure items like financial derivatives, financial leases, etc.)
… and EMEs need to tap new sources for long-term funding
EMEs have been gradually building their own pool of sizeable long-term assets managed by institutional investors, mainly pension funds and insurance companies, totaling around $5.5 trillion as of end 2012 (Charts 5-6). Besides the increasing role these institutions are expected to play in funding infrastructure, an additional benefit is that a large base of domestic institutional investors could make infrastructure investments more attractive to foreign investors, because they will be perceived as a potential liquidity buffer in times of capital outflows.
As discussed by Canuto et al (2014), the task ahead is to develop financial vehicles that can channel EMEs long-term institutional savings into financially viable infrastructure projects. The growing share of public-private partnerships (PPP) for infrastructure projects is facilitating the development of innovative financial structures to fund these projects.
Source: Official sources and J.P. Morgan.
Local fixed-income markets, complemented by more traditional unlisted products, could fill in a large share of the remaining funding gap through infrastructure project bonds,, as long as policy makers develop the appropriate framework for issuers, investors, and intermediaries. Infrastructure project bonds are an innovation in advanced economies, but are showing growing relevance in wider markets, with several types of bonds and credit enhancement schemes being tested, depending on the variety of project (for example, greenfield, brownfield).
Source: Official sources and J.P. Morgan
The challenge for EMEs in developing these bonds is threefold. The first is building or strengthening the fixed-income market regulatory and institutional framework so that structuring, issuance, and placement of infrastructure project bonds becomes cost-efficient. Most large EMEs already have that framework in place and are in a position to support such bonds. The second challenge is to develop the appropriate credit risk enhancement instruments so that project bonds have credit ratings that are acceptable to institutional investors, generally at domestic investment grade or above (BBB-). Governments, multilateral organizations, development banks, and commercial banks should play a key role in either supporting or providing these risk-mitigating instruments. The third challenge is to implement solutions for liquidity support, such as more effective market-making arrangements, so as to attract a broad group of investors and mitigate the “drying effects” of buy-and-hold by institutional investors. The availability of markets and instruments that allow hedging from exchange-rate risks will also help.
Public policies and the direct engagement of government and development agencies in making long-term vehicles financially viable are critical for their success. Furthermore, the development of an active infrastructure project bond market could have a number of positive externalities in reinforcing a long-term fixed-income market for a broader range of issuers. This could compensate for the higher volatility in foreign capital flows and support local fixed-income markets in EMEs that are less dependent on foreign investors.
What Development Banks Can Bring to the Table
In such a context, it is no surprise that the creation/expansion of national and multilateral development banks has been getting so much attention. For instance, most G20 countries now have some type of national development bank and the aggregated sum of their assets amounted to more than $3.5 trillion, according to a recent survey made by UN DESA. By the same token, several existing multilateral development banks have made efforts to raise their financial capacity, while new institutions have been created (e.g. the NDB from the BRICS countries) or are about to be.
In principle, even with a domestic base of banks and other financial intermediation vehicles willing and able to fill the gap left by shrinking international syndicated lending, there would be a unique additional role to be played by such development banks. The key word here is “additionality,” i.e. to provide some value added relative to what markets and institutions are already able and willing to do.
First, there is a core financial additionality offered by development banks, when they play a key role as a catalyst, drawing private capital into long-term projects in countries and sectors where significant development results can be expected, but the market perceives high risks. Those institutions contribute their own funding (loans, equity) and/or guarantees, providing partners with an improved creditor status. Bringing partners into specific deals through syndications also generates additional financing.
It is relevant to stress that “more becomes less” after a certain point. The size and composition of development bank portfolios must aim to maximize the “crowd in” of private engagement, rather than taking their place (“crowding out”). This is particularly the case when the supply of development bank finance embeds substantial public subsidies. Counterparty finance and complementarity with private investors at the project level can also mitigate “moral hazard” risks.
Furthermore, those portfolios should be moving frontiers: When success is obtained, perceived risks tend to fall and finance starts to acquire “plain vanilla” attributes. Typically, a development bank helps with infrastructure project finance; then, the investment starts to operate with funding from loans; building and operational risks fall over time (greenfield becomes brownfield); the originator development bank securitizes and makes public offers to institutional and other long-term investors; and the originator is able to initiate a new project cycle.
Development banks can also provide “design additionality,” when they help improve the “bankability” — or “financeability” — of project designs. There is also a “policy additionality” when their expertise and policy advice contribute to improvement and stability of policy and regulatory environments. While both are obviously the case with multilateral development banks, very often national development banks are also local repositories of technical knowledge. Finally, as a corollary to these contributions, development banks may offer “selection additionality,” often improving the process of project selection by governments (Chelsky et al, 2013).
Ultimately the cost-benefit balance of development banks’ operation depends not only on the additionality provided, but also on its funding, particularly as it embeds some level of subsidies. Given that long-term financing needs in general, and developing country infrastructure project financing needs in particular tend towards unequivocal upward growth, the potential retrenchment and inappropriate composition of existing international debt flows, as well as the need to make the way for deeper non-banking financial intermediation, highlights the potential catalytic role of development banks. Nevertheless, as exemplified in the imperfect substitutability — and indeed the complementarity — among types of private finance, development banks should make sure they maximize the development bang for their little — and often costly — buck by ensuring additionality in what they do.
Comments Off on Liquidity Glut, Infrastructure Finance Drought and Development Banks
Brazil’s recent slow growth performance is disappointing in at least two respects. While not atypical for an advanced economy that has exhausted the benefits of catch-up growth, the slow growth observed in Brazil would be neither typical nor desirable for an emerging market in need of further per-capita income growth and shared prosperity. Recent growth rates also disappoint relative to recent economic history as the 2004-2008 period saw growth in the region of 5 percent; instead, they evoke the memory of the 1981-2003 period when the economy grew on average 2 percent annually.
The Figure illustrates well the degree of current-day growth pessimism. Market forecasts about Brazilian economic growth two years out have dropped considerably. They have done so not only relative to the zenith of 4.5 percent reached in 2010-11 but also relative to estimates earlier in the last decade of 3.5 percent. While this deterioration reflects structural developments that are a cause for concern, we believe that the perceived decline in the growth capacity of the economy reflects excessive pessimism – not unlike the earlier period of exuberance when expectations were equally distorted, though then on the upside.
Figure: How Growth Optimism Turned into Pessimism
Growth forecasts two years later (daily median GDP forecast averaged over the year, percent)

Source: Central Bank of Brazil; World Bank staff calculations
What explains growth pessimism in Brazil?
The answers may be found in what underpinned the growth acceleration of the mid-to-late 2000s. The growth spurt back then resulted from the delayed effects of the reform efforts in the 1990s and the first half of the 2000s, when Brazil got its macroeconomic house in order and implemented reforms in the financial, trade and social sectors (Ter-Minassian, 2012; Canuto et al, 2013). Risk premiums on all Brazilian types of assets fell systematically after it became clear that the commitment with fiscal discipline, inflation targeting and flexible exchange rates would be preserved regardless of the political parties in government. In addition, favorable external conditions prior to the global financial crisis relaxed financial constraints and financed growth.
These same three factors once responsible for Brazil’s growth acceleration – the credibility of the macroeconomic policy framework, the support of the external environment and the reform efforts on the microeconomic front – have underpinned three strands of growth pessimism that have become prevalent in recent economic commentary on the future direction of Brazil.
The first strand of growth pessimism espouses the view that recent macroeconomic management has eroded the hard-won credibility of the macroeconomic policy framework built on fiscal prudence, exchange rate flexibility and inflation targeting. In response to slow growth coupled with high inflation, policymakers have relaxed fiscal policies, accommodated sticky inflation at the upper end of the target range, and introduced large currency market interventions to dampen exchange rate volatility. Critics point to these developments – alongside interventions to control inflation with administered prices and to support growth through less than fully transparent para-fiscal operations – as the beginning of a slide down a growth-reducing slippery slope (Wheatly, 2014). They also consider the recent downgrade of Brazilian sovereign paper to one notch above junk as validating their concerns.
These factors do not justify in our view the modest growth forecasts observed in recent months. While the return to macro instability of the sort seen in Brazil’s pre-stabilization period can be discounted as a remote possibility, the policy framework did suffer a credibility loss as the authorities struggled to respond to the evolving macroeconomic environment of slow growth and high inflation. But these interventions took place at a time when the flexibility implied by such actions would be considered as warranted in order to counter economic conditions and stabilize asset prices. Brazil also continues to enjoy large external buffers and the pillars of the macroeconomic framework have remained broadly intact. While care will need to be given to ensuring that fiscal buffers are restored and inflation returns to the mid-point of the target range, we do not consider that any credibility losses incurred so far have been an overarching factor in stalling growth or depressing expectations.
The second strand of growth pessimism laments the lack of a supportive external environment. This view is intricately related to the hypothesis that the growth acceleration before the global financial crisis was to a large extent thanks to external rather than domestic factors. Rapid capital inflows, better terms of trade, and lower global interest rates all played to Brazil’s favor when times were good. By analogy, as conditions changed for the worse, so did Brazil’s economic fortunes. Looking ahead, this view paints a depressing outlook for Brazil to the extent that its premier trading partner, China, continues to slow, major advanced economies remain stuck in the doldrums, and global capital becomes more expensive and less readily available as the Fed tapers off its purchases of long-term securities. All of the above are thought to present a clear and present danger for Brazil (BNP Paribas, 2013).
While external factors continue to play a role in Brazil – both by affecting the real and financial side of the economy – they are all too often overplayed. Growth in Brazil is still largely made in Brazil given the overwhelming share of its domestic market in GDP. Brazil’s external trade accounts also remain well diversified in terms of products, export destinations and import sources (Canuto et al, 2013). The role of the external environment in raising growth during 2004 and 2008 must also not be overstated as an important component of the growth acceleration back then was due to the delayed effects of earlier macro- and micro-economic enhancing reforms that produced stabilization gains and enhanced productivity (Canuto, 2013).
This then brings us to the third strand of growth pessimism, which relates to the lack of progress in improving the microeconomic fundamentals for growth. This strand is in our view of far greater concern than the credibility cost of recent macroeconomic management or the economic impact of the deterioration in the external environment. Indeed, the microeconomic environment is critical for growth even more so today than before. This is because demographic dynamics have reduced the growth of Brazil’s labor force. Higher growth will therefore require first and foremost higher output per worker or productivity. But productivity growth remains constrained by slow capital accumulation (both human and physical) as well as a cumbersome business environment. For Brazil to energize and sustain productivity growth, it will need to enable the enabling environment and disable the disabling environment.
Yet, during the recent period of slower growth, little progress has been made in tackling long-standing structural bottlenecks and therefore the structural reform agenda remains long and unfinished (Canuto, 2014). Unsurprisingly, slow growth has of late become primarily a supply-side phenomenon of a structural nature. This is indicated by the fact that, despite slower growth, the output gap is as good as closed, inflationary pressures are pronounced and the labor market is buoyant with unemployment at record lows.
The key challenge going forward will be to energize the momentum of progress. In this respect, the recent ratings downgrade is not to be un-welcomed. It is not a wake-up call in the sense that Brazil is about to slide down the slippery slope of macroeconomic mismanagement or on the verge of an externally powered economic meltdown; rather it should be seen as a call for action on the structural reform front. For the main risk facing Brazil and its economy is the specter of mediocre growth over a protracted period of time against a counterfactual potential of opportunity. Such scenario would not only exacerbate any current concerns about macroeconomic vulnerability but also – and more importantly – imply that Brazil would be ineffective in seizing its development potential.
Comments Off on Three Perspectives on Brazilian Growth Pessimism

The role of asset bubbles as an unsustainable pillar of pre-2007 world economic growth has been widely recognized. Simultaneously, analysts worry that a secular stagnation, though momentarily offset by asset bubbles, may have been already at play in major advanced economies, leading to the ongoing sluggish and feeble recovery.
Still, there is a core divergence among some “Keynesian” and “Schumpeterian” economists who have proposed such stagnation hypotheses; each camp points to different underlying factors for continued anemic levels of growth. “Keynesians” argue from the demand side, and believe that proactive fiscal policies are needed for a strong recovery, while “Schumpeterians” believe that the necessary force of creative destruction has continually been stymied by such policies.
Bubble-led growth had feet of clay
It has now been widely acknowledged that the long period of economic growth in advanced economies prior to the crisis was largely dependent on asset bubbles. Consider the case of the US:
“(…) the liquidity-generating machine inflated US asset values and fed the exuberant growth of US household spending. US consumers have accounted for more than one-third of the growth in global private consumption since 1990. Increasingly, their spending was made possible by the wealth effect generated by the rising prices of housing and household financial assets and stocks, whose values were in turn expected to more than outstrip those of household debt. It was this upswing in consumption by US households, and others as debt-based consumers-of-last-resort in the global economy that essentially made possible the extraordinary structural transformation and productivity increases experienced by some manufacturing exporters and commodity producers among developing economies.” (Canuto, 2009)
A similar bubble-led growth process could be found inside the eurozone, starting with the downward convergence of both perceived risks and interest rates toward levels in Germany and France throughout the zone after the introduction of the new common currency. The eurozone countries under stress today were formerly able to sustain domestic absorption far above domestic production capacities over a long period, easily financing the difference through sudden domestic asset value appreciation. The underestimation of fiscal risks was another manifestation of such euphoria.
Asset-price dynamics has now been mainstreamed as an important subject to be addressed by policy makers, and macroprudential policies have become a component of the macroeconomic stabilization toolkit (Canuto, 2013a). However, enhancing the policy framework through improved financial regulation and articulated monetary and prudential policies, in order to ensure both financial and macroeconomic stability may not be enough if some underlying trend of stagnation is at play. If the pre-crisis growth trend was inextricably dependent on the overspending induced by the financial frenzy — credit and house bubbles — avoiding future asset price booms and busts might simply lead to stability around low growth rates.
Keynesians: It’s aggregate demand, stupid!
Such a view underlies the possibility of a “secular stagnation” as discussed by economists like Krugman (2013) and Summers (2013):
“Manifestly unsustainable bubbles and loosening of credit standards during the middle of the past decade, along with very easy money, were sufficient to drive only moderate economic growth. (…) short-term interest rates are severely constrained by the zero lower bound: real rates may not be able to fall far enough to spur enough investment to lead to full employment.” Summers (2013)
They and other — “Keynesian” — economists have suggested an array of possible causes for the US economy and others to display a propensity of aggregate demand shortfalls, in the sense that, as a result of structural conditions, aggregate spending would be enough to ensure full employment and use of potential output capacity only in the presence of negative real interest rates. Such an “investment drought” — or, as a flipside, a “savings glut” as measured by levels of non-consumption expenditures required to sustain income at full employment — could be seen as underlying the evolution depicted in Chart 1, obtained from Fatas (2013).
Chart 1 US – Private Nonresidential Investment and Real Interest Rates

Source: Fatas (2013)
Beyond the legacies of the crisis — including higher risk aversion, increased savings by states and consumers, increased costs of financial intermediation and major debt overhangs — several long-standing factors would have contributed to dampening investment. Among them, I single out two as the most significant:
First, rising income concentration — rising shares of income accruing to capital and the very wealthy — would be leading to overall under-consumption, only occasionally countervailed with unsustainable over-indebtedness by the poor. Second, technological evolution might also be contributing to an investment drought. Steep declines in the costs of durable goods — especially those associated with information and communication technology and/or outsourcing — means reduced spending on investment plans out of corporate savings. Furthermore, the trajectories of technological evolution currently unfolding would not carry as many high-return investment opportunities as past periods of innovation.
Summers (2014) argues that “(…) our economy is held back by lack of demand rather than lack of supply. Increasing capacity to produce will not translate into increased output unless there is more demand for goods and services.” He strongly recommends establishing “a commitment to raising the level of demand at any given level of interest rates through policies that restore a situation where reasonable growth and reasonable interest rates can coincide.”
It follows from this view that the policy mix that has prevailed since the aftermath of the crisis has been inappropriate. Instead of relying single-handedly on ultra-loose monetary policy, public spending — on infrastructure, energy and other sectors — should be rescued from the retrenchment to which it has been submitted. As long as credible medium-to-long-term adjustment programs are announced, there would be scope for fiscal stimulus despite current public debt levels. By the same token, pro-active public policies to ignite private investment spending should also be implemented.
Schumpeterians: It’s all about “creative destruction,” folks!
On the other side of the debate, there are those “Schumpeterian” economists who have offered supply-side based hypotheses of a long-run stagnation trend supposedly already in course for some time. Like Joseph A. Schumpeter, they lay emphasis on growth as a process of “creative destruction” in which obsolete forms of resource allocation and wealth — jobs, fixed-capital assets, technologies, and balance sheets — are replaced by higher-value ones. Although accepting an eventual role of monetary policies in avoiding systemic financial meltdowns, they tend — also like Schumpeter — to be more skeptical of fiscal or other types of countercyclical stimulus if these are designed in ways that retard the process of creative destruction. As for the post-crisis policy mix, Schumpeterians believe that public policy which artificially props up aggregate demand cannot be a key component in the fight against stagnation. In other words, “If you are postulating a stagnation across the longer run, ultimately it will have to boil down to supply side deficiencies.”(Cowen, 2013). The evolution of declining investments in tandem with lower interest rates shown in Chart 1 is seen as stemming from disadvantageous rates of return not related to the pace of aggregate demand expansion.
Technological evolution as a cause of stagnation has been put forth as a hypothesis byGordon (2014). Nevertheless, his arguments focus on the limited ability of current technological trajectories to raise productivity, rather than their supposedly dampening effects on aggregate demand.
Cowen (2011) has in turn approached stagnation as an outcome of the exhaustion of a significant set of “low-hanging fruits” reaped in recent history, namely one-off supply-side opportunities associated with post-war reconstruction; trade opening; diffusion of new technologies in power, transport, and communications; and educational attainments, among others. Other recently-proposed causes for supply-side stagnation are associated with features of resource allocation, such as over-sizing of financial activities, as discussed by Canuto (2013b).
As Rajan proposed in 2012, such propositions about stagnation trends suggest that:
“(…) the advanced countries’ pre-crisis GDP was unsustainable, bolstered by borrowing and unproductive make-work jobs. More borrowed growth – the Keynesian formula – may create the illusion of normalcy, and may be useful in the immediate aftermath of a deep crisis to calm a panic, but it is no solution to a fundamental growth problem. If this diagnosis is correct, advanced countries need to focus on reviving innovation and productivity growth over the medium term, and on realigning welfare promises with revenue capacity, while alleviating the pain of the truly destitute in the short run.”
To be effective, a pair of scissors needs both blades
Keynesian and Schumpeterian hypotheses on stagnation trends are based on non-directly observable factors. Therefore, the struggle for hearts and minds of public opinion and policy makers will likely remain unsettled.
I, for one, lean in favor of the argument of insufficiency of aggregate demand throughout the ongoing recovery in advanced economies, as the behavior of the prices of goods and services seem to indicate (Chin, 2014). Nevertheless, one may acknowledge the possible negative effect on investment prospects caused by procrastination regarding “creative destruction.” This is clearly the case with sluggish balance-sheet adjustments and a debt overhang in the Eurozone.
Let me offer two key takeaways. First, regardless of the size of public outlays, public action and spending should be both designed in ways that maximize the “bang for their buck” in terms of overcoming obstacles to the process of creative destruction. Take the case of Japan: the success of the third arrow of Abenomics, which focuses on structural reforms in the services sector, will be a condition for successful results in its fiscal and monetary arrows. Likewise, in the Eurozone, quicker action to restructure/consolidate “zombie” balance sheets and companies, in line with a more pro-active stance taken by monetary and financial authorities, should also hasten their path out of the current stagnation.
Second, regardless of whether advanced economies are indeed facing demand- or supply-side stagnation trends, the developing world’s economic transformation remains as a powerful source of growth for the global economy as a whole (Canuto, 2011). However, for such growth to continue, developing countries themselves will also need to pursue their own country-specific agendas of structural reform and, therefore, of “creative destruction” (Canuto, 2013c).
Comments Off on Secular Stagnation: A Working Pair of Scissors Needs Two Blades