


Posts by RichardMills:
- Moss Mine has 200,000 Oz Gold (M&I) not included in the BFS
- Moss Mine Resource remains open at depth and on Strike to the East and West for more than 3kms
- Frank Vanderlip, president of the National City Bank of New York, associated with the Rockefellers
- Henry P. Davison, senior partner of J.P. Morgan Company, regarded as Morgan’s personal emissary
- Charles D. Norton, president of the Morgan dominated First National Bank of New York
- Col. Edward House, who would later become President Woodrow Wilson’s closest adviser and founder of the Council on Foreign Relations
- Benjamin Strong, a lieutenant of J.P. Morgan
- Paul Warburg, a recent immigrant from Germany who had joined the banking house of Kuhn, Loeb and Company, New York directed the proceedings and wrote the primary features of what would be called the Aldrich Plan.
- Between 1997 and 2005 mortgage fraud increased by 1,411 percent.
- In 2001 the US Federal Reserve lowered the Federal funds rate eleven times, from 6.5 percent to 1.75 percent.
- Mortgage denial rates were 28 percent in 1997, in 2002 – 2003 they were 14 percent for conventional home purchase loans. “Fog the mirror loans” were common, if you breathed you got a loan.
- In June 2002 President George W. Bush set out to increase minority home ownership by 5.5 million. Bush’s lofty goals would be accomplished by tax credits, subsidies and Fannie Mae committing $440 billion to establish Neighbor Works America.
- In June2003 Federal Reserve Chair Alan Greenspan lowered the federal reserve’s key interest rate to one percent – the lowest rate in 45 years.
- Throughout 2003 Fannie Mae and Freddie Mac bought $81 billion in subprime securities. President Bush signed the American Dream Down payment Act – the Act provided a maximum down payment assistance grant of either $10,000 or six percent of the purchase price of the home, whichever was greater.
- U.S. homeownership rate peaked to an all time high of 69.2 percent in 2004.
- From 2004 to 2006 Fannie Mae and Freddie Mac purchased $434 billion in securities backed by subprime loans.
- In late 2004 the Securities Exchange Commission (SEC) suspended net capital rule for five firms – Goldman Sachs, Merrill Lynch, Lehman Brothers, Bear Stearns and Morgan Stanley. Free from government imposed limits on the amount of debt they could assume, they all levered up, as much as 40 to 1.
- TheUnited States housing market bubble burst in the fall of 2005. By year-end a total of 846,982 properties were in some stage of foreclosure. From the fourth quarter of 2005 to the first quarter of 2006, median prices nationwide dropped off 3.3 percent.
- The U.S. Home Construction Index was down over 40 percent as of August 2006. A total of 1,259,118 foreclosures were filed in 2006, up 42 percent from 2005. Homeowners were going underwater (they owed more than the house was worth) and many had had questionable credit to start with.
- In 2007, lenders started foreclosure proceedings on nearly 1.3 million properties, a 79 percent increase over 2006.
- Foreclosure proceedings increased to 2.3 million in 2008, an 81 percent increase over 2007 and increased by another half million in 2009 to 2.8 million. By January 2008, the mortgage delinquency rate had risen to 21 percent and by May 2008 it was 25 percent.
- By August 2008, 9.2 percent of all U.S. mortgages outstanding were either delinquent or in foreclosure. By September 2009, this had risen to 14.4 percent.
- The System Open Market Account (SOMA) purchased mortgage-backed securities guaranteed by Fannie Mae, Freddie Mac, and Ginnie Mae (agency MBS).
- The Term Auction Facility was $40 billion in loans to rescue the banks. It wasn’t near enough, the Treasury department got authorization to spend $150 billion more to subsidize and eventually take over Fannie Mae and Freddie Mac, they also bailed out AIG.
- Dollar Swap Lines exchanged dollars with foreign central banks for foreign currency to help address disruptions in dollar funding markets abroad.
- The Term Securities Lending Facility auctioned loans of U.S. Treasury securities to primary dealers against eligible collateral.
- The Primary Dealer Credit Facility provided overnight cash loans to primary dealers against eligible collateral.
- The Asset-Backed Commercial Paper Money Market Mutual Fund Liquidity Facilityprovided loans to depository institutions and their affiliates to finance purchases of eligible asset-backed commercial paper from money market mutual funds.
- TheCommercial Paper Funding Facility provided loans to a special purpose vehicle to finance purchases of new issues of asset-backed commercial paper and unsecured commercial paper from eligible issuers.
- The Term Asset-Backed Securities Loan Facility supported the issuance of asset-backed securities (ABS) collateralized by loans related to autos, credit cards, education, and small businesses. In March 2009, the Fed announced that it was expanding the scope of the TALF program to allow loans against additional types of collateral.
- The Troubled Asset Recovery Program was proposed and $350 billion was approved by Congress – the money was used to buy bank and automotive stocks.
- “In Dimon’s (JPMorgan Chase CEO Jamie Dimon) case, JPMorgan received some $391 billion of the $4 trillion in emergency Fed funds at the same time his bank was used by the Fed as a clearinghouse for emergency lending programs. In March of 2008, the Fed provided JPMorgan with $29 billion in financing to acquire Bear Stearns. Dimon also got the Fed to provide JPMorgan Chase with an 18-month exemption from risk-based leverage and capital requirements. And he convinced the Fed to take risky mortgage-related assets off of Bear Stearns balance sheet before JP Morgan Chase acquired the troubled investment bank.
- Another high-profile conflict involved Stephen Friedman, the former chairman of the New York Fed’s board of directors. Late in 2008, the New York Fed approved an application from Goldman Sachs to become a bank holding company giving it access to cheap loans from the Federal Reserve. During that period, Friedman sat on the Goldman Sachs board. He also owned Goldman stock, something that was prohibited by Federal Reserve conflict of interest regulations. Although it was not publicly disclosed at the time, Friedman received a waiver from the Fed’s conflict of interest rules in late 2008. Unbeknownst to the Fed, Friedman continued to purchase shares in Goldman from November 2008 through January of 2009, according to the GAO.
- In another case, General Electric CEO Jeffrey Immelt was a New York Fed board member at the same time GE helped create a Commercial Paper Funding Facility during the financial crisis. The Fed later provided $16 billion in financing to GE under this emergency lending program.” Fed Board Member Conflicts Detailed by GAO, http://www.sanders.senate.gov/
- Jamie Dimon, the Chairman and CEO of JP Morgan Chase, has served on the Board of Directors at the Federal Reserve Bank of New York since 2007. During the financial crisis, the Fed provided JP Morgan Chase with $391 billion in total financial assistance. JP Morgan Chase was also used by the Fed as a clearinghouse for the Fed’s emergency lending programs. In March of 2008, the Fed provided JP Morgan Chase with $29 billion in financing to acquire Bear Stearns. During the financial crisis, the Fed provided JP Morgan Chase with an 18-month exemption from risk-based leverage and capital requirements. The Fed also agreed to take risky mortgage-related assets off of Bear Stearns balance sheet before JP Morgan Chase acquired this troubled investment bank.
“I just think this constant refrain, ‘bankers, bankers, bankers’ — it’s just a really unproductive and unfair way of treating people. People should just stop doing that.” Jamie Dimon
- Jeffrey Immelt, the CEO of General Electric, served on the New York Fed’s Board of Directors from 2006-2011. General Electric received $16 billion in low-interest financing from the Federal Reserve’s Commercial Paper Funding Facility during this time period.
- Stephen Friedman. In 2008, the New York Fed approved an application from Goldman Sachs to become a bank holding company giving it access to cheap Fed loans. During the same period, Friedman, who was chairman of the New York Fed at the time, sat on the Goldman Sachs board of directors and owned Goldman stock, something the Fed’s rules prohibited. He received a waiver in late 2008 that was not made public (the Fed provided conflict of interest waivers to employees and private contractors so they could keep investments in the same financial institutions and corporations that were given emergency loans). After Friedman received the waiver, he continued to purchase stock in Goldman from November 2008 through January of 2009 unbeknownst to the Fed, according to the GAO.During the financial crisis, Goldman Sachs received $814 billion in total financial assistance from the Fed.
- Sanford Weill, the former CEO of Citigroup, served on the Fed’s Board of Directors in New York in 2006. During the financial crisis, Citigroup received over $2.5 trillion in total financial assistance from the Fed.
- Richard Fuld, Jr, the former CEO of Lehman Brothers, served on the Fed’s Board of Directors in New York from 2006 to 2008. During the financial crisis, the Fed provided $183 billion in total financial assistance to Lehman before it collapsed.
- James M. Wells, the Chairman and CEO of SunTrust Banks, has served on the Board of Directors at the Federal Reserve Bank in Atlanta since 2008. During the financial crisis, SunTrust received $7.5 billion in total financial assistance from the Fed.
- Richard Carrion, the head of Popular Inc. in Puerto Rico, has served on the Board of Directors of the Federal Reserve Bank of New York since 2008. Popular received $1.2 billion in total financing from the Fed’s Term Auction Facility during the financial crisis.
- James Smith, the Chairman and CEO of Webster Bank, served on the Federal Reserve’s Board of Directors in Boston from 2008-2010. Webster Bank received $550 million in total financing from the Federal Reserve’s Term Auction Facility during the financial crisis.
- Ted Cecala, the former Chairman and CEO of Wilmington Trust, served on the Fed’s Board of Directors in Philadelphia from 2008-2010. Wilmington Trust received $3.2 billion in total financial assistance from the Federal Reserve during the financial crisis.
-
Gross revenues fell to $7.7 billion in 2015, compared to $8.2 billion in 2014.
-
Capital expenditures are declining – $1.2 billion in 2015, $1.5 billion in 2014, $1.785 billion in 2013.
-
Seven mines were put on care and maintenance by the end of 2015,
-
Exploration expenditures dropped to $272 million in 2015, from about
-
The decreasing land base available to exploration/mining
-
The lack of clarity in land access and use rules
-
The overlapping nature of government regulations
-
Excellent geology
-
Good transportation (road & rail) system
-
Competitive tax rates
-
Strategic location with respect to Asian markets. Two modern ports, Vancouver – Canada’s largest and the Port of Prince Rupert which is the closest of any of North America’s West Coast ports to Asia – up to 58 hours of sailing time shorter
-
High quality and easily accessible geological data
-
Mining friendly provincial government
-
Communities receptive to resource extraction as a livelihood
-
Attractive exploration incentives
-
BC is the third largest generator of hydro electricity in Canada – one of the lowest power costs in North America. Natural gas is plentiful, cheap and resources are growing
-
Some of the most modern education and telecommunications infrastructure in the world
-
The acreage necessary to produce a certain amount of calories from any livestock is drastically greater than the required acreage to produce the same amount of calories from plants
-
Livestock agriculture requires additional acreage to grow the grains needed for livestock feed
- Medical advances lessened the mortality rate in many countries
- Massive increases in agricultural productivity because of the “Green Revolution”
- Development of high yielding varieties of cereal grains
- Expansion of irrigation infrastructure
- Modernization of management techniques
- Mechanization
- Distribution of hybridized seeds, synthetic fertilizers, and pesticides to farmers
- Plants with the largest seeds were selected for breeding to create the most production
- By maximizing the seed or food portion of the plant, the plant is able to use photosynthesis more efficiently because the energy produced during this process went directly to the food portion of the plant
- By selectively breeding plants that were not sensitive to day length, researchers doubled a crop’s production because the plants were not limited to certain areas of the globe based solely on the amount of light available to them
- Fertilizers
- Irrigation
- Pesticides
- Unsustainable farming – intensive farming depletes the nutrients in the soil
- Overgrazing – animals eat away grasses and erode topsoil with their hooves
- Deforestation or clear-cutting of land – the tree and plant cover that binds the soil is removed
- Misuse of water resources
- Industrial activities
- The Arabian Aquifer System, which supplies Saudi Arabia, Syria, Iraq, and Yemen
- Yhe Murzuk-Djado Basin in northern Africa
- The Indus Basin of India and Pakistan
- The Central Valley Aquifer System in California
- Variations in the Earth’s orbital eccentricity – the shape of the orbit around the sun, a 100,000 year cycle
- Changes in obliquity or tilt of the earth’s axis – changes in the angle that Earth’s axis makes with the plane of Earth’s orbit, a 41,000 year cycle
- Precession – the change in the direction of the Earth’s axis of rotation, a 19,000 to 23,000 year cycle
- Changes occurring within the sun affects the intensity of sunlight that reaches the Earth’s surface. These changes in intensity can cause either warming – stronger solar intensity – or cooling when solar intensity is weaker.
- Volcanoes often affect our climate by emitting aerosols and carbon dioxide into the atmosphere. Aerosols block sunlight and contribute to short term cooling, but do not stay in the atmosphere long enough to produce long term change. Carbon dioxide (CO2) has a warming effect. For about two-thirds of the last 400 million years, geologic evidence suggests CO2 levels and temperatures were considerably higher than present. Each year 186 billion tons of carbon from CO2 enters the earth’s atmosphere – six billion tons are from human activity, approximately 90 billion tons come from biologic activity in earth’s oceansand another 90 billion tons from such sources as volcanoes and decaying land plants
- The heating or cooling of the Earth’s surface can cause changes in greenhouse gas concentrations – when global temperatures become warmer, CO2 is released from the oceans and when temperatures become cooler, CO2 enters the ocean and contributes to additional cooling. During at least the last 650,000 years, CO2 levels have tracked the glacial cycles – during warm interglacial periods, CO2 levels have been high and during cool glacial periods, CO2 levels have been low
- The heating or cooling of the Earth’s surface can cause changes in ocean currents. Ocean currents play a significant role in distributing heat around the Earth so changes in these currents can bring about significant changes in climate from region to region
- China – $9,233
- Indonesia – $4,956
- Philippines – $4,410
- India – $3,876
- Pakistan – $2,891
- Declining ore grades means a much larger relative scale of required mining and milling operations. As a rule grades are higher at current mining operations than at development stage projects – so costs are going to be higher to remove/process the same amount of ore.
- A growing proportion of mining projects are in remote areas of developing economies where there’s little to no existing infrastructure.
- Weather/Natural Disasters – Rain caused flooding or the opposite, drought causing water shortages, hurricanes, earthquakes (recent 8.3 magnitude earthquake in Chile).
- Technical problems – Commissioning delays, slower ramp-ups, 45% of supply growth is coming from greenfields projects.
- Power shortages – Chile, Zambia.
- Labor activity – Contract revisions, mine, rail and port strikes, environmental protests. Over 15% of production had labor contracts up for renewal in 2015. Workers at some of the world’s largest mines – Freeport McMoRan’s Grasberg in Indonesia and BHP Billiton/Glencore’s Antamina in Peru – were to renegotiate contracts in 2015. Bloomberg, in April, reported almost a 10th of global copper output was at risk of being lost due to labor disruptions in 2015 affecting 1.5 million metric tonnes or 8.2% of annual production.
- Older mines reaching end of mine-life – Falling grades, dirty concentrates (laced with arsenic).
- Declining price environment – Project deferrals, mothballing and downsizing of mine plans.
- Resource Nationalism – Resource nationalism is the tendency of people and governments to assert control, for strategic and economic reasons, over natural resources located on their territory ie. Indonesian ban on unrefined ore exports.
- Exports from Indonesia’s Grasberg copper mine will be affected by a “lack of water in rivers to transport the metal to the port”.
- Electricity shortages in Zambia are also expected to weigh on supply. As water levels at its hydropower dams dried up after a drought last month, the country’s power providers announced a 30% reduction in supply to mines.
- The low-hanging mineral fruit has been picked
- Metallurgy is becoming more complicated
- We are using more and more energy to achieve the same amount of production. When does one unit of cost in, not give you the two out you need?
- There is no substitute for many metals except other metals – plastic piping is one exception
- There hasn’t been a new technology shift in mining for decades – heap leach and open pit mining come to mind but they are both decades old innovations
- Increasingly we will see falling average grades being mined, mines becoming deeper, more remote and come with increased political risk
- Labor shortages loom, baby boomers are starting to retire en masse, and the resource-orientated talent pool is thinning out
- We’re rushing headlong into shortages of resources and the conflicts generated from a lack of security of supply
- Slowing production and dwindling reserves at many of the world’s largest mines
- The pace of new elephant-sized discoveries has decreased in the mining industry
- All the oz’s or pounds are never recovered from a mine – they simply becomes too expensive to recover
- Increased sensitivity and specificity for the detection of cancers and even premalignant lesions.
- A potential decrease in cancer recurrence due to the ability to completely remove tumor tissues along with the cancerous cells in the margins.
- A significant commercial advantage to BSS’s imaging technology because of its adaptability to all endoscopes that are currently on the market.
- Easy adoption of BSS’s two ultrasensitive imaging designs for use in multiple other applications where endoscopy imaging is currently utilized.
- Medical advances lessened the mortality rate in many countries
- Massive increases in agricultural productivity caused by the “Green Revolution”
- Development of high yielding varieties of cereal grains
- Expansion of irrigation infrastructure
- Modernization of management techniques
- Mechanization
- Distribution of hybridized seeds, synthetic fertilizers, and pesticides to farmers
- Agricultural output did increase as a result of the Green Revolution, but the energy input to produce a crop increased faster – the ratio of crops produced to energy input has decreased. This is because High Yielding Varieties (HYVs) of seeds only outperform traditional varieties when adequate irrigation, pesticides and fertilizers are used
- Green Revolution agriculture produces monocultures of cereal grains. This type of agriculture relies on the extensive use of pesticides because monoculture systems – with their lack of genetic variation – are particularly sensitive to bug infestations
- The transition from traditional agriculture to GR agricultural meant farmers became dependent on industrial inputs – not made on the farm inputs. Farmers faced severely increased costs because they now had to purchase such items as farming machinery, fertilizer, pesticides, irrigation equipment and seeds
- The increased level of mechanization on larger farms removed a large source of employment from the rural economy. New machinery – mass produced gas tractors, large self propelled combines and mechanical cotton pickers – all combined to sharply reduce labor requirements
- Less people were affected by hunger and died from starvation – but many more are affected by malnutrition such as iron or Vitamin A deficiencies. Green Revolution grains do not have the same nutritional values as traditional varieties. The switch from heavily rotated multiple crops to mono cropping or dual cropping reduces total soil fertility and the nutritional value of our food
- The Green Revolution reduced agricultural biodiversity by relying on just a few varieties of each crop. The food supply could be susceptible to pathogens that cannot be controlled by agrochemicals
- Many valuable genetic traits, bred into traditional varieties over thousands of years, are now lost
- Wild plant and animal biodiversity was hurt because the Green Revolution expanded agricultural development into new areas where it was once unprofitable or too arid to farm
- The 20/80 phenomenon – the rapid increase in farm size and the concentration of production among large producers means 20% of producers generate 80% of the agricultural output
- As a result of modern irrigation practices, aquifers in places like India and the US mid west have become depleted. There are two types of aquifers: replenish able, most of the aquifers in India and the shallow aquifer under the North China Plain are replenish able – depletion means the maximum rate of pumping is automatically reduced to the rate of recharge. For fossil, or non-replenish able aquifers – like the U.S. Ogallala aquifer, the deep aquifer under the North China Plain, or the Saudi aquifer – depletion brings pumping to an end. In the more arid regions like the southwestern United States or the Middle East the loss of irrigation water could mean the end of agriculture in these areas
- Green Revolution techniques rely heavily on chemical fertilizers, pesticides and herbicides, some of these are developed from fossil fuels which makes today’s agriculture regime much more reliant on petroleum products
- Farming methods that depend heavily on chemical fertilizers do not maintain the soil’s natural fertility and because pesticides generate resistant pests, farmers need ever more fertilizers and pesticides just to achieve the same results
- The increased amount of food production led to overpopulation worldwide
- Agriculture
- Energy
- Water use
- Manufacturing
- Disease control
- Fertilizers
- Information management
- Transportation
- Global abnormal weather. Record setting droughts, flooding, hailstorms, cold snaps all exacerbated by climate change
- Exploding populations
- Eastern diets shifting to a western style one and food to fuel
- Aquifers are being depleted faster than natural refreshment rates
- Desertification
- China – 9,233
- Indonesia – 4,956
- Philippines – 4,410
- India – 3,876 Pakistan – 2,891
- Pakistan – 2,891
- For over the last twelve years supply has struggled to keep pace with demand
- Metal supply is finite and subject to compounding demand from developing nations
- Metal production is highly cyclical, with intermittent peaks and troughs which are closely linked to economic cycles – declining production has historically been driven by falling demand and prices, not by scarcity
- Rates of production and amounts of reserves continually change in response to movements in markets and technological advances
- Most mineral resources will not be exhausted in the near future
- If energy was cheap and unlimited then recoverable resources would be unlimited
- Discovery and development is increasingly becoming more challenging and expensive
- Average ore grades are in decline for most minerals, yet production has increased dramatically
- Our most important metals are suffering from declining ore quality and rising extraction (ore is a different and inferior chemical or structural composition) costs
- Our prosperity has always been based on the fact that producing resources yielded more resources than it cost. However the cost of *energy is climbing, the amount used is climbing but the returns from energy expended is declining. Eventually the quantity of resources used in the extraction process will be 100% of what is produced
- Most older existing mines, the foundation of our supply, have increasing costs with production rates stagnating or even declining
- The rate of discovery is not keeping pace with the rate of depletion, let alone being higher
- Location
- Capital and operating costs
- Market conditions
- Average capital and operating costs for copper production capacity in new mines increased an average of 15% per year over the past 20 years
- From 2001 to 2012, the weighted-average head grade at 47 producing mines with comparable data declined by almost 30%
- The average ore grades of copper in new discoveries and developing projects is declining
- Significant deposits are now being found at greater depths or in more remote areas
- Net of administrative costs, a mining company had an average total cost to replace reserves and produce copper of more than $3.30/lb in 2012
- The 22 major copper producers, based on 2012 production levels, need to replace an average of at least 500,000 mt of copper reserves each year
- An increasing proportion of potential new supply is located in riskier countries.
- More challenging environments subject to a lack of infrastructure imply an increase in the capital intensity of new projects.
- Recent supply has continued to underperform with decreasing grades and disruptions impacting production.
- Major causes of supply disruption will continue, these causes being; Technical complexity, Project delays, Labor strike action
- Rising energy and commodity prices
- A decline in the global economy
- Civil unrest
- Global energy demand is expected to grow by 37% by 2040.
- Electricity demand is expected to increase by almost 80% over the same period with some 7,200 gigawatts (GWe) of capacity needing to be built to keep pace with increasing electricity demand and fleet retirements.
- Energy demand growth will be led by China until the mid-2020s, with India then replacing China as the main energy consumer out to at least 2040.
- The Megatons to Megawatts program supplied around 10% of all US electricity over the past 15 years.
- The Megatons to Megawatts program supplied 12% of world uranium demand.
- The timing couldn’t be better. I do not consider this a ‘today deal.’ I look at the merger being done today as building for tomorrow the largest integrated uranium production company focused solely on the United States
- The uranium market is facing a dramatic supply risk due to low market prices. Analysts are saying the uranium market must recover to $75-$80/pound to incentivize the development of new uranium projects.
- The existence of long-term sales contracts provides downside protection
- The combined entity has the ability to ramp up production from its existing project portfolio quickly
- A land-based RadonEX survey. Some of the Athabasca Basins highest RadonEx readings (9.93 pCi/m2/sec) were generated by LK’s Gibbons Creek survey. These readings are 10 times higher then what Fission Uranium Corp. measured at their Patterson Lake discovery. A very interesting fact associated with this survey is that radon gas associated with uranium mineralization has a half-life of 3.8 days, 80% decays within 12 days and within 30 days it has 100% disappeared.
- Ground work confirmed the existence of the historic radioactive boulder field with eight samples surpassing 1% U3O8, one of them hitting 4.28%. Another 11 samples assayed above 0.2%, with nine more below 0.2%. Anomalous values for nickel, arsenic, lead and cobalt also appeared. Samples taken from glacial till down ice show results as high as 5% uranium
- A DC-Resistivity survey confirmed the definition of an east-west resistivity low, this low has been interpreted as an alteration corridor.
- Surface sampling at the Star Uplift, a basement outcrop about 350 meters by 700 meters, found a gold trend that also revealed platinum group elements, rare earths and anomalous low-grade uranium. Of 124 soil samples, 29 exceeded 0.1 g/t gold. Six of them passed 1 g/t and one reached 2.21 g/t gold. Of 73 rock samples, nine assayed over 0.1 gram per tonne gold, including two that surpassed 2 g/t and one that hit 3.7 g/t gold. There�s also up to .75 of a gram per tonne platinum and palladium in the samples.
- One kilometer south of the Star uplift there’s a massive alteration zone showing up in the resistivity data set. The periphery of the zone was drilled in the 1970s. Assays returned up to 1,500 parts per million uranium – that’s 1,500 ppm proximal to a massive alteration zone.
- In the Athabasca Basin pathfinder elements – gold and Platinum Group Element (PGE) would be included in this group – are usually counted in parts per million. To be counting gold and PGE in grams per tonne is highly unusual, although Shea Creek and Patterson Lake South did have high grade gold values.
- The property was covered by airborne EM surveys and airborne gravity surveys in 2006. There’s also a very good set of historic data – during the 1976-1981 exploration boom Eldorado Nuclear Ltd. completed soil sampling, prospecting, ground EM surveys, gravity surveys and resistivity surveys.
- There’s a major regional structural lineament running 30 to 40 kilometers north to south. Every significant uranium deposit is structurally related – there has to be a fault zone or a structure of magnitude. Having it reactivated time and time again allows multiple generations of fluid to flow along that structure and deposition of perhaps multiple high grade ore bodies.
- The deposits in the Athabasca Basin are considered blind deposits there’s no surface expression so one of the major keys to success is maximizing the number of holes drilled. Shallow depth – it’s just 50 to 250 meters to the sub-Athabasca unconformity on Lakelands Star/Gibbons project – leads to cheaper drilling per hole. More holes equals more exploration bang, more chances of success for the buck.
- Roads and power lines cross the property which lies only a few kilometers from the town of Stony Rapids. When everything is taken into consideration it’s easy to see why Lakeland anticipates an economical program of shallow drilling.
- The company is in receipt of the necessary permits to carry out the work program, a drilling contract has been negotiated and the company is fully funded to complete the work. The drill program will commence as soon as winter ground conditions permit.
- An option to acquire up to a three percent NSR royalty (by December 2016) on claims covering the majority of the currently outlined Spring Valley gold deposit – Outlined inRED hatching on map above.
- A total of up to a one percent NSR royalty on the remaining portion of the currently outlined Spring Valley gold deposit as well as areas to the north of the currently outlined NI 43-101 gold resource – Outlined in GREEN hatching on map above. Terraco currently has direct ownership of 0.5 percent NSR royalty plus an option (by December 2016) to purchase an additional 0.5 percent NSR royalty for a total of up to one percent NSR royalty.
- Terraco has a Right of First Refusal (ROFR) for a one percent NSR royalty on claims within a one-half (1/2) mile perimeter area of interest around the claims in RED.
- A substantial upward trend in real interest rates will soon begin.
- In a strengthening economy.
- In a future where there is no inflation.
- Announce an inflation or price-level target that guarantees a period of above-normal inflation.
- Depreciate the currency.
- Support the depreciation, to the extent necessary, through direct intervention in foreign-exchange markets: print money and buy foreign currencies or assets.
- Higher demand for U.S. Treasuries – rising bond prices means falling interest rates.
- Lower borrowing costs for the Federal government – which is good, 47 percent of U.S. households receive some kind of government dependency check each month. The U.S. spent $2 trillion last year in handouts.
- Foreign demand for U.S. assets, primarily domestic large-cap stocks.
- A stronger dollar makes U.S. exports more expensive and hurts U.S. based international corporation profits whose international earnings will be savaged. A five percent rise in the dollar versus the euro results in a drop of about $1 for full-year Standard & Poor’s 500 Index per-share earnings – that is going to effect the stock markets immensely.
- The dollar rose 7.8 percent against the euro last quarter and 6.7 percent against a group of 10 currencies. According to U.S. Commerce Department exports from Italy to the U.S. are up 10.2 percent this year through August, German exports to the U.S. rose 10.7 percent, and French shipments climbed 6.5 percent.
- A dollar that is appreciating strongly against other currencies is a drag on U.S. growth – foreign goods are cheaper, U.S. exports are more expensive meaning the U.S. trade balance is going to deteriorate.
- Goldman Sachs says the dollar’s rise could reduce real gross domestic product growth by 0.1 to 0.15 percentage point in 2015 and 2016.
- Deficits are going to rise – war fighting isn’t cheap. Air power alone isn’t enough to win against the Islamic State and ‘boots on the ground’ will be necessary – that’s expensive. The cost of continual war is going to escalate drastically.
- Lower commodity prices – cheaper input costs will produce less or none of the much wanted inflation.
Bond market bear creating gold bull
January 19th, 2018By Richard Mills.
Gold is climbing as bond yields rise and the dollar falls, over speculation that China is pulling back on buying US Treasuries and Japan signals it is winding down its quantitative easing program. Meanwhile, US debt continues to grow after the Republicans under President Trump pushed a trillion dollars worth of tax cuts through the Senate, that the Congressional Budget Office thinks will add $1.7 trillion to the deficit over the next decade.
It’s all good news for gold which thrives on the spectre of high government debt leading to more money-printing (aka the Federal Reserve buying Treasuries) and inflation.
Today’s Federal Debt is $20,493,401,574,964.07.
The amount is the gross outstanding debt issued by the United States Department of the Treasury since 1790 and reported here.
But, it doesn’t include state and local debt.
And, it doesn’t include so-called “agency debt.”
And, it doesn’t include the so-called unfunded liabilities of entitlement programs like Social Security and Medicare.
Federal Debt per person is about $62,805.
Inflation, of course, diminishes the value of the currency and hikes gold prices, since the US dollar and gold normally move in opposite directions.
Gold is seen as a hedge against inflation.
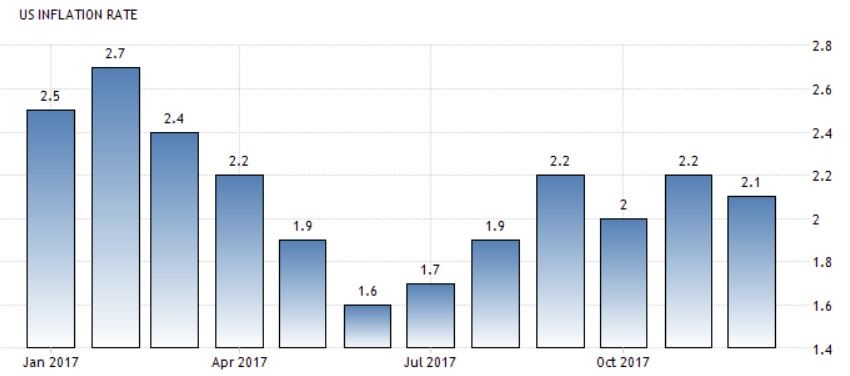
Consumer prices in the United States increased 2.1 percent year-on-year in December of 2017… Figures came below market expectations of 2.2 percent amid a slowdown in gasoline and fuel prices. Still, core inflation edged up to 1.8 percent and the monthly rate increased to 0.3 percent, the highest in eleven months. tradingeconomics.com
China Treasury purchases in doubt
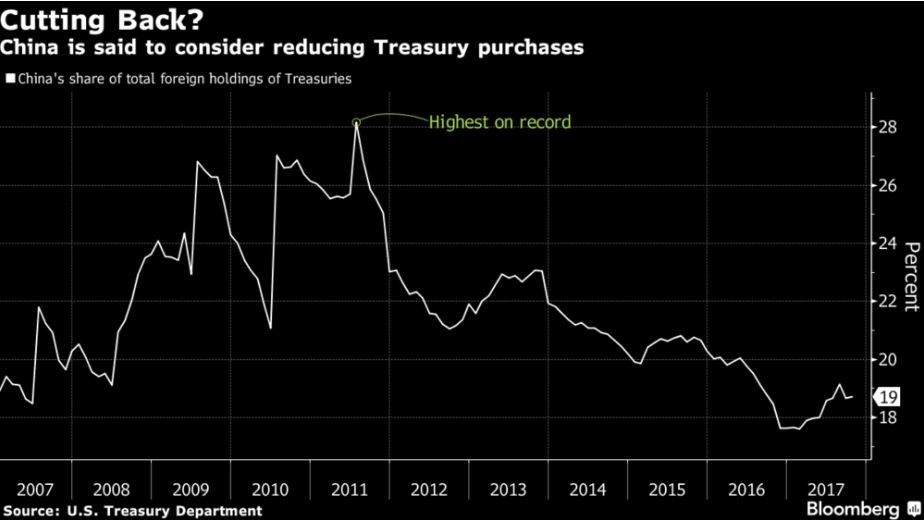
Last week was very interesting for the bond markets which are a key determinant of the US dollar and therefore gold prices. On Friday, January 12, spot gold hit $1,337.40, having enjoyed a three-day run of $21.40 following an announcement from the Chinese that they could either slow or halt their purchase of US Treasuries. China holds $1.3 trillion worth of US debt, the most of any country.
The Chinese buy Treasuries – effectively lending money to the US government – so that the US can keep buying Chinese goods and China can keep selling their products, earning enough dollars to convert into Chinese yuan to pay workers and suppliers. The People’s Bank of China buys US dollars from exporters, accumulating large forex reserves, and sells them yuan, to keep the dollar higher against the yuan. This gives China a competitive trade advantage.
From November 2016 to November 2017 China’s trade surplus with the US was $416 billion, with the bulk of those earnings in US dollars, South China Morning Post pointed out in an editorial on Monday. Exports rose 10.9% in December.
Whether or not the Chinese follow through (officials later denied the rumour), bond investors got spooked at the prospect of the world’s largest T-bill holder losing faith in US debt, and by extension, the US economy. A large selloff ensued, with the 10-year US Treasury bill hitting its highest yield in 10 months at 2.59% (bond prices and yields are inversely related: when prices drop, yields go up).
The move up was also influenced by the Bank of Japan, which on Jan. 9 trimmed its purchases of Japanese bonds by about $20 billion. The Japanese cutback fueled speculation that the BOJ would end quantitative easing, just as the Federal Reserve did last September; the yen rose immediately by half a percent, as did Japanese bond yields.
Gold-bond yield correlation is weak
While rising bond yields are typically bad for gold, since they increase the opportunity cost of owning gold which pays no income for holding the metal, the present lift in gold prices, even though bond yields are rising, means the correlation is weaker than normal, according to analysts quoted by Kitco.
The head of commodity strategy at TD Securities said that gold is benefiting from uncertainty given that the US dollar is weaker as bond yields push higher.
“This tells me that markets don’t have a lot of confidence in the U.S. at the moment,” [Bart Melek] told Kitco. Vince Lanci, founder of Echobay Partners, said that the fact that gold can rally in a higher bond environment is further proof that the yellow metal has entered a new phase of its bull market. “China buying or not buying Treasuries in the short term is not the big factor… the fact that gold rallied on it means the path of lesser resistance, for now, is up,” he said.
A bear market in bonds
Still, the fact that bond yields are rising is a strong signal to gold investors that: 1/ the demand for US Treasuries is falling and 2/ that the stage is being set for a higher inflationary environment which would mean higher interest rates and increased stock market volatility.
According to a 2017 report from Bank of America Merrill Lynch, when gold prices and bond yields rise in tandem, the stock market tends to move the other way. The report notes both the stock market crashes of 1973 and Black Monday in 1987 were preceded by three quarters of rising bond yields and rising gold. That’s because when both investment vehicles rise, it signals higher inflation, and that leads to rises in interest rates, which are generally bad for stock markets. When stock markets fail, investors turn to more concrete safe havens Ie. gold.
Coupling the current 10-year benchmark Treasury rise, with the fact that a slew of maturing government debt hit the market last week – $32 billion of 10- and 30-year US bonds were sold, along with 4 billion euros of German bonds – “bond King” Bill Gross declared a bear market for bonds. Quotes Bloomberg:
“Bond bear market confirmed,” Gross said in a Twitter posting [last] Tuesday, noting that 25-year trend lines had been broken in five- and 10-year Treasury maturities. The billionaire fund manager at Janus said last year that 10-year yields persistently above 2.4 percent would signal a bear market…
What about inflation?
Bonds tend to sell off when investors believe that more inflation is coming. That’s because the yield gets eaten away by inflation (Eg. you own a 10-year Treasury bill that pays 3%. If inflation is 2%, your real return is only 1%.)
Data last Friday showed that US inflation is now above 2%, with most analysts believing that more rate hikes (an anticipated three more interest rate rises by the Fed this year) have been priced into the inflation rate. Rates could even go higher. In a Wall Street Journal article, Boston Fed President Eric Rosengren said he expected “more than three” rate hikes in 2018 because it wants to get ahead of inflation and not tighten too quickly.
The rise in the two-year Treasury bill – the benchmark Treasury most sensitive to Federal Reserve rate hikes – pushed above 2% last week for the first time since the collapse of Lehman Brothers in 2008, the start of the financial crisis.
The two-year note now provides more income than dividends on the S&P 500 Index. Could this be the harbinger of the next stock market crash?
More debt will hike interest rates, sink the dollar
Meanwhile the elephant in the room is the ballooning US debt. In under a decade, mostly under the Obama Administration, the amount of debt doubled from US$10 trillion to $20 trillion. The chief economist at Goldman Sachs recently revised his deficit projections from below $500 billion in 2018 to over $1 trillion in 2019 due mainly to the Trump tax cuts which will require an additional $200 billion in each of the next four years. How will Congress get the funds? By issuing more Treasuries. Goldman expects net borrowing to go from $488 billion in 2017 to $1.03 trillion this year, and the same amount in 2019. Importantly, under this forecast the debt to GDP ratio rises from 3.7% in 2018 to 5% in 2019, which increases borrower risk. To compensate, and attract T-bill buyers, the Fed is likely to offer higher interest rates. ZeroHedge quotes future Fed chair Jay Powell predicting that is exactly what is going to happen, in a 2012 Fed meeting:
“I think we are actually at a point of encouraging risk-taking, and that should give us pause. Investors really do understand now that we will be there to prevent serious losses. It is not that it is easy for them to make money but that they have every incentive to take more risk, and they are doing so. Meanwhile, we look like we are blowing a fixed-income duration bubble right across the credit spectrum that will result in big losses when rates come up down the road. You can almost say that is our strategy.”
The “big losses” Powell refers to “down the road”, which is actually now, is the extra interest the US government will be forced to pay on its Treasury bills, as the yield curve continues to climb. This will start a vicious cycle that goes something like this: Higher interest rates boost the cost of borrowing for businesses and individuals, thereby slowing the economy. This necessitates more government borrowing, thus pushing up the debt to GDP ratio which makes US T-bills more risky and less attractive to investors. If demand for Treasuries drops, so will the dollar, meaning foreign bond holders get paid in US dollars that are worth less, further slowing demand for them. Finally, as the dollar continues to fall, the US government will have to pay exorbitant amounts of interest on the Treasuries upon maturity, increasing its risk of defaulting on the loans once they become due.
From this brief analysis, it’s easy to see that debt is good for gold. Bullion investors don’t have to worry about the government defaulting on the piece of government debt they own, nor should they be concerned about the value of the currency falling when the T-bill plus interest matures. As long as the gold is in the form of physical metal bullion it’s a safer bet than a T-bill.
Dollar is withering
In a recent post I wrote about how China is hoping to reduce the hegemony of the US dollar, which most commodities are priced in, through the launch of a new oil futures contract. The yuan-denominated oil futures will allow exporters like Russia and Iran to buy and sell their oil through China, thus avoiding US economic sanctions and circumventing the US dollar. Moreover, the yuan will be fully convertible into gold on exchanges in Shanghai and Hong Kong.
This is just the latest move on behalf of China to usurp the economic might of the United States. Between them, Russia and China are moving to kill the dollar. If that ever happens, it will make US-Chinese military conflicts in the South China Sea look like petty squabbles.
At the end of 2015 the Russian Central Bank made the yuan an official reserve currency, and in 2017, the RCB opened its first office in Beijing. The closer cooperation was a result of US sanctions on Russia after the crisis in the Ukraine, and the oil price slump that hit the Russian economy. The two countries have also issued government bonds denominated in each other’s currencies, which are designed to compete with US Treasuries.
Since then trade between Russia and China has been increasing, following in the footsteps of landmark energy deals that have taken place over the last decade. These include the $456 billion gas deal that Russian state-owned Gazprom signed with China in 2014, a $25-billion oil swap agreement Russian oil giant Rosneft signed with Beijing in 2009, and a doubling of oil supplies from Rosneft to China in 2013, valued at $270 billion.
Russia and China are also increasingly sharing technology with possible military applications. The US Congress’ US-China Economic Security and Review Commission reported the export of Russian aerospace technology to China was “challenging US air superiority and posing problems for US, allied, and partner assets in the region.”
Another interesting development is the joint trade in gold between China and Russia. The idea is to create a link between the two gold-trading hubs, Shanghai and Moscow, in order to facilitate more gold transactions.
“In other words, China and Russia are shifting away from dollar-based trade, to commerce which will eventually be backstopped by gold, or what is gradually emerging as an Eastern gold standard, one shared between Russia and China, and which may one day backstop their respective currencies.”
Sound familiar? What they’re talking about is the kind of monetary system that existed before the 20th century – when banks were constrained in their loans by how much gold was in their vaults. The US went off the gold standard in 1971, thereby severing the linkage between the world’s major currencies and gold. Soon afterward, the US dollar became the leading reserve currency.
Trade conflicts: throwing fuel on the fire
While President Trump under his “Make America Great Again” banner has pressured key trading partners including China, Canada and Mexico, the reality is that passing protectionist measures and ripping up existing trade agreements like NAFTA is likely to depress the dollar – further alienating foreign investors who would otherwise flock to the greenback, and hurting the US economy to boot.
For example during NAFTA negotiations last fall, currency strategist Jens Norvig was asked what would happen should NAFTA fall apart. The result he said would not only be dramatic declines in the values of the Mexican peso and the Canadian dollar, but also appreciation of the yuan and the euro versus the dollar.
“In fact, I think over the medium-term, [euro] and [Chinese yuan] would benefit from the U.S. “America First” policy, as it has to make the [dollar] a less attractive reserve currency,” CNBC quoted Nordvig saying. The benefactor, again, will be gold.
Conclusion
Gold rose 12.5% in value last year, shaking off US rate hikes, the frenzied introduction of bitcoin, and record-setting highs on the Dow and S&P 500 exchanges. While some investors have exited the precious metals space to chase alternative realities, aka the crypto world, gold has been, and will continue to be, a solid investment especially during times of economic and political upheaval when the metal functions as a safe haven.
Are there other basic, more fundamental reasons to buy gold? Well, read this excellent article from Bloomberg, ‘Disastrous’ deals sideline gold-mining M&A as metal rises’ posted on MINING.com.
For those who follow economic trends, the latest turbulence in the bond markets is a pretty bullish signal for gold. While there will be daily fluctuations, the short term trend seems to be one of a sustained rally, especially if bond yields continue to rise and the dollar keeps slumping.
The correlation between the bond markets, the dollar and gold is an important determinant of future gold prices. These relationships are something every gold investor should track, to determine ideal entry and extra points for both bullion and gold stocks.
I have bond market trends on my radar screen, and due diligence, which I freely share, on exceptional quality gold exploration juniors on my to do list. Do you?
Comments Off on Bond market bear creating gold bull
A Good Time To Be Buying Gold
November 14th, 2016By Richard Mills.

There’s a lot going on in the world – from Trump being elected in the U.S. to turmoil in the middle east, the China Sea and Turkey, Russia is flexing it’s still considerable might, North Korea’s flinging it’s nukes helter skelter, Japan’s rearming, disease runs rampant and fear escalates about virus mutation, there’s shortages of fresh water with many rivers not reaching their former endpoint and of course climate change is rearing its head to destabilize natural rhythms or cycles. It’d be hard to go back in history and pick a period of time when things weren’t so combustible.
Your author believes gold and silver have never been better safe-haven investments. Inflation, world events, diversification – gold and silver bullion do offer investors leverage.
So too do resource related equities. Junior resource companies, financed to near term production, currently offer the greatest leverage to increasing demand and a rising gold/silver price. This is where the money will be made in the next two years.
It’s a fact junior mining companies outperform senior miners at finding new mineral deposits and generating wealth for stakeholders…
“These are among some of the findings released in a study conducted by resource company strategist MinEx Consulting, which analyzed the performance of explorers and producers operating in Canada between 1975 and 2014. What the consultancy firm found is that, in the last decade, junior companies were responsible for more than three quarters of all new mineral discoveries and were approximately 30 percent more effective than senior companies at generating wealth.”
Aheadoftheherd.com’s editor isn’t looking for huge producers with so much overhead that they can’t profitably mine an ounce of gold. I’m not looking at huge mines with billions and billions of dollars in capex. I’m much much more comfortable with smaller mines having lower capex and under-control operating expenditures.
If you want to invest in the building of something of value – be there as the company moves it’s mineral deposit down the development path towards a mine there are a very few quality junior companies to choose from. Even fewer with the studies done and money already raised to get into production.
These are the situations that are an enormous opportunity to back excellent management teams with your investment money.
Spending
Let’s look at why companies aren’t making a profit:
-One of the biggest reasons is capital expenditures (capex), which is the basic cost of building a mine and its supporting infrastructure.
-There are lower grades being mined and more complex metallurgy.
-Companies are increasingly going into more remote areas that lack infrastructure.
-Environmental regulations are increasing.
-We are seeing more money-grabbing governments and resource nationalization. Miners are an easy target as mining is a long term investment and one that is especially capital intensive – mines are also immobile, so miners are at the mercy of the countries in which they operate. Outright seizure of assets happens using the twin excuses of historical injustice and environmental/contractual misdeeds. There is no compensation offered and no recourse.
Because everything you can imagine is working in a perfect storm to increase costs, and risks, on mining companies, here at aheadoftheherd.com we’re seeking out the smaller mines with low capital costs, uncomplicated metallurgy, no worry of governments seizing our asset and we’re looking in areas with long mining histories.
Northern Vertex mining Corp. TSX.V – NEE
Northern Vertex has activated the historic Moss Mine area (100% owned by NEE) in north west Arizona. With excellent site access – only a 20 minute drive from Bullhead City and its population of 35,000 people there’s excellent infrastructure to support an operational mine and the skilled workforce close by to run it.
The Moss Mine Gold-Silver Project is an epithermal, brecciated, low sulphidation quartz-calcite vein and stockwork system which extends over a strike length of 1,400 meters and has been drill tested to depths of 370 meters vertically.
The Moss mine is a potential heap leach, open pit project that has been advanced to the Feasibility Study stage.
Measured and Indicted oz gold (Au) 377,000.
Measured and Indicted oz silver (Ag) 4,610,000.
The Feasibility Study shows the Moss Mine to be an economically robust, higher margin, lower risk project in one of the world’s premier mining jurisdictions.
 Northern Vertex has just signed a US$20,000,000 million credit agreement with Sprott Lending.
With US$8,500,000 in equipment financing under negotiation, US$7,000,000 in the treasury and capital expenses estimated to be US$33,000,000 to build the mine, development of, and production at NEE’s Moss Mine seems to be a certainty.
Exploration potential to further expand the gold and silver resource certainly exists.
Moss Claim Blocks:
The Company has also identified four high priority targets – all four are situated in close proximity to planned operations facility – that will be the focus of a proposed upcoming multi-phase drill program.
Because Northern Vertex is well advanced along the development path towards a mine the guesswork about grade, size, costs and metallurgy have been taken out of the equation for us. Company management has done the work necessary to give investors the confidence that their project will be a profitable mine.
Conclusion
Northern Vertex TSX.V – NEE has raised the dollars needed to get into production, investors can see they are going mining and cash flow is just over the horizon.
Buying already paid for near term gold and silver production in today’s current global climate of fear and uncertainty might not be such a bad idea.
Northern Vertex is on my radar screen, is it on yours?
If not, maybe it should be.
Comments Off on A Good Time To Be Buying Gold
Unknown Voluntary Servitude
August 31st, 2016By Richard Mills.

Here’s a long debated topic. Should we leave the creation of new money in the hands of bankers or place its creation solely with our government?
Let’s try and answer it.
The Creature from Jekyll Island
On the night of November 22, 1910 a delegation of the nation’s leading financiers, led by Senator Nelson Aldrich, left New Jersey for a very secret ten day meeting on Jekyll Island, Georgia.
Aldrich had previously led the members of the National Monetary Commission on a two year banking tour of Europe. He had yet to write a report regarding the trip, nor had he yet offered any plans for banking reforms.
“Despite my views about the value to society of greater publicity for the affairs of corporations, there was an occasion near the close of 1910, when I was as secretive, indeed, as furtive, as any conspirator. . . . Since it would have been fatal to Senator Aldrich’s plan to have it known that he was calling on anybody from Wall Street to help him in preparing his bill, precautions were taken that would have delighted the heart of James Stillman.” Frank Vanderlip, in the Saturday Evening Post, February 9, 1935
Accompanying Senator Aldrich to Jekyll Island were:
After the Jekyll Island visit the National Monetary Commission “wrote” the Aldrich Plan which formed the basis for the Federal Reserve system.
“In 1912 the National Monetary Association, under the chairmanship of the late Senator Nelson W. Aldrich, made a report and presented a vicious bill called the National Reserve Association bill. This bill is usually spoken of as the Aldrich bill. Senator Aldrich did not write the Aldrich bill. He was the tool, if not the accomplice, of the European bankers who for nearly twenty years had been scheming to set up a central bank in this Country and who in 1912 has spent and were continuing to spend vast sums of money to accomplish their purpose.” Congressman Louis T. McFadden on the Federal Reserve Corporation: Remarks in Congress, 1934
After several failed attempts to push the Federal Reserve Act through Congress, a group of bankers funded and staffed Woodrow Wilson’s campaign for President. He had committed to sign a slightly different version of the Federal Reserve Act than Aldrich’s Plan.
In 1913, Senator Aldrich pushed the Federal Reserve Act through Congress just before Christmas when much of Congress was on vacation. When elected president Woodrow Wilson passed the FED.
“Our secret expedition to Jekyll Island was the occasion of the actual conception of what eventually became the Federal Reserve System. The essential points of the Aldrich Plan were all contained in the Federal Reserve Act as it was passed.” Frank Vanderlip, autobiography, From Farmboy to Financier
“I have unwittingly ruined my country.” Woodrow Wilson later said referring to the FED
The Fed
The US Federal Reserve Bank (FED) is a privately owned company (Wikipedia describes the Fed as a complex business-government partnership that rules the financial world) that controls, and profits immensely by printing money through the US Treasury and regulating its value.
“Some [most] people think the Federal Reserve Banks are U.S. government institutions. They are not … they are private credit monopolies which prey upon the people of the U.S. for the benefit of themselves and their foreign and domestic swindlers, and rich and predatory money lenders. The sack of the United States by the Fed is the greatest crime in history. Every effort has been made by the Fed to conceal its powers, but the truth is the Fed has usurped the government. It controls everything here and it controls all our foreign relations. It makes and breaks governments at will.” Congressional Record 12595-12603 — Louis T. McFadden, Chairman of the Committee on Banking and Currency (12 years) June 10, 1932
“… we conclude that the [Federal] Reserve Banks are not federal … but are independent, privately owned and locally controlled corporations … without day-to-day direction from the federal government.”9th Circuit Court in Lewis vs. United States, 680 F. 2d 1239 June 24, 1982.
The FED began with approximately 300 people, or banks, that became owners (stockholders purchased stock at $100 per share) of the Federal Reserve Banking System. The Fed is privately owned – 100% of its shareholders are private banks, the stock is not publicly traded and none of its stock is owned by the US government.
The US government pushed through the Sixteenth Amendment (which exempted income taxes from constitutional requirements regarding direct taxes) restarted an income tax on Americans to pay the interest to the FED and reorganized the IRS to collect the monies – the interest – “owed” to the FED from its citizens.
Sir Josiah Stamp, president of the Rothschild Bank of England and the second richest man in Britain in the 1920s, said the following in 1927 at the University of Texas:
“The modern banking system manufactures money out of nothing. The process is perhaps the most astounding piece of sleight of hand that was ever invented. Banking was conceived in inequity and born in sin. Bankers own the Earth. Take it away from them but leave them the power to create money, and with a flick of a pen, they will create enough money to buy it back again. Take this great power away from them and all great fortunes like mine will disappear, for then this would be a better and happier world to live in. But if you want to continue to be the slaves of bankers and pay the cost of your own slavery, then let bankers continue to create money and control credit.”
The FED banking system collects billions of dollars in interest annually and distributes the profits to its shareholders – the interest on bonds acquired with its newly-issued Federal Reserve Notes pays the Fed’s operating expenses plus a guaranteed 6% return to its banker shareholders.
The US Congress gave the FED the right to print money at no interest. The FED creates money from nothing, loans it out through banks and charges interest. The FED also buys government debt with money from nothing, and charges U.S. taxpayers interest.
The Grip of Death
“We have, in this country, one of the most corrupt institutions the world has ever known. I refer to the Federal Reserve Board. This evil institution has impoverished the people of the United States and has practically bankrupted our government. It has done this through the corrupt practices of the moneyed vultures who control it.” Congressman Louis T. McFadden in 1932
“The financial system used by all national economies worldwide is actually founded upon debt. To be direct and precise, modern money is created in parallel with debt…The creation and supply of money is now left almost entirely to banks and other lending institutions. Most people imagine that if they borrow from a bank, they are borrowing other people’s money. In fact, when banks and building societies make any loan, they create new money. Money loaned by a bank is not a loan of pre-existent money; money loaned by a bank is additional money created. The stream of money generated by people, businesses and governments constantly borrowing from banks and other lending institutions is relied upon to supply the economy as a whole. Thus the supply of money depends upon people going into debt, and the level of debt within an economy is no more than a measure of the amount of money that has been created.” Michael Rowbotham, ‘The Grip of Death’
The FED is the only for profit corporation in America that is exempt from both federal and state taxes.
Internal Revenue Service (IRS)
The IRS was restarted within months of the FED’s inception. The roots of the IRS go back to the Civil War when President Lincoln and Congress, in 1862, created the position of commissioner of Internal Revenue (The position of Commissioner exists today as the head of the Internal Revenue Service) and enacted an income tax (the initial rate was 3% on income over $800, which exempted most wage-earners) to help pay war expenses. In 1872, seven years after the war, lawmakers allowed the temporary Civil War income tax to expire.
Congress enacted a flat rate Federal income tax in 1894, but the Supreme Court ruled it unconstitutional the following year because it was a direct tax not apportioned according to the population of each state.
Senator Aldrich was instrumental in the re-structuring of the American financial system through a federal income tax amendment, the 16th – he had originally opposed an income tax as communistic a decade before. The 16th Amendment gave Congress the authority to tax the income of individuals without regard to the population of each State:
“The Congress shall have power to lay and collect taxes on incomes, from whatever source derived, without apportionment among the several States, and without regard to any census or enumeration.”
In 1906 David Graham Phillips wrote a series of articles published in Cosmopolitan claiming that politicians were receiving huge payments from large corporations to argue their case in the Senate. Phillips claimed that the main figures in this scandal was Aldrich and Arthur P. Gorman of Maryland.
David Graham Phillips was murdered on 23rd January, 1911. Two months later Aldrich resigned from Congress.
The Federal Reserve was conceived and given birth by an unholy alliance of American and British bankers. The FED buys U.S. debt with money printed from nothing, then charges U.S. taxpayers interest. The US government pushed through the federal income tax amendment, restarted an income tax on Americans to pay the interest to the FED and reorganized the IRS to collect the monies – the interest – “owed” to the FED from its citizens.
Since the Fed’s creation in 1913 the dollar has lost more than 96% of its value.
Undoubtedly the greatest achievement of the FED has been to transform America from being the world’s foremost creditor nation to the world’s largest debtor nation.
Aldrich’s motto, when questioned about his activities and the reasoning behind them, was to “Admit nothing. Explain nothing.”
Fog the mirror
“Many economists see the power to manipulate policy in reaction to the ups and downs of the economy as the natural evolution of fiscal policy. The purpose of this power is to ward off or lessen financial disasters through keeping rates artificially low or introducing more money into the system, or doing the opposite to rein in inflation during periods of growth.” The Atlantic.
Alan Greenspan was chairman of the Federal Reserve from 1987 to early 2006. Greenspan used monetary policy to ignite one of the longest economic booms in history. Of course booms can soon turn to bust and nowhere was the boom more evident than in the housing industry – the sub-prime crisis collapsed the housing boom just after Greenspan left the Fed.
The Great Recession started in December of 2007 and took a sharp downward turn in September 2008. It was started by the U.S. sub-prime crisis which burst the housing bubble. Businesses failed, consumers lost wealth estimated in the trillions of dollars and economic activity and international trade slowed:
After Fed chairman Greenspan left office, the Federal Reserve, under the stewardship of new chairman Ben Bernanke, started easing monetary policy aggressively. By December of 2008, the federal funds rate was between 0 and 1/4 percent. The Fed had used up its traditional stimulus, all the ‘Creature from Jekyll Island’ had left was the ability to print money so they started throwing cash at everything.
Additional stimulus was injected into the economy by:
Late in 2008 there was a run on ultra safe money market accounts – according to AMG Data Services a record $140 billion was pulled out in one day.
In response to the continuing crisis and a stalling economy the US Federal Reserve initiated Quantitative Easing and Operation Twist.
Quantitative Easing (QE) 1, 2, & 3
In September of 2008 the $1.7 trillion QE1 was started. The Fed purchased mostly mortgage backed securities and established a commercial paper lending facility.
In October of 2010 QE2 started. At $600 billion, QE2 was much smaller then QE1 and its buying was mostly confined to purchasing long term government bonds.
QE1 & QE2 failed to restart the economy and housing market.
Operation Twist
Operation Twist is the Fed’s initiative of buying longer-term Treasuries while simultaneously selling shorter-dated issues in order to bring down long-term interest rates.
By purchasing longer-term bonds, the Fed drives up prices which forces yields down – price and yield move in opposite directions. Selling shorter-term bonds causes their yields to go up because their prices fall. These two actions “twist” the shape of the yield curve, hence the name Operation Twist.
QE3
On September 13, 2012, the Fed announced that it would buy $40 billion a month of mortgage-backed securities until the unemployment rate fell below 6.5 percent, or the expected inflation rate rose above 2.5 percent. In December the Fed added buying $45 billion/month of longer-term Treasury securities per month – QE3 is more than one trillion dollars a year.
In 1Q2013, which comprised the first three months of QE3, the Fed increased the size of its balance sheet by $285 billion, or 9.8 percent.
During the first 3 months of QE3, the Fed increased the monetary base by 10.83 percent.
Incestuous relationships
In July of 2011, I was one of the first to bring to your attention to the incredible fact that the US Federal Reserve had secretly given away $16 TRILLION dollars;
“The first ever GAO (Government Accountability Office) audit of the US Federal Reserve was recently carried out due to the Ron Paul/Alan Grayson Amendment to the Dodd-Frank bill passed in 2010. Jim DeMint, a Republican Senator, and Bernie Sanders, an independent Senator, while leading the charge for an audit in the Senate, watered down the original language of house bill (HR1207) so that a complete audit would not be carried out. Ben Bernanke, Alan Greenspan, and others, opposed the audit.
What the audit revealed was incredible: between December 2007 and June 2010, the Federal Reserve had secretly bailed out many of the world’s banks, corporations, and governments by giving them US$16,000,000,000,000.00 – that’s 16 TRILLION dollars.” Richard Mills, aheadoftheherd.com
It gets worse, much worse, in fact it’s downright incestuous. Let’s do a follow up and see who, besides foreign banks and corporations from Scotland to South Korea, received a large chunk of that money.
But first know this – banks like JP Morgan are some of the largest creditors of the bailed out countries. Instead of having to write off their foreign losses the US Federal Reserve bailouts enabled them to be paid in full.
The Government Accountability Office (GAO) investigates potential conflicts of interest. The GAO did investigate the $16 trillion giveaway and laid out the findings but did not name names. Later those names were released – here’s three of the more shocking cases…
The hands that feed
Below are some of the 18 Fed board members who gave their own banks four trillion dollars:
“The Fed outsourced virtually all of the operations of their emergency lending programs to private contractors like JP Morgan Chase, Morgan Stanley, and Wells Fargo. The same firms also received trillions of dollars in Fed loans at near-zero interest rates. Altogether some two-thirds of the contracts that the Fed awarded to manage its emergency lending programs were no-bid contracts. Morgan Stanley was given the largest no-bid contract worth $108.4 million to help manage the Fed bailout of AIG.” Mises.ca
Parasitic banksters and their political puppets
The financial sector parasites, the banksters and their political puppets, that have historically fed on our society had never been so brazen. The looting of the public treasury is very much in the open – if anyone cares to look – and done with impunity.
This is all happening because our elected politicians do not work for the people, our elected leaders have stuck their snouts deep in the trough of power and self indulgence, representative democracy has been co-opted by big-moneyed interests and political parties represent their establishment not the people’s interests.
“The lending suites that were set up for months and years, beyond the initial crisis point, were focused on how to keep banks profitable, not just how to keep them alive. The banks were able to access emergency lending facilities, or change themselves into bank holding companies overnight, to borrow at next to nothing, and if they chose, lend back to the government at a tidy profit. You didn’t have to think at all to make money. And you didn’t have to worry about that toxic balance sheet, because the government was going to help you grow your way out of it. They will also facilitate mergers to help decimate your competition. The money that the banks borrowed for nothing could have just as easily gone to underwater homeowners. There’s nothing special about the banks except that they know the Fed policymakers personally.” David Dayen, firedoglake.com
Mayer Amschel Bauer Rothschild, founder of the International Banking House of Rothschild said:
“Let me issue and control a nation’s money and I care not who writes the laws.”
The Rothschild brothers, already laying the foundation for the Federal Reserve Act, wrote the following to New York associates in 1863:
“The few who understand the system will either be so interested in its profits or be so dependent upon its favours that there will be no opposition from that class, while on the other hand, the great body of people, mentally incapable of comprehending the tremendous advantage that capital derives from the system, will bear its burdens without complaint, and perhaps without even suspecting that the system is inimical to their interests.”
Conclusion
Should we leave the creation of new money in the hands of bankers or place its creation solely with our government?
The answer is solely with the government but with a caveat.
Here’s bubble blower ex Fed chair Alan Greenspan…“If we went back on the gold standard and we adhered to the actual structure of the gold standard as it existed prior to 1913, we’d be fine. Remember that the period 1870 to 1913 was one of the most aggressive periods economically that we’ve had in the United States, and that was a golden period of the gold standard. I’m known as a gold bug and everyone laughs at me, but why do central banks own gold now?”
The following link takes you to an excellent article by Nathan Lewis describing the gold standard system in use during the period Greenspan talks about. A very interesting and eye opening read.
This second link takes you to an article written by Murray N. Rothbard, another excellent read on the history of the gold standard and why we are suffering our current monetary chaos.
“The borrower is servant to the lender.” The Bible
“When you get in debt you become a slave.” Andrew Jackson
The Gold Standard is amenable to today, and it’s certainly preferable to the actions, and consequences, of those who have enslaved us in unknown voluntary servitude.
Imposition of a gold standard should be on all our radar screens. Is it on yours?
If not, maybe it should be.
Comments Off on Unknown Voluntary Servitude
Getting A Heartbeat
May 17th, 2016By Richard Mills.
As a general rule, the most successful man in life is the man who has the best information
PricewaterhouseCoopers LLP (PwC) has recently released their 48th annual British Columbia Mining Report.
We all know commodity prices have been on a downward trend for the past five years. We also know several mines in the province have been put on care and maintenance and many early stage projects have seen their funding dry up.
Let’s take a look at some of the stats in PwC’s B.C. mining report:
and one more in early 2016.
$338 million in 2014.
The Association for Mineral Exploration British Columbia (AME BC) report, Framing the Future of Mineral Exploration in British Columbia is an overview about:
Let’s focus on the decreasing land base for a moment. In 1977, 4% of the land base in British Columbia was closed to mineral exploration; today over 18% is closed. Access to another 33% of the land base is severely limited.
Discovering hidden mineral deposits requires access to large tracts of land to explore, but the actual land used for mining purposes is just 0.05% of British Columbia, of which more than 40% is under reclamation.
(1)
“Between 1927 and 1967, Cominco explored more than 1,000 properties in Canada. Of these, only 78 were of sufficient interest to warrant a major exploration program. Sixty were found to contain insufficient ore to justify production; 18 were brought into production, but of these, 11 were not sufficiently profitable to permit recovery of the original investment. Only seven of the original 1,000 properties became profitable mines. During that 40-year period, the company spent more than $300 million in its search for new mines.” Ken Sumanik, Potential impact on mining
Try and imagine the success rate, and cost, of trying to duplicate what Cominco did over half a century ago using today’s dollars and considering the low hanging mining fruit has been mostly picked.
“On average, a prospect will reach development stage between 15 and 20 years after discovery. In many cases, it takes years longer. The mines currently in production in BC, and those in the environmental assessment process, are a direct result of successful discoveries made through prospecting and exploration work conducted in the past, much of it decades ago. Very few grassroots exploration projects reach the advanced development stage, but each exploration program creates value to British Columbians through community and regional development and by increasing the region’s geological knowledge.” AMEbc
The TSX Venture composite index – heavily weighted with junior exploration companies – was down 27% in 2015 and is down 76% since 2011. The TMX Markets Group says B.C.’s mineral exploration companies raised $688.2 million through private placement financings in 2015.
That’s down 57 per cent from the $1.6 billion they were able to raise in 2014 and, going back to 2007, the lowest amount ever raised. Globally, total mining-related financing activity across all exchanges has fallen by 13.6% annually since 2007, an aggregate decline totaling more than 60% over that period.
“2015 saw an almost “complete drop off of any type of fundraising” among junior mining firms, save for…“survival financing,” private placements of say $50,000 to $500,000 to pay for things such as financial statements, listing fees and to maintain mineral claims.” David Penner, Economic Downturn hits B.C. mining exploration hard, Vancouver Sun
“What we saw in 2015, was another tough year of continued downturn in commodity prices, which remain the biggest threat to the industry’s profitability.” Mark Platt, PwC
Not all doom and gloom
Junior exploration companies continue to be hammered by a lack of capital and investor confidence, as a result most B.C. miners and explorers are hunkered down hoping for the best. Unfortunately, if low exploration levels continue for too long, eventually the mining projects already in the pipeline get developed and there is nothing to take their place.
Thankfully it’s not all doom and gloom…some companies continued to acquire, explore, develop and advance projects in 2015.
In 2015, British Columbia attracted 19% of all exploration dollars spent in Canada, compared to just 6% in 2001. And 19 of the top 100 exploration projects in Canada are in B.C.
British Columbia should be a mining powerhouse, consider:
Junior versus Major
Know this…
Many of the major mines in the world were discovered by B.C. based junior exploration companies – and closer to home, over 70% of all discoveries in Canada have been made by junior companies.
It’s a fact in the mining world that most discoveries are made by junior mining companies. Juniors, not majors, own the world’s future mines and juniors are the ones most adept at finding these future mines. They already own, and find more of, what the world’s larger mining companies need to replace reserves and grow their asset base.
A junior resource company’s place in the food chain is to explore for, find and develop, to a certain point, the world’s future mines; nowhere are juniors more important to mining then right here in British Columbia, a vast and under explored treasure trove of minerals.

There’s no doubt mining brings a great deal of revenue to the province, but let’s remember one important point – juniors find the deposits and prove them up to the point where a major would step in and buy them. Consider another point – when was the last time you heard of a major mining company making a discovery?
Today the relationship between juniors and majors is so inextricably linked that it’s doubtful a major mining company could replace its mined reserves, let alone grow them, without keeping a close eye on junior’s activities and a check book handy.
One of the bright spots in the mineral extraction sector in B.C. is precious metals – gold and silver.
“Gold has special properties that no other currency, with the possible exception of silver, can claim. For more than two millennia, gold has had virtually unquestioned acceptance as payment. It has never required the credit guarantee of a third party. No questions are raised when gold or direct claims to gold are offered in payment of an obligation; it was the only form of payment, for example, that exporters to Germany would accept as World War II was drawing to a close. Today, the acceptance of fiat money — currency not backed by an asset of intrinsic value — rests on the credit guarantee of sovereign nations endowed with effective taxing power, a guarantee that in crisis conditions has not always matched the universal acceptability of gold.
If the dollar or any other fiat currency were universally acceptable at all times, central banks would see no need to hold any gold. The fact that they do indicates that such currencies are not a universal substitute.” Golden Rule, Federal Reserve Chairman Alan Greenspan (Ret.)


World Gold Council
Leverage
Gold and silver, in this author’s opinion, are extremely undervalued financial instruments. A portion of every investors portfolio needs to be dedicated to holding gold and silver bullion. After all, if the world’s central banks feel the need to diversify out of fiat currencies it might be a good idea for us to pay attention.
But historically, and perhaps especially so today, the greatest leverage to rising precious metal prices has been owning the shares of junior resource companies focused on acquiring, discovering and developing precious metal deposits.
Conclusion
New Carolin Gold Corp. (LAD:TSX, LADFF:OTC) has an exciting gold project and is one company that’s definitely not hunkering down.
LAD has, despite tough capital raising conditions for most juniors, been able to easily raise the money necessary to begin working on what might become it’s Coquihalla Gold Camp, potentially an entirely new, 144 sq km 100% owned gold district.
Success here could open up a lot of people’s minds about junior mining overall.
Revitalizing New Carolin’s Ladner Gold Project could make it a cornerstone industry for the community of Hope, B.C.
All of us living in British Columbia need projects like this to succeed to reap the social and economic benefits that come from resource extraction.
New Carolin is definitely getting a heartbeat. Interest in the company and it’s great project – as evidenced by a huge volume increase and share price appreciation – is picking up.
New Carolin should be on every precious metal investors radar screen. Is it on yours?
If not, maybe it should be.
Comments Off on Getting A Heartbeat
The Protein Ladder
May 9th, 2016By Richard Mills.
As a general rule, the most successful man in life is the man who has the best information
In 1800, three percent of the world’s population lived in urban areas. By 1900, roughly 14 percent of the world’s population were urbanites and 12 cities had 1 million or more inhabitants.
In 1950, 30 percent – 746 million people – resided in urban centers and the number of cities with over 1 million people had grown to 83.
In 1975 three cities had populations of 10 million or more. In 1990, there were ten “mega-cities” with 10 million inhabitants or more, which were home to 153 million people or slightly less than seven per cent of the global urban population at that time. Megacities (minimum population of 10 mil to qualify) numbered 16 in 2000.
In 2014, there were 28 mega-cities worldwide, home to 453 million people or about 12 percent of the world’s urban dwellers. Of 2014’s 28 mega-cities, sixteen are located in Asia, four in Latin America, three each in Africa and Europe, and two in Northern America.
By 2014, 54% of the total global population or 3.7 billion people, resided in urban centers. This number is expected to grow to 5 billion by 2030 and double by 2050.
The UN’s DESA Population Division reported that between 2014 and 2050 the largest urban growth, @ 37 per cent, will take place in India, China and Nigeria. By 2050, India is projected to add 404 million urban dwellers, China 292 million and Nigeria 212 million.
China’s rural spending, in 2012, was 2.78 trillion yuan or US$447 billion – less than one-fifth of what urban households spent. Although spending five times more than their rural counterparts urbanites accounted for only 52% percent of China’s population in 2012.
The annual average per capita disposable income in rural China reached 10,489 yuan ($1,693) in 2014. In urban areas, the average per capita disposable income was 29,381 yuan.

India total disposable personal income


UN Population Division
Almost all urbanization by 2030 will occur in the developing world.
This is a very important development because global discretionary consumption has not only gotten a significant lift from urbanization but this lift is going to continue as hundreds of millions more emerging consumers are going to acquire the means to spend on more than basic necessities.
“The rise of China’s middle class will help lift consumption share in GDP to around 50% by 2030 from 36% in 2014″. ANZ greater China economists Li-Gang Liu and Louis Lam
“If India continues on its current high growth path, India’s middle class will swell by more than ten times from its current size of 50 million to 583 million people, incomes will almost triple over the next two decades, and the country will become the world’s fifth–largest consumer market by 2025.” McKinsey Global Institute
A rising income means more money in the household budget.
The first thing a newly prosperous middle class urbanite does is change his/her diet.
This change of diet among newly prosperous, urban populations in developing countries is the most important factor stoking the change in global food demand. The new middle class consumers forgo plant based calories in favor of adding more protein from meat and dairy products to their diets. This is called the Protein Ladder, where the ground floor, or basic diet, consists almost entirely of plant matter.
The Protein Ladder:
5.Grain fed beef
4.Grass fed beef
3.Milk, other dairy products
2.Pork
Step 1.Chicken and eggs
Ground Floor = Rice, beans and bread
In 1980, the world ate 133 million tonnes of meat and drank 342 million tonnes of milk.
By 2002, consumption had increased to 239 million tonnes of meat and 487 million tonnes of milk.
Over the past 50 years, global meat production has almost quadrupled from 78 million tonnes in 1963 to a current total of 308 million tonnes per year. The IAASTD predicts that this trend will continue, especially because the growing urban middle classes in China and other emerging economies will adapt to the so-called western diet of people in North America and Europe with its burgers and steaks.” Globalagriculture.org
The United Nations Food and Agriculture Organization (FAO) estimates that by 2030 global annual consumption of meat will stand at 373 million tonnes and 736 million tonnes of milk.
The FAO estimates that by 2050 global meat production will increase to 455 million tonnes.
The Cost of Climbing the Protein Ladder
The more people there are on this planet and the more Asians, and others, decide they want a western style diet the more grains/oilseeds are needed to feed them. It takes up to 8 kilograms of grain to produce one pound of beef – less for pork, chicken, milk or eggs – between 2kg and 6kg. As meat consumption soars, more grain is needed to feed more livestock.
And many of those very same grains needed to raise the animal protein, the beef, pork and chicken the newly minted middle class wants – are also the very same grains the world’s poorest people, the ones who can’t afford to climb the protein ladder, depend on to survive.
Livestock raising is already the world’s largest user of land resources, with pasture and land dedicated to the production of feed representing almost 80% of the total agricultural land.
If the entire world population were to consume as much meat as the Western world does – 176 pounds of meat per capita per year – the global land required would be two-thirds more than what is presently used.
In 2013, the cattle population reached 1,494 million animals, up 54% from 1963. The number of chickens grown for human consumption increased from 4.1 billion to 21.7 billion between 1963 and 2013. During the same period, the pig population grew by 114% to reach 977 million.
Livestock agricultural reduces the available acreage for direct human grain consumption in two ways:
Currently farmed animals eat one-third of the world’s cereal production. In the industrialized world, two-thirds of the agricultural land produces cereals for animal feed. In the United States, farmed animals, mostly cattle, consume almost twice as much grain as is eaten by the entire US population. Over 100 million acres of US agricultural land is used to grow grain for animals and still more is imported.
The dietary shift from predominantly starch-based food, to meat and dairy, which require more water, is the greatest to impact on water consumption over the past 30 years. Water for irrigation and food production constitutes one of the greatest pressures on freshwater resources.
Producing one kg of rice requires approximately 3,500 liters of water while one kg of beef requires 15,000 liters. Producing that one kg of meat requires as much water as an average domestic household uses over ten months (50l/person/day).
Agriculture accounts for around 70% of global freshwater withdrawals, even up to 90% in some fast-growing economies
Estimates indicate that there will not be enough water available on current croplands to produce food for the expected population in 2050 if we follow current trends and changes towards diets common in Western nations (3,000 kcal produced per capita, including 20 percent of calories produced coming from animal proteins).
Feeding everyone in 2050 could require 50% more water than is needed now.
Conclusion
If everybody on this planet was a vegetarian we could feed 40 billion people.
If everybody ate like the average American we can feed 2.5 billion.
The ‘Father of the Green Revolution,’ Norman Borlaug said: “I now say that the world has the technology – either available or well advanced in the research pipeline – to feed on a sustainable basis a population of 10 billion people.”
The UN’s median population prediction says there will be 9.7 billion of us in 2050.
We aren’t even close to doing everything right agriculture wise. After adding climate change to the mix, it looks like you might want to have a shift in diet on your radar screen.
Comments Off on The Protein Ladder
Our Day of Reckoning
April 22nd, 2016By Richard Mills.
As a general rule, the most successful man in life is the man who has the best information
The second half of the 20th century saw the biggest increase in the world’s population in human history.
Our population surged because:
The global death rate has dropped almost continuously since the start of the industrial revolution – personal hygiene, improved methods of sanitation and the development of antibiotics have all played a major role.
The term Green Revolution refers to a series of research, development, and technology transfers that happened between the 1940s and the late 1970s.
The initiatives involved:
Tractors with gasoline powered internal combustion engines (versus steam) became the norm in the 1920s after Henry Ford developed his Fordson in 1917 – the first mass produced tractor. This new technology was available only to relatively affluent farmers and it was not until the 1940s tractor use became widespread.
Electric motors and irrigation pumps made farming and ranching more efficient. Major innovations in animal husbandry – modern milking parlors, grain elevators, and confined animal feeding operations – were all made possible by electricity.
Advances in fertilizers, herbicides, insecticides, fungicides, antibiotics and growth hormones all led to better weed, insect and disease control.
There were major advances in plant and animal breeding – crop hybridization, artificial insemination of livestock, and genetically modified organisms (GMOs).
Further down the food chain came innovations in food processing and distribution.
All these new technologies increased global agriculture production with the full effects starting to be felt in the 1960s.
Cereal production more than doubled in developing nations – yields of rice, maize, and wheat increased steadily. Between 1950 and 1984 world grain production increased by over 250% – and the world added over two billion more people to the dinner table.
The Green Revolution
The modernization and industrialization of our global agricultural industry led to the single greatest explosion in food production in history. The agricultural reforms and resulting production increases fostered by the Green Revolution are responsible for avoiding widespread famine in developing countries and for feeding billions more people since. The Green Revolution also helped kick start the greatest explosion in human population in our history – it took only 40 years (starting in 1950) for the population to double from 2.5 billion to five billion people.
Norman Borlaug, an American scientist, is often called the Father of the Green Revolution (GR). In 1943, he began conducting research in Mexico regarding developing new, disease resistant high yielding varieties of wheat. Mexico then combined Borlaug’s wheat varieties with the agricultural technologies being developed at the time and was able to become a wheat exporter by the 1960s – prior to Mexico’s Green Revolución the country was importing almost half of its wheat supply.
Improving seeds is what people have been doing since the beginning of agriculture – people selected the biggest seeds that were easiest to thresh and stored them for planting the next crop. But in Mexican test plots something special happened – improved varieties of short stemmed wheat dramatically increased yields.
“Borlaug’s innovations would change wheat production worldwide forever. Borlaug began by tackling stem rust, a highly contagious mold-like fungus that breeds on a variety of grasses and transfers to wheat just as it comes to maturity. Stem rust could ruin entire fields of wheat at once. After extensive testing, MAP staff discovered that while foreign varieties were more resistant to stem rust than native wheat varieties, foreign varieties tended to mature late in the season. Furthermore, higher-yielding wheat varieties were more rust-susceptible than lower-yielding ones.
The MAP wheat program made three key discoveries. First, enhancing soil, particularly through nitrogen supplementation, increased wheat yield even with ongoing stem rust problems. Second, to make new hybrid crosses, in 1945 Borlaug began “shuttle-breeding,” or moving seed from Chapingo, with its early growing season, to Sonora, which had a later growing season. Shuttle breeding cut development time in half and fostered varieties that could thrive across a variety of conditions. Finally, Borlaug began working with “Norin” dwarf wheat imported from the U.S., a short straw variety that was both rust-resistant and higher yielding. When it was incorporated into the elaborate crosses already developed, wheat production rose dramatically. Mexico became self-sufficient in wheat production by 1956, and in MAP’s first twenty years, Mexico tripled its wheat production.” The Mexican Agriculture Program (MAP),
What makes these improved plants successful are:
These high yield plant varieties need:
The “revolution” in Green Revolution is well deserved. The new seeds along with chemical fertilizers, pesticides and more irrigation replaced traditional farming practices in many areas of the world.
The Green Revolution’s use of hybrid seeds, irrigation, chemical fertilizers, pesticides, fossil fuels, farm machinery, and high-tech growing and processing systems combined to greatly increase agriculture yields. The Green Revolution is responsible for feeding billions – and likely enabling the birth of billions more people.
Unfortunately the high yield growth is tapering off and in some cases declining. This stagnation, and in some cases decline, in productivity is due to a depleting natural resources base such as a steep fall in ground water table levels because irrigation has depleted water aquifers and chemical fertilizers and pesticides have impaired water quality, while their overuse has contributed to a deficiency of micro-nutrients in the soil and overall deteriorating soil health.
Narrowly focusing on increasing production as the Green Revolution
did cannot alleviate hunger because it failed to alter three simple facts;
An increase in food production does not necessarily result in less hunger – if the poor don’t have the money to buy food increased production is not going to help them. The most severe consequences of non-existent or more expensive staple foods are first felt in developing countries whose citizens spend an exorbitant percentage of their incomes feeding themselves and their family compared to families in the western world. Almost half of the planets population lives on less than $2.50 a day – roughly 1.4 billion people live on less than $1.25 per day. When food prices soar these people lack the money to feed themselves and their children – when your living on a couple of dollars a day, or less, and most of your income already goes to feed your family there’s no money to cover a price spike in the cost of survival.
Secondly, a narrow focus on production ultimately defeats itself as it destroys the base on which agriculture depends – topsoil and water.
One of the most basic, fundamental problems we’ve created for ourselves is the impact of human activities on the land we need to cultivate for our very survival.
“The top 20cm of soil is all that stands between us and extinction.” Luc Gnacadja, executive secretary of the UNCCD
It takes 100 years to generate a single millimeter of topsoil – 24 billion tons of fertile soil disappear annually.
Over the past four decades, 15 percent of the Earth’s land area – an area larger than the United States and Mexico combined – have been degraded through human activities. Desertification doesn’t refer to the advance of deserts which can and do expand naturally. Desertification is a different process where land in arid or semi-dry areas becomes degraded – the soil loses its productivity and the cover vegetation disappears or is degraded to the point where wind and water erosion can carry away the topsoil leaving behind a highly infertile mix of dust and sand.
Land degradation, and the eventual resulting desertification of dry land ecosystems is most often caused by human activities such as:
Climate change can accelerate and intensify the degradation process.
And thirdly to end hunger once and for all, we must make food production sustainable and develop secure distribution networks of needed foodstuffs.
Our agriculture system is concentrated on producing a very few staple crops – there is a very serious lack of crop diversity. Corn, wheat, rice and soy are the main staples and production is oftentimes half a world away from where the majority of the crop would be consumed. The world’s extreme poor exist almost exclusively on what is a ‘buy today, eat today’ plant based diet – wheat, corn, soy or rice provide the bulk of their calories.
Taken together, this means if we get hit by a particularly bad harvest in one area, if a severe El Nino strikes, or more localized severe weather phenomena strikes, food supplies can get totally out of control in many countries.
Considering that the global food supply chain is weak (easily disrupted by lack of transportation, weather, insurgency, stealing) and non-existent in many areas then you have a recipe for potential disaster in many regions of the world.
If a person was so inclined they could bury their head in the sand and write off all of the above as nothing more than something someone in the poorer, undeveloped parts of the world has to worry about. After all we here in the west have our grocery stores and unlimited food supplies, right?
That might not be prudent thinking.
Western consumers are, for all intent and purposes, totally dependent on retail food stores for their subsistence. Yet these stores have only 2 – 3 days of inventory on hand at any one time. If any kind of a short term crisis hits, let alone a massive disruption in the food supply chain, stockpiling and hoarding will quickly empty store shelves.
Ecological Overshoot
For most of human history we’ve been consuming resources at a rate lower than what the planet was able to regenerate.
Unfortunately we have crossed a critical threshold. The demand we are now placing on our planets resources appears to have begun to outpace the rate at which nature can replenish them.
The gap between human demand and supply is known as ecological overshoot. To better understand the concept think of your bank account – in it you have $5000.00 paying monthly interest. Month after month you take the interest plus $100. That $100 is your financial, or for our purposes, your ecological overshoot and its withdrawal is obviously unsustainable.
Today humanity uses the equivalent of 1.6 planets to provide the resources we use.
The United Nations (U.N.) says if current population and consumption trends continue, by the 2030s, we will need the equivalent of two Earths to support us.
Conclusion
A day of reckoning is coming…
According to the U.N. the world’s population reached 7.3 billion as of mid-2015 and is growing by 1.18 per cent or 83 million people annually.
Using the U.N.’s medium projection, the world’s population is expected to reach 8.5 billion in 2030, and to increase to 9.7 billion in 2050 and 11.2 billion by 2100.
Population growth, climate change and our destructive attitude towards our home, the Earth, and our wasteful use of her resources, are humanity’s main concerns going forward.
Here’s a link to Norman Borlaugs Nobel Lecture, December 11th, 1970. It’s a fascinating speech and one all of us need to read.
Borlaug is on record saying the Earth, if we did everything right and technological advances kept improving yields, could support 10 billion people. Unfortunately yields have not kept pace, further technological advances are slow in coming, population growth in undeveloped countries is out of control and something Borlaug never had a chance to fully consider the effects of, global climate change, has in your author’s opinion, vastly lowered the 10 billion figure.
Our coming day of reckoning should be on all our radar screens. Is it on yours?
If not, maybe it should be .
Comments Off on Our Day of Reckoning
The No Fresh Water Planet
April 4th, 2016By Richard Mills.
As a general rule, the most successful man in life is the man who has the best information
Our planet is 70 percent covered in ocean – 98% of the world’s water is in the oceans. Which makes 98% of the world’s water unfit for drinking, or irrigation.
Just 2% of the world’s water is fresh. The vast majority of our fresh water, 1.64%, is in its frozen state and locked up in the polar ice caps, Greenland’s ice sheet and glaciers. Once it melts its contaminated by seawater, either by melting directly into the oceans or running to the world’s oceans through a stream or river.
Our available freshwater, .36% of the water on the planet, is found underground in aquifers and wells, and on the surface in lakes and rivers.
After the glaciers melt many of our rivers will cease to exist, and a vast number of lakes will no longer be filled by anything more than melting snow – runoff – and rainfall. Refilling our lakes and aquifers by relying on only precipitation, in a warming and much drier climate, does not sound efficient or dependable.
“In many parts of the world, in particular in the dry, mid-latitudes, far more water is used than is available on an annual, renewable basis. Precipitation, snowmelt, and stream flow are no longer enough to supply the multiple, competing demands for society’s water needs. Because the gap between supply and demand is routinely bridged with non-renewable groundwater, even more so during drought, groundwater supplies in some major aquifers will be depleted in a matter of decades. The myth of limitless water and the free-for-all mentality that has pervaded groundwater use must now come to an end. NASA Jet Propulsion Laboratory hydrologist James Famiglietti, Nature Climate Change
Freshwater aquifers are one of the most important natural resources in the world today, but in recent decades the rate at which we’re pumping them dry has more than doubled. These fast shrinking underground reservoirs are essential to life on this planet. They sustain streams, wetlands, and ecosystems and they resist land subsidence and salt water intrusion into our fresh water supplies.
GRACE
NASA’s Gravity Recovery and Climate Experiment (GRACE) satellites measure anomalies in the Earth’s gravity brought about by changes in water supplies.
Hydrologists combined the information from GRACE with soil moisture and other data to isolate changes in groundwater storage. They built a renewable groundwater stress (RGS) ratio that compares the rate at which the groundwater is being used to its availability as reflected by the rate at which the aquifer is being replenished. Of the 37 aquifers studied, 16 showed positive accumulating trends and 21 showed declining trends.
Twenty-one of the world’s 37 largest aquifers are losing water at a greater rate than they’re being refilled.
They include:
Most of the unstressed (the 16 accumulating water) aquifers are located in remote forested and rain fed regions. Most of the stressed (21 losing water) aquifers were located in regions with high amounts of rangeland and cropland.
Out of the 21 aquifers losing water, eight were found to be overstressed – meaning there is almost no natural replenishment while five more were extremely stressed signifying they had some water flowing back into them.
The Arabian Aquifer System is an important water source for more than 60 million people and it’s the most overstressed in the world. The Indus Basin aquifer of northwestern India and Pakistan is the second-most overstressed, the Murzuk-Djado Basin in northern Africa is third. California’s Central Valley, used heavily for agriculture and suffering rapid depletion, was labeled extremely stressed.


For most, a no fresh water planet
There are currently 7.3 billion of us sharing the world’s fresh water resources. By 2050 the United Nations (UN) expects the world’s population to reach 9.7 billion. Feeding everyone in 2050 could require 50% more water than is needed now.
Already approximately 1 billion people go to bed hungry each night.
Almost 1 in every 15 children in developing countries dies before the age of 5, most of them from hunger-related causes. Somewhere in the world someone starves to death every 3.6 seconds – most are children under the age of five.
An estimated 90% of the people expected to be added to the population, by 2050, will be in developing countries.
This means hundreds of millions more marginalized people will feel the extreme pinch of shortages in what those people need the most – water, food and clothing – the bare essentials necessary for survival.

Conclusion
Human life, on our one and only planet, is based on sourcing fresh water.
Most of the aquifers in India and the shallow aquifer under the North China Plain are replenishable. When these are depleted, the maximum rate of pumping is automatically reduced to the rate of recharge or refill.
For fossil aquifers – such as the vast U.S. Ogallala aquifer, the deep aquifer under the North China Plain, or the Saudi aquifer – depletion brings pumping to an end.
Scientists do not know how much water is left in the world’s aquifers – they can discern trends but they cannot yet determine the total volume that exists.
We need a coordinated global effort to determine how much is left, how much we can take on a yearly sustainable basis from each aquifer and put an actionable, by ALL, conservation plan into place.
Sounds like a lot to do but…
The consequences of a major percentage of our global population running out of fresh water for drinking and irrigation, and how soon we could all be living in a no fresh water world, should be on all our radar screens. Definitely on mine, is it on yours?
If not, it should be.
Comments Off on The No Fresh Water Planet
The Greatest Issue
March 28th, 2016By Richard Mills.
Ahead of the Herd
As a general rule, the most successful man in life is the man who has the best information
Serbian astrophysicist Milutin Milankovitch is best known for developing one of the most significant theories relating to Earths motions and long term climate change.
Milankovitch developed a mathematical theory of climate change based on the seasonal and latitudinal variations in the solar radiation received by the Earth from our Sun – it was the first truly plausible theory for how minor shifts of sunlight could make the entire planet’s temperature swing back and forth from cold to warm.
Milankovitch’s Theory states that as the Earth travels through space around the sun, cyclical variations in three elements of Earth/sun/geometry combine to produce variations in the amount of solar energy that reaches us. These three elements are:
These orbital processes are thought to be the most significant drivers of ice ages and, when combined, are known as Milankovitch Cycles.
Other Climate Change Drivers:
These climate change “drivers” often trigger additional changes or “feedbacks” within the climate system that can amplify or dampen the climate’s initial response to them:
In 1985 the Russian Vostok Antarctic drill team pulled up cores of ice that stretched through a complete glacial cycle. During the cold period of the cycle CO2 levels were much lower than during the warm periods before and after. When plotted on a chart the curves of CO2 levels and temperature tracked one another very closely – methane, an even more potent greenhouse gas, showed a similar rise and fall to that of CO2.

Small rises or falls in temperature – more, or less sunlight – seemed to cause a rise, or fall, in gas levels. Changing atmospheric CO2 and methane levels physically linked the Northern and Southern hemispheres, warming or cooling the planet as a whole. In the 1980s the consensus was that Milankovitch’s Cycles would bring a steady cooling over the next few thousand years.
As studies of past ice ages continued and climate models were improved worries about a near term re-entry into the cold locker died away – the models now said the next ice age would not come within the next ten thousand years. In other words temperatures are going to continue to rise.
It’s obvious that the orbital changes, as explained by Milankovitch’s Theory, initiate a powerful feedback loop. The close of a glacial era comes when a shift in sunlight causes a slight rise in temperature – this raises gas levels over the next few hundred years and the resultant greenhouse effect drives the planet’s temperature higher, which drives a further rise in the gas and water vapor levels and so on.
The earth will continue to warm, polar ice caps will melt, so will the Greenland ice sheet and most glaciers. More sunlight will be absorbed by the Earth’s oceans, causing increased evaporation. Water vapor is a greenhouse gas and amplifies twofold the effects of other greenhouse gases.
With Earth’s ice gone there will be significantly less sunlight reflected back into space, vast expanses of Arctic tundra will thaw releasing unbelievable amounts of methane, a greenhouse gas twenty times more potent then CO2.

By the end of this century scientists expect our weather to have changed substantially. One of the changes being the subtropical dry zones will push pole-ward, crawling deep into regions such as the American Southwest and southern Australia, which will be increasingly susceptible to prolonged and intense droughts.
The polar jet stream has already been altered, wide swinging north-south deviations (meanders) have become the norm. Deviating far from its normal path and meandering north into Canada the jet stream brings warm air. While dipping far south over Europe the polar jet stream brings record cold and snow.
Ocean currents will be altered, further impacting our climate, and sea levels will rise. Freshwater aquifers will suffer from saltwater intrusion, once habitable zones will become uninhabitable,

As the meanders meander extreme weather follows
According to science the world is going to continue to get warmer, cyclical variations in three elements of earth/sun/geometry have combined to produce more sunlight reaching the earth. Increased sunlight caused a slight rise in temperature – greenhouse gas levels rose and the resultant greenhouse effect is driving the planet’s temperature higher, which drives a further rise in gas levels and so on.

“Humanity’s experiment with planetary warming has reached a new level of extremes. Last month was the hottest February in 137 years of record keeping, according to data released Thursday by the National Oceanic and Atmospheric Administration. It’s the 10th consecutive month to set a new record, and it puts 2016 on course to set a third straight annual record.
It was a big month, not only the hottest February but the most unusual warmth for any month on record. Unprecedented temperatures in the Arctic, averaging an astonishing 20 degrees Fahrenheit above normal, melted away layers of ice to record-low levels. The heat helped prolong the longest planet-wide coral bleaching event. These grim milestones coincide with the biggest recorded jump in carbon dioxide, the most important greenhouse gas.
To be sure, some of this is the result of a monster El Niño weather pattern lingering in the Pacific Ocean. But the broader trend is clear: We live on a planet that is warming rapidly, with no end in sight. Since 1980, the world has set a new annual temperature record roughly every three years, and 15 of the hottest 16 years ever measured are in the 21st century.
The El Niño that started last year produced some of the hottest temperatures ever witnessed across great swaths of the equatorial Pacific. By some measures, this may now be the most extreme El Niño on record. It has triggered powerful typhoons, spoiled harvests in Africa, and contributed to vast fires in Indonesia. In California, El Niño precipitation is replenishing the snowpack and beginning to refill drought-ravished reservoirs.
Results from the world’s top monitoring agencies vary slightly, but NASA, NOAA, and the Japan Meteorological Agency all agree that February was unprecedented. Its heat was experienced differently around the world, though few regions escaped it entirely. The map above, from NASA, shows a few blue spots of cooler-than-average temperatures and plenty of record-breaking red. The most extreme heat swept the Arctic, where ice levels were at the lowest on record for this time of year.” Tom Randell, Bloomberg ‘Stunning Global Heat Wave Pushes Planet Into Uncharted Territory’
A quiet disaster
Drought is a normal recurring feature of the climate in most parts of the world. It doesn’t get the attention of a tornado, hurricane or flood. It’s slower and less obvious, a much quieter disaster creeping up on us unawares.
Climate change is currently causing abnormal warming of many regions, warmer temperatures increase the frequency and intensity of heat waves and droughts.
We can prepare for some climate change consequences with public education, water conservation programs, limiting pumping from our freshwater aquifers to recharge rates and putting in place early warning systems for extreme heat events.
The collapse of the world’s earliest known empire was because of drought.
Akkad
The Akkadians of Mesopotamia forged the world’s first empire more than 4,300 years ago. The Akkad’s seized control of cities along the Euphrates River and swept up onto the plains to the north – in a short period of time their empire stretched 800 miles, all the way from the Persian Gulf to the headwaters of the Euphrates, through what is now Iraq, Syria and parts of southern Turkey.
Tell Leilan was a small village founded by some of the world’s first farmers. It’s located in present day Syria and has existed for over 8,000 years. The Akkad’s conquered Tell Leilan around 2300 B.C. and the area became the breadbasket for the Akkadian empire.
After only a hundred years the Akkadian empire started to collapse.
In 1978, Harvey Weiss, a Yale archaeologist, began excavating the city of Tell Leilan. Everywhere Weiss dug he encountered a layer of dirt that contained no signs of human habitation. This dirt layer corresponded to the years 2200 to 1900 B.C. – the time of Akkad’s fall.
The Curse of Akkad
For the first time since cities were built and founded,
The great agricultural tracts produced no grain,
The inundated tracts produced no fish,
The irrigated orchards produced neither wine nor syrup,
The gathered clouds did not rain, the masgurum did not grow.
At that time, one shekel’s worth of oil was only one-half quart,
One shekel’s worth of grain was only one-half quart. . . .
These sold at such prices in the markets of all the cities!
He who slept on the roof, died on the roof,
He who slept in the house, had no burial,
People were flailing at themselves from hunger.
The events described in “The Curse of Akkad” were always thought to be fictional. But the evidence Weiss uncovered at Tell Leilan (along with elevated dust deposits in sea-cores collected off Oman) suggest that localized climate change – in Tell Leilan’s case a three hundred year drought – desertification – was the major cause.
“Since this is probably the first abrupt climate change in recorded history that caused major social upheaval. It raises some interesting questions about how volatile climate conditions can be and how well civilizations can adapt to abrupt crop failures.” Dr. Harvey Weiss, Yale University archeologist
Ghost Empire
Perhaps the most notable empire decline due to drought, or altered precipitation patterns, was the Maya empire. At the peak of their glory the Maya ranged from Mexico’s Yucatán peninsula to Honduras. Some 60 Maya cities – each home to upwards of 70,000 people – sprang up across much of modern day Guatemala, Belize, and Mexico’s Yucatán Peninsula.
“The early Classic Maya period was unusually wet, wetter than the previous thousand years…Mayan systems were founded on those [high] rainfall patterns. They could not support themselves when patterns changed.” Douglas Kennett, an environmental anthropologist at Pennsylvania State University.
During the wettest centuries, from 440 to 660, Maya civilization flourished.
Then things got worse, much worse. The following centuries, from the mid 600’s to roughly 1000 A.D., did not treat the Mayas kindly, they suffered repeatedly from drought, oftentimes extreme drought lasting a decade and more.
Between 1020 and 1100 the region suffered the longest dry spell in many millennia. The Maya’s suffered crop failure after failure, famine, death and eventually mass migration.
“Yucatecan lake sediment cores … provide unambiguous evidence for a severe 200-year drought from AD 800 to 1000 … the most severe in the last 7,000 years … precisely at the time of the Maya Collapse.” Richardson Gill, The Great Maya Droughts
After 200 years of drought, really just an eye-blink of time, famine and drought held sway and people walked away leaving behind a ghost empire.
North American Drought
“Once upon a time, much of the state of California was a barren desert. And now, thanks to the worst drought in modern American history, much of the state is turning back into one. Scientists tell us that the 20th century was the wettest century that the state of California had seen in 1000 years. But now weather patterns are reverting back to historical norms…” Michael Synder, The Economic Collapse

The above drought picture is very scary considering it is a snapshot of what should be the wettest part of the year in many areas.

Water is a commodity whose scarcity will have a profound effect on the world within the next decade – the danger to us from the worsening ecological overshoot concerning the world’s fresh water supply makes the reevaluation of our values mandatory. We will have to drastically change the way in which we view our freshwater as a resource.
The central issues for us over the next few decades are climate change and the usage of our fresh water resources.
Water, An Endangered Global Resource
Our groundwater is being used up at record rates and claims to ownership are becoming increasingly contentious. It won’t be long before the first water war begins.
There’s a lot of water on the planet we inhabit – an estimated 326 million trillion gallons or 1,260,000,000,000,000,000,000 liters.
That makes it hard to believe that there are somewhere between 780 million to one billion people without basic and reliable water supplies and that more than two billion people lack the requirements for basic sanitation.
Harder still to believe are reports water is going to get much dearer in our near term future – yet Peter Voser the chief executive of the world’s second-largest energy company, Royal Dutch Shell, warned us in June 2011, that global demand for fresh water may outstrip supply by as much as 40 per cent in 20 years if current fresh-water consumption trends continue.
Our planet is 70 percent covered in ocean, ninety-eight percent of the world’s water is in the oceans – which makes it unfit for drinking or irrigation because of salt.
Just two percent of the world’s water is fresh, but the vast majority of our fresh water, 1.6 percent, is in its frozen state and locked up in the polar ice caps and glaciers. Once it melts it contaminated by seawater, either by melting directly into the oceans or running to the world’s oceans through a stream or river.
Our available freshwater (.396 percent of total supply) is found underground in aquifers and wells (0.36 percent) and the rest of our readily available fresh water, 0.036 percent, is found in lakes and rivers.
Aquifers
Freshwater aquifers are one of the most important natural resources in the world today, but in recent decades the rate at which we’re pumping them dry has more than doubled. The amount of water pumped has gone from 126 to 283 cubic kilometers per year – if water was pumped as rapidly from the Great Lakes they would be dry in roughly 80 years.
These fast shrinking underground reservoirs are essential to life on this planet. They sustain streams, wetlands, and ecosystems and they resist land subsidence and salt water intrusion into our fresh water supplies.
Many people think of aquifers as underground lakes but that’s not the case – the water is held between rock particles. Water infiltrates into the soil through pores and cracks until it reaches what is called the zone of saturation – all of the spaces between the rocks are filled with water, not air.
This zone of saturation occurs because water infiltrating the soil reaches an impermeable layer of rocks it can’t soak through.

Water held in aquifers is known as groundwater. The water table is located at the top of the zone of saturation. Groundwater represents about 30 percent of the available fresh water on the planet – surface water accounts for less than one percent. The rest is locked up in glaciers or the polar ice caps.
Almost all of the planet’s liquid fresh water is stored in aquifers. Some of the largest cities in the developing world – Jakarta, Dhaka, Lima, and Mexico City – depend on aquifers for almost all their water.
Most rural areas pump groundwater from wells drilled into an aquifer.
There are two types of aquifers: replenishable (a permeable layer of rock above the water table and an impermeable one beneath it) and non-replenishable (also known as fossil aquifers, no recharge) aquifers. Most of the aquifers in India and the shallow aquifer under the North China Plain are replenishable. When these are depleted, the maximum rate of pumping is automatically reduced to the rate of recharge or refill.
For fossil aquifers – such as the vast U.S. Ogallala aquifer, the deep aquifer under the North China Plain, or the Saudi aquifer – depletion brings pumping to an end.
Depletion Effects

The red area on the above map is the aquifer, the grey area is the size of the area that would be required to catch enough rainfall to replenish that aquifer and make up for all the water currently being pumped out of it.
When groundwater is depleted the effects (besides lessening of supply or no more water) can be drastic. Land subsidence happens when porous formations that once held water collapse resulting in the surface layer settling. Water won’t compress, but when the water is sucked out of an aquifer air fills the void between the rocks where the water use to be. Air compresses and the ground sinks or compacts – the aquifer will never hold the same amount of water again.
One study shows that from 1986 to 1992 some parts of the Mexico City Aquifer’s water levels dropped 6 to 10 meters. Areas of Mexico City, as a consequence, have fallen as much as 8.5 meters. The subsidence (ground compaction) is also damaging the sewer system, potentially leading to untreated sewage mixing with fresh water in the aquifer.
In March of 2009, Enoch City in Iron County, Cedar Valley Utah, contacted the Utah Geological Survey (UGS) about what they believed to be a fault running through one of their new subdivisions. It was determined by the UGS that it was a fissure caused by the groundwater level dropping as much as 114 feet since 1939 – the cause was determined to be due to pumping more groundwater than is recharged (refilled).
Another effect of over pumping is saltwater intrusion. If too much groundwater is pumped out from coastal aquifers saltwater may flow into them causing contamination of the aquifer. Many coastal aquifers – the Biscayne Aquifer near Miami and the New Jersey Coastal Plain aquifer for example – have problems with saltwater intrusion.
Streams, rivers and lakes are almost always closely connected with an aquifer. The depletion of aquifers doesn’t allow these surface waters to be recharged – lowering water levels in aquifers is being reflected in reduced amounts of water flowing at the surface.
This is happening along the Atlantic Coastal Plain, groundwater depletion is also responsible for the Yellow River in China not reaching the ocean for months at a time, the failure of the Colorado River in the U.S. and the Indus River in Pakistan failing to reach the ocean every day.
“If you let the population grow by extending the irrigated areas using groundwater that is not being recharged, then you will run into a wall at a certain point in time, and you will have hunger and social unrest to go with it. That is something that you can see coming for miles.” Marc Bierkens of Utrecht University in Utrecht, the Netherlands
There is widespread surface and groundwater contamination that makes valuable water supplies unfit for other uses.
Power Supply Will Be Impacted By Water Shortages
Electricity enables our modern life style – the degree of dependency we have built into our lives in regards to “power on demand” has raised expectations that plentiful electricity will be available to us 24/7.
“Electrical power, in the short span of two centuries, has become an indispensible part of modern day life. Our work, leisure, healthcare, economy, and livelihood depend on a constant supply of electrical power. Even a temporary stoppage of power can lead to relative chaos, monetary setbacks, and possible loss of life. Our cities live on electricity and without the customary supply from the power grid, pandemonium would break loose.” Dieselserviceandsupply.com
Power plants are completely dependent on water for cooling, they are overheating and utilities are shutting them down or running their plants at lower capacity.
If the water levels in the rivers they use for cooling drop too low, the power plant – already overworked from the heat – won’t be able to draw in enough water and if the cooling water discharged from the plant raises already high river water temperatures above safe environmental limits a plant will be forced to shut down.
The lack of rain, and the incessant heat, has also increased the need for irrigation water for farming, meaning increasing competition between the agricultural and power generation sectors for the same water.
‘Burning Our Rivers: The Water Footprint of Electricity’ by River Network reports…
“For every gallon of residential water used in an average household, five times more is used to provide that home with electricity via hydropower turbines and fossil fuel power plants (40,000 gallons each month).
Electricity production by coal, nuclear and natural gas power plants is the fastest-growing use of freshwater in the U.S., accounting for more than about ½ of all fresh, surface water withdrawals from rivers and lakes. This is more than any other economic sector, including agriculture.”
The average nuclear plant requires 2725 liters of water per megawatt hour for cooling, coal 1890 liters of water and natural gas plants 719 liters per megawatt hour.
Conclusion
The greatest issue facing us in the 21st century is how we will use and share the planets less than half a per cent of usable freshwater.
Investment in water management as a percentage of GDP has dropped by half in most countries since the late 1990s.
Advances in technology, innovation, and best practices/conservation are already clashing with finite water resources, relentless population growth, changing diets, a lack of investment in water infrastructure and increased urban, agricultural and industrial water usage.
Climate change is causing the Earth to warm, precipitation is shifting from the mid-latitudes to the low and high latitudes – wet areas are becoming wetter and dry areas drier. Less rainfall in the mid-latitudes means less new water to refill the aquifers that are being depleted the fastest.
Are more frequent droughts, long heat waves and an increasing population going to continue to strain power generation in the future?
Water is a commodity whose scarcity will have a profound effect on the world within the next decade – water scarcity makes the reevaluation of our values mandatory. We will have to drastically change the way in which we view our freshwater as a resource.
Are our fresh water resources on your radar screen?
If not, maybe they should be.
Comments Off on The Greatest Issue
Copper wired for higher prices
October 29th, 2015By Richard (Rick) Mills.
My article titled ‘Give It A Doubt’ was about population growth, urbanization in developing countries and the one billion people predicted to join the consuming classes by 2025.
“One billion people will enter the global consuming class by 2025. They will have incomes high enough to classify them as significant consumers of goods and services…” McKinsey Global Institute, Urban world: Cities and the rise of the consuming class
Some of these new consumers are going to be Americans but the majority are in developing countries, they might not want to be Americans but they do want at least a modest piece of what we’ll call the American lifestyle, the cell phones, flat screen TV’s, a nicer apartment, a car or maybe a motorcycle, washer/dryer, a fridge, AC – the amenities of a modern society and all the necessary infrastructure that goes with a well functioning competitive modern economy.
But what if all these new one billion consumers were to start consuming, over the next 12 years, just like an American? What’s going to happen to the world’s mineral resources if one billion more ‘Americans’ are added to the consuming class?
Let’s look at copper – here’s how much copper each of them would need to consume, per year, to live the American lifestyle…
Per capita consumption of copper in the United States was 10 kilograms per person 1965, the same in 1995. In Japan per capita consumption increased from 6 kilograms per person to 11 kilograms per person over the same time period. Copper consumption in Korea in 1965 was less than 1000 tons. By 1995, Korea’s consumption of copper had reached 637,000 tons, or more than 14 kilograms per person.
In China, even after years of economic growth, per capita copper usage is about 5.4 kg. As China’s populace urbanizes, builds up its infrastructure and becomes more of a consuming society, there’s no reason to suspect Chinese copper consumption won’t approach or even surpass U.S., Japanese and  South Korean levels. There’s 1.3 billion people in China, several billion more in developing countries – India, with its 1.2 billion people, is presently using 0.5 kg of copper per person. Africa, the fastest growing continent, has virtually no copper consumption per capita.
One billion new consumers by 2025. Can everyone who wants to live an American lifestyle? Can everyone everywhere have everything we in the developed parts of our world have?
“Concern about the extent of mineral resources arises when the stock of metal needed to provide the services enjoyed by the highly developed nations is compared with that needed to provide comparable services with existing technology to a large part of the world’s population. Our stock data demonstrate that current technologies would require the entire copper and zinc ore resource in the lithosphere and perhaps that of platinum as well. Even a lower level of services could not be sustained worldwide because a continuing supply of new metal is needed to make up for inevitable losses in the recycling of the metal stock-in-use.
Substitution has the potential to ameliorate this situation, but one should not automatically assume that technology will produce a satisfactory substitute for every service at an affordable price and precisely when needed.
…anthropogenic and lithospheric stocks of at least some metals are becoming equivalent in magnitude, that world-wide demand continues to increase, and that the virgin stocks of several metals appear inadequate to sustain the modern ‘‘developed world’’ quality of life for all Earth’s peoples under contemporary technology…Do we really envision a developed world quality of life for all of the people of the planet…?” R. B. Gordon, M. Bertram, and T. E. Graedel, Metal Stocks and Sustainability
According to the International Monetary Fund (IMF) the consumption of metals typically grows together with income until real GDP per capita reaches about $15,000–$20,000 per capita (2005 international $) as countries go through a period of industrialization and infrastructure construction.

Countries by 2012 GDP (PPP) per capita, based on World Bank figures and current Int$
A few country’sstand out as well below the IMF’s $15,000.00:
Since they are still a considerable distance from the point where further increases in GDP per capita no longer increase copper consumption per person, China, Indonesia, the Philippines, India and Pakistan (and the other 113 out of 180 countries listed below the IMF’s 15,000 Int$ cutoff) are likely to continue to add significantly to global demand for copper for some time to come.
Capex/opex costs escalating
Mining is getting more difficult. The low hanging fruit has been found and put into production long ago. And these deposits are showing their age, here’s an example…
BHP Billiton just announced (Oct. 20th 2015) copper output dropped 3% yoy and 13% compared to last quarter because of declining grades at Escondida, the world’s largest copper mine. The company also said that despite plans to spend billions of dollars on operational improvements, including a $3.4 billion water project, the anticipated 27% decline in grade would be only partially offset.
Mining is an extremely capital intensive business for two reasons. Firstly mining has a large, up front layout of construction capital called Capex – the costs associated with the development and construction of open-pit and underground mines. There are often other company built infrastructure assets like roads, railways, bridges, power generating stations and seaports to facilitate extraction and shipping of ore and concentrate.
Capex costs are escalating because:
There is also continuously rising Opex, or operational expenditures, to consider. These are the day to day costs of operation; rubber tires, wages, fuel, camp costs for employees etc.
“A typical mining contract no longer specifies just rents and royalties, payable to the state. It specifies exactly what the mining firm will build—a power plant, a water-supply system, a communications network—and how these things will be shared with the public.” The New Bronze Age, Tim Heffernan
The bottom line? It is becoming increasingly expensive to bring new mines on line and run them.
Disruption allowance
Copper mining is notorious for disruptions and analysts use a “disruption allowance” – 800,000 to 1,000,000 tonnes per annum.
According to ICBC Standard Bank, 2015 has seen a record 1.33m tonnes of mine disruptions and that does not include the latest power shortages (forcing production cutbacks) in Zambia.
Reasons for disruption in mining are numerous:
All these reasons are combining to tighten metal supply, push many markets into future deficits and are laying the groundwork for price gains.
Supply-side disruptions
There have been supply-side disruptions, including periods of drought followed by incessant rains and floods in Chile the world’s largest copper miner. The Chilean copper association has reduced its production targets for 2015 as a result of weather disruptions.
Grades are expected to fall at Escondida (the world’s largest copper mine) as well as the Collahuasi JV between Anglo and Glencore.
Chilean state copper company Codelco is running into serious problems in maintaining production, let alone increasing it. Aging mines, high capex requirements and a $21 billion funding shortfall by the Chilean government to fund Codelco’s production plans is leaving Codelco wondering how to keep production flowing.
There have also been mining operation disruptions in Indonesia. The country imposed a ban on exports of unprocessed ores negatively impacting copper exports. Workers also blockaded PT Freeport’s Grasberg Mine in Indonesia.
Clashes between police and protesters left four people dead at MMG’s Las Bambas mine in Peru. Opposition from rural communities to mining in Peru (world’s third largest copper producer) is very strong.
In Zambia, Canadian miner First Quantum said power restrictions are likely to hit copper supplies. In September 2015, Glencore announced its idling mines in Zambia and the Democratic Republic of Congo (DRC).In a bid to cut costs, Glencore will reduce output by 400,000t at its African copper mines over the next 18 months removing 1-2% of copper supply from the market.
A copper mine in Papua New Guinea is stopping production due to dry weather.
Freeport-McMoRan announced announced in August it is cutting output at its El Abra mine in Chile in half and idling two US mines. Freeport also has predicted lower output at its massive Grasberg mine in Indonesia related to El Niño weather patterns.
Anglo American’s Los Bronces mine in central Chile, the world’s sixth-largest copper producer, is being affected by water scarcity. Anglo warned in February that the drought Chile was suffering could drop production by 4% off the company’s total production for the year.
Cochilco, Chile’s copper commission, states water scarcity is “a latent risk for mining in Chile”.
“Lower rainfall and river flow has led the levels of aquifers and reservoirs to drop or dry up completely, giving miners fewer options. In Chile, the situation is complicated by the fact that many of its copper mines are located in the Atacama, the world’s driest desert.
Output at BHP Billiton’s Escondida, the world’s largest copper mine, in the bone-dry Atacama, fell 2 percent in the second half of 2014, weighing on a strong operating performance.” Drought in Chile curbs copper production, to trim global surplus, Reuters
Chile produces a third of the world’s copper and has seen a seven fold increase in energy costs over the last ten years, also because of a severe water shortage in the high desert, where most of the country’s major copper mines are located, water must be pumped from the ocean to almost 800 meters above sea level and then pumped hundreds of kilometers to the mines, of course the seawater must also be desalinated.
Capital Economics’ senior commodities economist Caroline Bain has numerous concerns regarding the copper market;
“Persistent strike action at Latin American copper mines as well as planned closures…El Niño’s potential impact on supply…the weather phenomenon may lead to another bout of floods at mines in Latin America – heavy rains and flash floods in Chile forced several copper mines to suspend operations in March this year – and unusually dry weather in Indonesia.”
Capital Economics also says:
A long term structural trend in the copper mining business started to become evident two decades ago. Shortfalls in targeted production are now characterized by a fall in grades and recoveries as well as unexpected disruptions.

Brook Hunt
“Since 2000, average head grades for copper, without adjusting for production weightings, declined from 1.3% to 1.1% in 2012. Furthermore, the weighted average head grade for mined copper is likely less than 1% as several of the world’s largest copper mines have been in production for many decades and are now mining extremely low grade ore (less than or equal to 0.5% Cu). As head grades decline, costs rise for a given tonnage.” ~ Kitco.com, Multi-Year Global Copper Market Outlook
A Yale University study said new discoveries of copper have raised global reserves by just 0.63 percent per year since 1925 but usage has risen at 3.3 percent per year.
“Copper does not often appear in a pure form in nature, the way gold forms nuggets. Instead, it combines with other elements to form stony minerals, of which the copper makes up only a small part. Fifty years ago, ore from the average pit mine was 1.5 percent copper. Most of that rich ore is gone: The average today is 0.6 percent. For every ton of copper extracted, nearly 167 tons of ore is processed and nearly 167 tons of tailings produced.” The New Bronze Age, Tim Heffernan
Country Risk
Resource extraction companies, because the number of discoveries was falling and existing deposits were being quickly depleted, have had to diversify away from the traditional geo-politically safe producing countries.
“For many developed nations within the Organization for Economic Co-operation and Development (OECD), developing significant new (Greenfield) copper mining projects has become a serious challenge as stricter regulations, environmental concerns, and an inability to accurately predict capital expenditures (Capex) prohibitively increase project costs without removing the risk of significant political opposition…” Kitco

“National governments are no longer the only, or even in many cases the primary, source of political risk in mining projects. Political risk can stem from local governments, international and local NGOs, community groups, local competitors or any other group advancing political objectives. Similarly, the types of issues that mining companies have to deal with are quite varied. These range from having to deal with things like corruption, NGO scrutiny, maintaining a social license to operate, a lack of clarity over the implementation of mining legislation through to poor infrastructure and HIV/AIDS.” ~ Ben Cattaneo, Managing political risk in mining
The move out of “safe haven” countries has exposed investors to a lot of additional risk.
Demand and supply growth

Global copper demand and supply growth rates from 2007 to 2015 ststista.com

Global copper consumption from 2010 to 2016 (in 1,000 metric tons) statista.com


Escondida produced over 1.1 million tonnes of copper in 2014. Yet the above chart, from Melbourne-based and Hong Kong-listed MMG, shows an expected production drop from Escondida to 800,000 tonnes in 2017. The expected production shortfall from Grasberg, in Indonesia, is equaling frightening.
“Peru has been the favoured destination for copper investment in recent years.
New mines coming on stream in the country in the following months and 2016 will double production to 2.8 million tonnes, placing the country in second place globally behind Chile.
According to data from the Peruvian Institute of Economics, however, social conflicts and red tape are making that goal difficult, as they have already caused the delay of $21.5 billion worth of mining projects in recent years.
Meanwhile the Apurimac region, near the Las Bambas Project, continues to be under martial law following last months unrest (four dead and 16 seriously injured – Rick). During such period, civil liberties including freedom of association and movement are restricted, while police are allowed to enter houses without search warrants.” MMG’s gigantic Las Bambas mine in Peru to open next year despite protests, Mining.com
Of the largest 28 copper mines in the world, 21 are not expandable.
Going Solar
“China’s installed solar energy capacity is set to soar to 200 gigawatts (GW) by 2020 from around 36 GW in 2015, according to projections from China’s Renewable Energy Industry Association. Minerals consultancy CRU estimates 6,000 tonnes of copper is used per GW of capacity.
Wind power is projected to reach 250 GW by 2020, according to industry estimates. About 3,850 tonnes of copper is used per GW of wind capacity, according to an average of industry estimates compiled by Reuters.
These, alongside a steady increase in demand from China’s electric vehicle sector of around 200,000 tonnes over the next five years, account for more than 2 million tonnes of copper, compared with current forecasts on total copper consumption over the period of about 105 million tonnes.” China push into solar, wind power to heat up global copper markets, Melanie Burton Reuters
The U.S. Energy Information Administration (EIA) says; “Future demand for solar photovoltaics will be affected by major countries’ goals for installed solar capacity. More than 50 countries have established national solar targets, amounting to more than 350GW by the year 2020. The current top six countries in terms of total installed solar capacity – Germany, Italy, Japan, Spain, France, and China – represented 76 per cent of installed capacity in 2012, but only 61 per cent of the global target total for 2020. Reaching 350GW by 2020 would require average annual installments of 40GW from 2013 through 2020, which is equivalent to manufacturing production in 2013 and well within current PV manufacturing capability of 60GW per year.”
Minerals consultancy CRU estimates 6,000 tonnes of copper is used per GW of installed solar energy capacity. 350 GW by 2020 use is – just for solar, not wind, not electric cars – 2.1 mil lbs of copper. That’s the entire annual 2014 production of two Escondida’s.
A study by Wood Mackenzie found that there will be a 10 million tonne supply deficit by 2028. That’s equal to the annual production of the world’s biggest copper mine multiplied by 12.50 at MMG’s forecast 2017 production figures for Escondida.
The world’s copper miners are cutting back production and massively curtailing exploration/development…
Houston we have a problem…

Visualcapitalist.com

Visualcapitalist.com
“In terms of copper the current weak copper price is largely because there has been something of a hiatus in Chinese copper purchases in line with something of a downturn in the Chinese economic growth. Note this is not a recession in the economy, but a downturn in the levels of growth seen in the recent past. The Chinese economy still seems to be growing, but at a slower rate (6.9% economic growth as of Oct 1st 2015 versus historic 9% – Rick). The analyst bandwagon has seized on the slowdown as showing that the supercycle, primarily generated by Chinese demand for industrial metals of all kinds, has thus ended. The copper article stems from analysis by senior Bernstein analyst, Paul Gait, that in fact the Chinese generated supercycle is only around one-third into its course and the Asian dragon still has a huge amount of ground to make up on all other industrialised nations in terms of per capita metal consumption (and then comes India and Africa – Rick).
In turn the recent slowdown in Chinese economic growth has seen metal prices fall to production costs only now being just about covered by income from sales, whereas traditionally the copper mining sector operates on the basis of a 50% premium of sales to costs. As a consequence the big copper miners are cutting back heavily on costs, leading to a drastic fall in exploration expenditures, curtailment and cancellation of big new capital projects and expansions and some closures of now uneconomic existing mining operations to satisfy shareholder and institutional demands for profit maintenance, or at least recovery.
But, at the same time many of the major producing mines are seeing mill head grades running substantially above reserve grades which can only lead to declining output, without major plant expansions to counterbalance the trend. And finance for such major expansions is becoming more and more difficult to come by. With exploration curtailed, and nowadays huge lead times in taking a major new mine from discovery to production (figures of 30 years are being quoted) the world is facing a major copper shortage in the years ahead.” Copper and gold – parallels in massive supply deficit scenarios, Lawrie Williams, lawrieongold.com
Consider the following facts:
Mine production of many metals shows us a number of similarities:
Conclusion
The world’s urban population is expected to nearly double in the next 30 years. Globally infrastructure is in need of major rebuilds measured in the trillions of dollars worth of capital investment. Consider electrification of the global transportation system, the growing move to solar and wind, that’s millions of tonnes of additional copper use. Throw in aging mines, resource nationalism and exploration cutbacks.
The market is not factoring in basic supply and demand elements. Copper has been oversold, the market is already very tight and we are entering into an era of copper supply deficits meaning there is no long term justification for low prices.
In a report published in early October 2015, the International Copper Study Group (ICSG) changed their April 2015 mindset. They are now saying that there will be a 130,000 mt copper supply deficit in 2016 instead of the previously forecast 230,000 mt surplus.
The ICSG also reduced its 2015 estimated 360,000 mt surplus to just 41,000 mt.
Let’s leave the last word to Commerzbank, who, in a note to their clients said; “The appraisal of the ICSG would justify significantly higher copper prices.” Indeed.
Is the supply, and price, of copper and a couple of copper focused junior resource companies, on your radar screen?
If not, they all should be.
Comments Off on Copper wired for higher prices
AOTH – BSS Life Sciences
July 25th, 2015
By Richard Mills.
An endoscope is the medical device used – by direct insertion – to visualize suspicious masses in the hollow organs of the body such as the gastrointestinal tract, esophagus, lungs, urinary tract and uterus.
In 1805, Philip Bozzini used a rudimentary, light-guiding tube he created (a Lichtleiter – light guiding instrument) to view the urinary tract, pharynx, and rectum.
 |
 |
In 1853, Antoine Jean Desormeaux developed an instrument to view urinary structures. Desormeaux called his instrument an “endoscope.”
In the 1960’s fiber optics allowed a major reduction in the size of the endoscope and helped clarify the doctor’s view. Use of endoscopes in the practice of medicine exploded.
The endoscopy procedure is used to confirm a diagnosis when other tools, such as an MRI, X-ray, or CT scan are considered inappropriate or unclear.
Endoscopies are commonly performed in the diagnosis of cancer; for taking samples of tissue, called biopsies, to find out whether it is cancerous as well as for complete excision (the cutting out) of suspicious lesions.
There are many different types of endoscopes and depending on the site in the body, and the type of procedure, endoscopy may be performed by a doctor or a surgeon, and the patient may be fully conscious or under general anesthetic.
Endoscopes are also used in laparoscopic surgery in which a small incision is made, usually in the navel, through which a viewing tube is inserted. This allows the doctor to examine the abdominal and pelvic organs on a video monitor connected to the tube.
Laparoscopes are also utilized in surgery to visualize various organs and tissues within the body during surgical removal and to avoid damage to adjacent organ and vascular systems and other critical structures. Laparoscopy is less invasive than regular open abdominal surgery.
Because of the endoscope biopsies of the intestines or lungs can be done without the need for major surgery.
White Light
Visible light, or what we call “white light” has been utilized in endoscopes for decades to guide the physician and surgeon so they can “see” the cancer in the organ of interest and subsequently for biopsy and in the removal of suspicious masses.
However, white light has visualization limitations for all cancer types because white light cannot pass through tissue or blood and cannot illuminate tumors beneath the skin surface.
In addition, white light is not  effective in visualizing the borders of the tumor to determine where it starts and ends (the margins) especially after the initial removal of the main mass.
If the surgeon does not remove all the cancerous growth and a few cancerous cells remain, or does not remove all cancerous cells at the margins, the tumor can grow back and spread or metastasize to other parts of the body.
Another major problem with endoscopes that utilize only white light is that malignant and premalignant tumors that are flat, or very small, may look similar to normal tissues. As a result a physician may not be able to identify some aggressive cancers. In order to be safe, physicians may have to collect random and repeat biopsies as the only possible way to ensure that cancer is not missed in high risk patients.
Blue Light
Because of the limitations with using white light for visualizing cancers, various companies have begun to explore usage of blue light in conjunction with imaging agents or chemical dyes. These recent advances and successes with blue light and chemical tumor targeting agents have improved the ability to visualize cancers and margins.
However, these chemical agents can cause various adverse effects including anaphylaxis shock and hypersensitivity reactions with repeated usage at the high doses currently required for visualization. It is for this reason that the FDA has limited use to just once for any patient.
Doctors and surgeons cannot repetitively examine a patient with these chemical imaging agents. This is as critical problem for patients with multiple tumors and those with recurrent tumors.
Red Light
Red light requires specialized laser light sources, ultrasensitive cameras and a unique optical design. Currently no commercial instruments are available using red light.
The Unmet Need
What is acutely needed in this particular imaging space is an ultrasensitive endoscope system that uses white light while simultaneously using other wavelengths of light to visualize all tumors, and one that requires only a fraction of the chemical imaging agent so as to reduce the toxicity allowing multiple usage in patents.
Future endoscopes should also have more advanced cancer detection technologies so that ultimately no chemical imaging agents would be necessary, and these future tools should provide ultrasensitive and advanced imaging capabilities.
BSS Life Sciences
BSS Life Sciences is a biotechnology company founded to commercialize an ultrasensitive, next generation imaging technology for extremely accurate visualization of cancers.
BSS’s next generation imaging technology was invented and developed by Dr. Stavros Demos. Dr. Demos worked with UC Davis Cancer Center physicians and the U.C. Davis NSF Center for Biophotonics Science and Technology for more than eight years creating this technology and demonstrating its proof of principle.
The resulting instrument provides physicians a tool to complement white light endoscopy by adding fluorescence imaging for more accurate and complete detection and treatment of cancer and various other conditions.
BSS company inventors have designed, created and tested two different systems that utilize simultaneous recording and display of images using white light and either blue light or red light. One system (blue light) uses targeted imaging dyes that require only a fraction of the current chemical contrast agents and the other system (red light), uses no contrast agents directly visualizing the intrinsic fluorescing tissue biomolecules.
BSS’s technology is based on ultrasensitive detection and imaging instrumentation that can be seamlessly adapted to any type of endoscopic or other type of imaging device commercially available.
 The two working prototype systems that have been created provide simultaneous white light and red light, or white light and blue light for detection of tissue structures of interest that can be visually isolated from the surrounding tissue. These systems acquire and display simultaneously conventional white light images and images that arise from either blue light or red light, which alleviates the problem of having to switch back and forth between different light sources for the physician or surgeon to view the tumors.
The company’s first two commercial applications of this technology are advanced endoscope systems for the ultrasensitive detection and effective removal of bladder cancers.
Preliminary testing was performed in vivo in 21 patients undergoing transurethral resection of bladder tumors at the UC Davis Medical Center, a well-respected cancer facility, with excellent results.
BSS Life Sciences has entered into a partnership with the UC Davis Cancer center, to continue testing commercial prototypes for FDA application on human patients.
In addition to clinical testing at UC Davis, BSS Life Sciences has arranged additional testing by certified staff at the University of California, San Francisco, Helen Diller Family Comprehensive Cancer Center and the UCLA Jonsson Comprehensive Cancer Center.
Competitive Advantages
Although there are many companies that manufacture endoscopy devices, no company to date has developed an ultrasensitive blue light endoscopy system that will use less than 1 percent of the toxic chemical currently (such as Cysview) used per test.
In addition BSS Life Sciences has developed an ultrasensitive red light endoscopy system that requires no chemical imaging agents. It is expected that this system can also be used in two medical settings for both diagnosis and tumor removal (resection). Because there is no need for chemical imaging agents, this system can be used in a physician’s office or clinic for cystoscopy (diagnosis), and in the operating room (O.R.) or ambulatory surgical center for tumor removal or resection.
BSS has been issued patents covering these imaging systems that are estimated to be at least 1000 times more sensitive in tumor detection than any other devices currently in the marketplace. BSS’s devices will provide improved detection of non-muscle invasive bladder cancer superior to what is currently in the market place.
These devices will lead the marketplace in illumination of cancerous cells and provide an improved surgical outcome as a result of an improved detection and resection, which will lead to more adequate patient management and follow-up.
A key feature of BSS’s technology is based on improving the imaging aspect of endoscopy and it’s a technology that can be adapted to any kind of existing endoscope. The instrumentation involved does not come into contact with the patient, thus significantly reducing regulatory requirements and associated expenditures. Furthermore, the interface of the imaging instrumentation with the endoscope is via a flexible and lightweight adaptor that is very easy for the operator to handle. Also, the white light and fluorescence images are recorded and displayed simultaneously providing an effective real time navigation tool that can be farther enhanced using processing (such as overlapping and pseudo-coloring) of the two principal images.
Market
The global endoscopy equipment market was estimated at $28.2 billion in 2013 and is expected to reach $37.9 billion by 2018, growing at a Compounded Average Growth Rate (CAGR) of 6.1% from 2013 to 2018. The other factors that are driving the growth of the global endoscopy equipment market include favorable reimbursement in select regions, our aging population, and the increasing prevalence of diseases that require endoscopy procedures.
Letter of Intent
Expedition Mining Inc. TSX.V – EXU has signed a letter of intent (LOI) with BSS Life Sciences Inc. that would see Expedition acquire all of the outstanding securities of BSS in an all-share transaction to be completed by way of a share exchange agreement. Concurrent with the completion of the transaction, the LOI contemplates that Expedition complete a private placement of a minimum of $1-million.
Conclusion
Current endoscopy instruments have a well-documented problem associated with the limited ability to distinguish cancer from normal tissue.
BSS’s advanced ultrasensitive imaging technology is based upon improved optical designs and components, and advanced light sensors. The results are:
For all these reasons Expedition Mining, BSS Life Sciences, and their significantly improved endoscope technology, needs to be on your radar screen.
Is advanced endoscopy on your screen?
If not, it should be.
Comments Off on AOTH – BSS Life Sciences
New Carolin Gets Significantly De-Risked
June 29th, 2015
By Richard Mills.
New Carolin Gold Corp. TSX.V-LAD has acquired an additional 30% ownership in the Ladner gold project. Previously LAD had a 10% undivided interest in the property that holds the core asset plus 100% of the lower property that while on strike does not as yet have a proven asset. The ownership of the property has been problematic for New Carolin for almost 3 years since Century mining went into bankruptcy. The market has punished LAD for a lack of clarity on ownership and specifically for the lack of a direct path to 100% ownership.
The transfer of this additional 30% interest is very significant for LAD shareholders, not just for the significant upgrade in their percentage ownership of the assets on the property (roughly an inferred resource of 750,000 oz at 4.5 g/t gold plus 28,000 inferred oz minimum in the tailings)) but also because LAD now has a direct path to delivering on 100% ownership of the property.
LAD has an agreement in place with the receiver to acquire the 100% interest by raising $2 million towards developing the project. A key component of that agreement was the transfer of the 30% interest from Tamarlane to LAD as the receiver did not directly control that 30%. Now, with the monies raised to date, plus the $200,000 loan facilitating the 30% transfer, Lad is just over one million dollars short of the 2 mil required to transact the further 60%.
Once LAD can claim 100% ownership they will own the roughly 750,000 oz of inferred gold underground plus the 28,000 + oz in the tailings pond (drilled out on only 60% of the ponds surface). Based on the company raising the funds to complete the acquisition of the further 60 % interest they should have funds allocated for a 2015 drill program. The management of New Carolin believes that their next drill program will have very meaningful targets that could further enhance the current resource.
Will these new developments be enough to put them in play as an acquisition target or perhaps to be of sufficient interest to financiers willing to put the property back in production? We don’t know but both prospects certainly exist and make this a very compelling story going forward.
There’s also considerable discovery upside left on the property.
‘The Coquihalla serpentine belt is an elongate, north – northwest trending, steeply dipping ultramafic unit. The belt lies within a major crustal fracture, the Hozameen fault and exceeds 50 kilometers in discontinuous strike length. The serpentine belt reaches its maximum development in the Carolin mine-Coquihalla River area, where it is greater than two kilometers in width. It gradually narrows to the south (Manning Park area) and north (Boston Bar).’ Exploration in B.C. 1989, Ministry of Energy and Mines
 New Carolin’s Ladner Gold Property follows the Hozameen fault structure for approximately 28 km and exceeds 144 square kilometers covering substantially all of the accessible, yet still very underexplored, CGB.
The Ladner Gold Project contains several former underground producing gold mines and numerous gold prospects – more than 30 have been discovered so far. Approximately 11 gold showings have been found within a 2 km stretch north of the Carolin Mine.
A recently completed airborne geophysical survey indicated a major magnetic linear structure that can be traced for over 18 km within the company’s claims. All the aforementioned gold prospects occur along this major magnetic anomaly and there’s several kilometers of untested ground left along the structure to explore.
New Carolin is not only shaping up as a very low risk shot at a prospective near term producer but also as a company with excellent potential for further discovery. The hair is rapidly coming off of this project.
Let’s get Jim Mustard, mining analyst and vice president of investment, mining and banking at Vancouver-based PI Financial, to bring this into perspective for us.
“The majority of M&A activity is focused on gold and copper projects. Grade is king now. Anything that can be sold as shovel-ready, and that is in a jurisdiction with clear permitting protocols, that is not subject to being derailed, and that has low to modest capital expenditures, will be sold.”
Conclusion
When I first started investing in the junior resource space I was given some good advice by many people. One pearl of wisdom was this:
They do not come along very often but many times the best investment is a good project screwed up by poor management. The best return on your money comes from a change of management coming in, taking over a great but screwed up project.
This is exactly the opportunity I believe is being presented by New Carolin.
The former owners went broke in Quebec, the last management team that had the project were excellent promoters but horrible miners. LAD’s ‘modern’ management teams have, shall we say, lacked the necessary talents, imo, to successfully develop this project.
CEO and president Robert (Bob) Thast and the current BofD is cut from different cloth.
I’ve said it before, this is, rather was, a tired old play with a lot of hair on it, but that’s history.
Today is a new day. And for that reason, and a whole lot more good things to come, you need to have New Carolin Gold Corp. TSX.V-LAD on your radar screen.
Is New Carolin on your screen?
Comments Off on New Carolin Gets Significantly De-Risked
Ghosts In The Machine
April 15th, 2015By Richard Mills.
In 1798 32 year-old British economist Malthus anonymously published “An Essay on the Principle of Population” and in it he argued that human population’s increase geometrically (1, 2, 4, 16 etc.) while their food supply can only increase arithmetically (1, 2, 3, 4 etc.). Since food is obviously necessary for us to survive, unchecked population growth in any one area or involving the whole planet would lead to individual pockets of humanity starving or even mass worldwide starvation.
“The power of population is indefinitely greater than the power in the earth to produce subsistence for man.” Thomas Robert Malthus
Facts – Our topsoil is turning to dust and disappearing while at the same time we’re draining our fresh water aquifers faster than they can be recharged. Our atmosphere, the very air we breathe and earth’s armor against cosmic radiation is being poisoned and destroyed.
Viva the revolution
The second half of the 20th century saw the biggest increase in the world’s population in human history. Our population surged because of:
The global death rate has dropped almost continuously since the start of the industrial revolution – personal hygiene, improved methods of sanitation and the development of antibiotics have all played a major role.
The term Green Revolution refers to a series of research, development, and technology transfers that happened between the 1940s and the late 1970s. The initiatives involved:
Tractors with gasoline powered internal combustion engines (versus steam) became the norm in the 1920s after Henry Ford developed his Fordson in 1917 – the first mass produced tractor. This new technology was available only to relatively affluent farmers and it was not until the 1940s tractor use became widespread.
Electric motors and irrigation pumps made farming and ranching more efficient. Major innovations in animal husbandry – modern milking parlors, grain elevators, and confined animal feeding operations – were all made possible by electricity.
Advances in fertilizers, herbicides, insecticides, fungicides and antibiotics all led to better weed, insect and disease control.
There were major advances in plant and animal breeding – crop hybridization, artificial insemination of livestock, growth hormones and genetically modified organisms (GMOs).
Further down the food chain came innovations in food processing and distribution.
All these new technologies increased global agriculture production with the full effects starting to be felt in the 1960s.
Cereal production more than doubled in developing nations – yields of rice, maize, and wheat increased steadily. Between 1950 and 1984 world grain production increased by over 250% – and the world added a couple billion people more to the dinner table.
The modernization and industrialization of our global agricultural industry led to the single greatest explosion in food production in history. The agricultural reforms and resulting production increases fostered by the Green Revolution are responsible for avoiding widespread famine in developing countries and for feeding billions more people since. The Green Revolution also helped kick start the greatest explosion in human population in our history – it took only 40 years (starting in 1950) for the population to double from 2.5 billion to five billion people.
We goosed agra machine’s growth and at the same time, through better sanitation and the use of antibiotics, we saved a billion people who birthed a billion and more.
The Revolution is dead
Unfortunately the effects of the green revolution are fast wearing off and the true cost to our environment is only now becoming apparent.
The production advances of the Green Revolution were real. But by any yardstick the Green Revolution, while a true, almost global agricultural revolution, was not as green as many think – there was heavy collateral damage:
By 2050, the world’s population is expected to reach 9.6 billion people. Norman Borlaug, the Father of the Green Revolution, is on record stating he believed that 100% adoption of Green Revolution practices (and adaptation of well advanced research in the pipeline), could feed 10 billion people on a sustainable basis.
“Future food-production increases will have to come from higher yields. And though I have no doubt yields will keep going up, whether they can go up enough to feed the population monster is another matter. Unless progress with agricultural yields remains very strong, the next century will experience sheer human misery that, on a numerical scale, will exceed the worst of everything that has come before“. Norman Borlaug
Unfortunately the high yield growth is tapering off and in some cases declining. This is in large part because of an increase in the price of fertilizers, other chemicals and fossil fuels, but also because the overuse of chemicals has exhausted the soil and irrigation has depleted water aquifers.
Dr. M.S. Swaminathan, to rice what Borlaug was to wheat, said: “Stagnation in productivity is due to depleting natural resources base such as a steep fall in ground water table, impaired water quality, increasing input cost – particularly diesel, deficiency of micro-nutrients in the soil, deteriorating soil health, and high indebtedness of farmers.”
Consider also…
Narrowly focusing on increasing production as the Green Revolution did cannot alleviate hunger because it failed to alter three simple facts – an increase in food production does not necessarily result in less hunger – if the poor don’t have the money to buy food increased production is not going to help them.
Secondly, a narrow focus on production ultimately defeats itself as it destroys the base on which agriculture depends – topsoil and water.
And thirdly to end hunger once and for all, we must make food production sustainable and develop secure distribution networks of needed foodstuffs.
Price spike in the cost of survival
There are currently 7.3 billion of us sharing the planet. Here’s today’s conditions for the world’s poorest…
Because our agriculture system is concentrated on producing a very few staple crops there is a very serious lack of crop and production location diversity. Corn, wheat, rice and soy are the main staples and production is oftentimes half a world away from where the majority of the crop would be consumed. The world’s extreme poor exist almost exclusively on what is a ‘buy today, eat today’ plant based diet – wheat, corn, soy or rice provide the bulk of their calories.
Almost half of the planets population lives on less than $2.50 a day – roughly 1.4 billion people live on less than $1.25 per day. On average developing countries citizens spend a much larger percentage of their wages on food than do their counterparts in developed nations. Some published estimates are as high as 50 to 60 percent of income going towards food.
When food prices soar these people lack the money to feed themselves and their children – when your living on a couple of dollars a day, or less, and most of your income already goes to feed your family there’s no money to cover a price spike in the cost of survival.
Almost 1 billion people already go to bed hungry each night and somewhere in the world someone starves to death every 4 seconds – most on this tragic roll call are children under the age of five.
Malthusian pessimism
Malthusian pessimism has long been criticized by doubters believing technological advancements in:
would keep crop production ahead of the population growth curve. The way we treat our most precious natural resources, the earth’s topsoil, water and air has convinced me to give that conclusion a huge doubt.
Humans are currently withdrawing more natural resources then our Earth bank is able to provide on a sustainable basis. How much more? At today’s rate of withdrawal we need another half earth.
The headline projection of the latest UN study says the world’s population is likely to grow by another 2.3 billion, to 9.6 billion people in 2050 – that’s 68.5 million people expected to be born every year between 2015 and 2050.
By 2030, food demand is predicted to increase by 50% and 70% by 2050.
Consider:
Conclusion
In his Nobel lecture of 1970, Borlaug stated: “Most people still fail to comprehend the magnitude and menace of the population monster. The rhythm of increase will accelerate…unless Man becomes more realistic and preoccupied about his impending doom.”
The ghosts of Thomas Robert Malthus and Norman Borlaug haunt our broken agra machine and an almost indecipherable whisper can be heard…we warned them.
Food, water and air. Since they are kinda important to our well being shouldn’t all three be on our radar screens? It’s obvious they are on mine, are they on yours?
If not, maybe they should be.
Comments Off on Ghosts In The Machine
Historical drought: No creek to be up
March 24th, 2015
By Richard (Rick) Mills.
As a general rule, the most successful man in life is the man who has the best information
Drought is a normal recurring feature of the climate in most parts of the world. It doesn’t get the attention of a tornado, hurricane or flood. It’s slower and less obvious, a much quieter disaster creeping up on us unawares.
Climate change is currently warming many regions, warmer temperatures increase the frequency and intensity of heat waves and droughts.
We can prepare for some climate change consequences with public education, water conservation programs, limiting pumping from our freshwater aquifers to recharge rates and putting in place early warning systems for extreme heat events.
Unfortunately some things cannot be prepared for…like the pervasiveness and persistence of decade’s long drought caused by climate change.
The collapse of the world’s earliest known empire was because of drought.
Akkad
The Akkadians of Mesopotamia forged the world’s first empire more than 4,300 years ago. The Akkad’s seized control of cities along the Euphrates River and swept up onto the plains to the north – in a short period of time their empire stretched 800 miles, all the way from the Persian Gulf to the headwaters of the Euphrates, through what is now Iraq, Syria and parts of southern Turkey.
Tell Leilan was a small village founded by some of the world’s first farmers. It’s located in present day Syria and has existed for over 8,000 years. The Akkad’s conquered Tell Leilan around 2300 B.C. and the area became the breadbasket for the Akkadian empire.
After only a hundred years the Akkadian empire started to collapse.
In 1978, Harvey Weiss, a Yale archaeologist, began excavating the city of Tell Leilan. Everywhere Weiss dug he encountered a layer of dirt that contained no signs of human habitation. This dirt layer corresponded to the years 2200 to 1900 B.C. – the time of Akkad’s fall.
The Curse of Akkad
For the first time since cities were built and founded,
The great agricultural tracts produced no grain,
The inundated tracts produced no fish,
The irrigated orchards produced neither wine nor syrup,
The gathered clouds did not rain, the masgurum did not grow.
At that time, one shekel’s worth of oil was only one-half quart,
One shekel’s worth of grain was only one-half quart. . . .
These sold at such prices in the markets of all the cities!
He who slept on the roof, died on the roof,
He who slept in the house, had no burial,
People were flailing at themselves from hunger.
The events described in “The Curse of Akkad” were always thought to be fictional. But the evidence Weiss uncovered at Tell Leilan (along with elevated dust deposits in sea-cores collected off Oman) suggest that localized climate change – in Tell Leilan’s case a three hundred year drought – desertification – was the major cause.
“Since this is probably the first abrupt climate change in recorded history that caused major social upheaval. It raises some interesting questions about how volatile climate conditions can be and how well civilizations can adapt to abrupt crop failures.” Dr. Harvey Weiss, Yale University archeologist
Ghost Empire
Perhaps the most notable empire decline due to drought, or altered precipitation patterns, was the Maya empire. At the peak of their glory the Maya ranged from Mexico’s Yucatán peninsula to Honduras. Some 60 Maya cities – each home to upwards of 70,000 people – sprang up across much of modern day Guatemala, Belize, and Mexico’s Yucatán Peninsula.
“The early Classic Maya period was unusually wet, wetter than the previous thousand years…Mayan systems were founded on those [high] rainfall patterns. They could not support themselves when patterns changed.” Douglas Kennett, an environmental anthropologist at Pennsylvania State University.
During the wettest centuries, from 440 to 660, Maya civilization flourished.
Then things got worse, much worse. The following centuries, from the mid 600’s to roughly 1000 A.D., did not treat the Mayas kindly, they suffered repeatedly from drought, oftentimes extreme drought lasting a decade and more.
Between 1020 and 1100 the region suffered the longest dry spell in many millennia. The Maya’s suffered crop failure after failure, famine, death and eventually mass migration.
“Yucatecan lake sediment cores … provide unambiguous evidence for a severe 200-year drought from AD 800 to 1000 … the most severe in the last 7,000 years … precisely at the time of the Maya Collapse.”Richardson Gill, The Great Maya Droughts
After 200 years of drought, really just an eye-blink of time, famine and drought held sway and people walked away leaving behind a ghost empire.
American Drough
“Once upon a time, much of the state of California was a barren desert. And now, thanks to the worst drought in modern American history, much of the state is turning back into one. Scientists tell us that the 20th century was the wettest century that the state of California had seen in 1000 years. But now weather patterns are reverting back to historical norms, and California is rapidly running out of water. It is being reported that the state only has approximately a one year supply of water left in the reservoirs, and when the water is all gone there are no contingency plans.” Michael Synder, The Economic Collapse

 California saw an estimated $2.2 billion in agricultural losses and the elimination of 17,000 farming jobs in 2014. California is responsible for nearly half of all fruits, vegetables and nuts produced in the U.S.
In 2014, California had its warmest year on record, and it just had its warmest winter on record – high in the Sierra Nevada’s California’s snowpack is at a 25 year low.
A Stanford University report says that nearly 60 percent of the state’s water needs are now met by groundwater. That’s up from 40 percent in years when normal amounts of rain and snow fall.
In many areas wells that use to draw water from 500 feet are now being drilled to 1,000 feet and more, costing upwards of $300,000 for one well.
“California’s Central Valley isn’t the only place in the U.S. where groundwater supplies are declining. Aquifers in the Colorado River Basin and the southern Great Plains also suffer severe depletion. Studies show that about half the groundwater depletion nationwide is from irrigation. Agriculture is the leading use of water in the U.S. and around the world, and globally irrigated farming takes more than 60 percent of the available freshwater.

Lake Mead ‘Bathtub Rings’ Show Lake Level Decline
 The Colorado River Basin, which supplies water to 40 million people in seven states, is losing water at dramatic rates, and most of the losses are groundwater. A new satellite study from the University of California, Irvine and NASA indicates that the Colorado River Basin lost 65 cubic kilometers (15.6 cubic miles) of water from 2004 to 2013. That is twice the amount stored in Lake Mead, the largest reservoir in the U.S., which can hold two years’ worth of Colorado River runoff. As Jay Famiglietti, a NASA scientist and study co-author wrote here, groundwater made up 75 percent of the water lost in the basin.
Farther east, the Ogallala Aquifer under the High Plains is also shrinking because of too much demand. When the Dust Bowl overtook the Great Plains in the 1930s, the Ogallala had been discovered only recently, and for the most part it wasn’t tapped then to help ease the drought. But large-scale center-pivot irrigation transformed crop production on the plains after World War II, allowing water-thirsty crops like corn and alfalfa for feeding livestock.
But severe drought threatens the southern plains again, and water is being unsustainably drawn from the southern Ogallala Aquifer. The northern Ogallala, found near the surface in Nebraska, is replenished by surface runoff from rivers originating in the Rockies. But farther south in Texas and New Mexico, water lies hundreds of feet below the surface, and does not recharge. Sandra Postel wrote here last month that the Ogallala Aquifer water level in the Texas Panhandle has dropped by up to 15 feet in the past decade, with more than three-quarters of that loss having come during the drought of the past five years. A recent Kansas State University study said that if farmers in Kansas keep irrigating at present rates, 69 percent of the Ogallala Aquifer will be gone in 50 years.
This coincides with a nationwide trend of groundwater declines. A 2013 study of 40 aquifers across the United States by the U.S. Geological Survey reports that the rate of groundwater depletion has increased dramatically since 2000, with almost 25 cubic kilometers (six cubic miles) of water per year being pumped from the ground. This compares to about 9.2 cubic kilometers (1.48 cubic miles) average withdrawal per year from 1900 to 2008.” Dennis Dimick,‘If You Think the Water Crisis Can’t Get Worse, Wait Until the Aquifers Are Drained,’ National Geographic
Drought Forecast to continue
“Drought pressures will increase in California and western areas of the United States this spring even as the dry season begins, the government’s Climate Prediction Center said Thursday.
“Periods of record warmth in the West and not enough precipitation during the rainy season cut short drought relief in California this winter, and prospects for above-average temperatures this spring may make the situation worse,” Jon Gottschalck, chief of the Operational Prediction Branch at the Climate Prediction Center, said in issuing its spring outlook…
The western United States is expected to see the multi-year drought continue and intensify in 2015 and extend into the northern Plains, the outlook said. Drought is forecast to persist in California, Nevada and Oregon through June, with the onset of the dry season in April.
“I see nothing that would indicate much improvement, if any improvement, in the overall situation for field crops for 2015,” said Brad Rippey, meteorologist with the U.S. Department of Agriculture, noting he expected to see a significant drop in field crops again this year in California.
“Drought is also forecast to develop in remaining areas of Oregon and western Washington. Drought is also likely to continue in parts of the southern Plains,” NOAA said.
Drought also is likely in the northern Plains, upper Mississippi Valley and western Great Lakes… Above-average temperatures are favored this spring across the Far West, northern Rockies, and northern Plains eastward to include parts of the western Great Lakes, and for all of Alaska.” Reuters, Climate Center Sees Drought Getting Worse in Western US, Voice of America
Canadian Water Diversion
Canada has a lot of fresh water – 35,500,000 Canadians own seven percent of the world’s renewable supply. We’ve been blessed with an abundance of the world’s most important resource. It’s a resource we’re going to eventually have to share with our southern neighbor.
There have been numerous proposals about transferring large amounts of freshwater from Canada to the United States. Following are breakdowns on three of the most ambitious plans conceived to date.
The Great Recycling and Northern Development (GRAND) Canal of North America (GCNA) was designed by Newfoundland engineer Thomas Kierans to alleviate North America’s freshwater shortage problems.
The GNAC would collect fresh water run-off into James Bay by means of a series of outflow-only, sea level dikes-constructed across the northern end of James Bay. These dikes would capture the fresh water before it mixes with the salty water of Hudson Bay and create a new source of fresh waterequivalent to 2.5 times the flow over Niagara Falls.
Canals would be built to transfer the water from James Bay into the Great Lakes and from the Great Lakes canals and pipelines move the water to areas in the U.S.
The North American Water and Power Alliance (NAWPA) was designed to bring water from Alaska and northern British Columbia to the U.S. By building a series of large dams, the northward flow of the Yukon, Peace, Liard, Tanana, Copper, Skeena, Bella Coola, Dean, Chilcotin, and Fraser rivers would be reversed to move southward into the Rocky Mountain Trench where the water would be trapped in a giant reservoir approximately 800 kilometers long.
A canal would then be built to take the water southward into Washington state where it would be channeled through existing canals and pipelines. The annual volume of water to be diverted through the NAWAPA project is estimated to be roughly equivalent to the average total yearly discharge of the entire St. Lawrence River system in Canada. The amount of water available is estimated to be enough that some would be available for use by Mexico via the Colorado River.
The Central North American Water Project (CeNAWAP) consists of a series of canals and pumping stations linking Great Bear Lake and Great Slave Lake in the NWT to Lake Athabaska and lake Winnipeg and then the Great Lakes.
A variation on the CeNAWAP is the Kuiper Diversion Scheme which links the major western rivers, the Mackenzie, the Peace, the Athabasca, North Saskatchewan, Nelson and Churchill rivers, into a mega water diversion scheme.
Obviously between the three projects hundreds of billions of gallons of fresh water could be supplied to the parched areas of the United States, Canada, and Mexico. New areas of cultivation would be opened up, thousands of jobs would be created and new dams would supply unimaginable amounts of electricity.
Non-Starters
Although the principal’s of these three water diversion projects are the same – water for parched areas of the U.S. and potentially Mexico (this author will remain skeptical of water ever reaching Mexico until it actually happens) politically and environmentally two of the proposals, NAWPA & CeNAWAP, would be non-starters in Canada.
“With the NAWPA diversionary plan, no new fresh water will be added to the system. NAWPA proposes to dam mostly Canadian rivers to create massive new reservoirs and then divert the water to drought afflicted regions, mostly in the American Southwest. Only existing sources of fresh water will be collected and redirected. By necessity and by plan, NAWPA will deprive some areas (mostly in Canada) that now have water, and flood other areas for reservoirs (also mostly in Canada) where at the present time no water flows. The ultimate recipients of the NAWPA water will for the most part be in the American Southwest. Aside from being tremendously expensive to build and operate, NAWPA will have massive and yet to be determined environmental impacts. Abundant animal and vegetable life will be damaged and destroyed. Populations of human and other species will have to be relocated.
The GRAND Canal proposes no such flooding or diversion. The new water will collected in existing reservoirs (James Bay and the Great Lakes) and flow along existing or new man-made and environmentally friendly waterways to existing reservoirs or aquifers. Nature will be respected and environmental impacts will be kept to a minimum.” Thomas Kierans, Wikipedia
Conclusion
Mark Twain said “Whisky is for drinking; water is for fighting over.”
Water is a commodity whose scarcity will have a profound effect on the world within the next few decades – this makes the reevaluation of our values regarding fresh water use not voluntary but mandatory. We Canadians are going to have to drastically change the way in which we view our freshwater as a resource.
The issue of Canada diverting part of its fresh water resources to the US has never been on, or has long since faded off most Canadians radar screens. If widespread U.S. drought conditions persist that’s going to change.
Is water on your radar screen?
If not, it should be.
Comments Off on Historical drought: No creek to be up
China’s copper con
March 7th, 2015
By Richard Mills
If you needed upwards of 50ml tonnes of copper over the next 5 years, and had very little production of your own, what would you do?
I’m thinking you’d manipulate the market like crazy trying to get everyone to believe there’s a huge surplus instead of a major deficit.
How would you do it? Well, we can look at the last time the Chinese manipulated the copper market – they invited every analyst they could find and invited them to China. Showed them all a few warehouses stacked with copper to the roof. Why there was so much copper the ground was compacting said one guy, another said the stacks were falling over like dominos. The world bought the surplus story, swallowed it hook line and sinker. Headlines screamed ‘China Has Enough Copper!’
Of course it wasn’t true, China needed copper, what they had (2ml tonnes), was tied up in financing deals and at any one time there’s at least one million tonnes in transport or somewhere in the process that’s tied up, already spoken for, and not available.
And the world gets conned, every year ‘experts’ predict a surplus, instead what happens? Deficit after supply deficit.
Let’s expose the con job.
Copper Consumption
China is going to grow at over 7% this year, that’s compounded on top of the 7.3% it grew in 2014 and the year before etc. China is also spending huge amounts of money on infrastructure, especially their power grid.
India, to become competitive, needs to modernize its power grid, so too does Indonesia, they have to build all those smelters for in-country benefaction of ore.
Africa has – by 2050 every 4th person in the world is going to be an African – eight countries on that continent that have better growth rates than China and India.
Per capita consumption of copper in the United States was 10 kilograms per person in 1965, the same as in 1995. In Japan, per capita consumption increased from 6 kilograms per person to 11 kilograms per person over the same time period. Copper consumption in Korea in 1965 was less than 1000 tons. By 1995, Korea’s consumption of copper had reached 637,000 tons, or more than 14 kilograms per person.
In China, even after years of economic growth, per capita copper usage is about 5.4 kg. As China’s populace urbanizes, builds up its infrastructure and becomes more of a consuming society, there’s no reason to suspect Chinese copper consumption won’t approach or even surpass U.S., Japanese and South Korean levels. There’s 1.3 billion people in China, even a slight increase in Chinese consumption will translate into enormous demand growth.
India, with its 1.2 billion people, is presently using 0.4 kg of copper per person. The country is modernizing and needs to invest heavily in electrical power infrastructure. According to the International Energy Agency (IEA), India’s power production will need to rise by up to 20 percent annually to keep pace with its economic and population growth. Just meeting the required power target would double India’s annual copper consumption.
India’s new government, led by Narendra Modi, is focusing on Asian partners China and Japan for enhancing investments in infrastructure and manufacturing. The growth model pursued by China and Japan – export oriented manufacturing, heavy infrastructure building and urbanization – has become India’s blueprint for pushing growth up to and beyond the 7 percent mark.
Population Growth
At this moment there are slightly over 7 billion people living on this planet, an urbanization rate of 53 percent means there are roughly 3.71 billion urbanites in the world today. It has been estimated that by the year 2050 our global population will reach 10 billion people. If our global population does indeed reach 10 billion people, and if Birch and Wachter’s expected urbanization rate of 70 percent is achieved, seven billion people, or almost the equal of today’s current world population will be considered urban.
Could we hit the ten billion people mark? Could 70 percent of us be living in cities by 2050? The answer is likely yes. Developing countries are responsible for 90 per cent of current population growth – these are on average very young people with many years of fertility/reproduction left to them. By the year 2025, in just 10 short years, 84 per cent of the world’s people will live in developing regions.
According to the World Health Organization (WHO) “Almost all urban population growth in the next 30 years will occur in cities of developing countries. Between 1995 and 2005, the urban population of developing countries grew by an average of 1.2 million people per week, or around 165 000 people every day. By the middle of the 21st century, it is estimated that the urban population of these counties will more than double, increasing from 2.5 billion in 2009 to almost 5.2 billion in 2050.”
The developing world’s urban centers are expected to burgeon, drawing 96 percent of the additional 1.4 billion people by 2030. Due to the overall growing global population – but especially an exploding urban population (urban populations consume much more food, energy, and durable goods than rural populations) – demand for water, food, housing, heat, energy, clothing, and consumer goods is going to increase at an astounding rate.
According to the International Monetary Fund (IMF) the consumption of metals typically grows together with income until real GDP per capita reaches about $15,000–$20,000 per capita (2005 int$) as countries go through a period of industrialization and infrastructure construction.
A few country’s stand out as well below the IMF’s $15,000.00:
Since they are still a considerable distance from the point where further increases in GDP per capita no longer increase copper consumption per person, China, Indonesia, the Philippines, India and Pakistan (and the other 113 out of 180 countries listed below the IMF’s 15,000 Int$ cutoff) are likely to continue to add significantly to global demand for copper for some time to come.

Tomorrow’s Copper Demand
According to the Minerals Education Coalition every American born will need 978 pounds of copper over their lifetime.

We can see in the above Wood MacKenzie, Macquarie Research graph, from an August 2013 report, a projected refined shortage in 2018. The surplus forecast between now and then is diminutive in relation to the sheer size of the copper market and copper production often falls short of forecasts due to accidents, strikes, ore degradation or power shortages. Disruptions in the copper market averaged 900,000 tonnes of copper supply per year between 2004 and 2012.
We already have one billion people out of today’s current population slated to become significant consumers by 2025.
Another 2.8 billion people will be added to the world between now and 2050. Most will not be Americans but they are going to want a lot of things that we in the western developed world take for granted – electricity, plumbing, appliances, AC etc.
“Infinite growth of material consumption in a finite world is an impossibility.” E. F. Schumacher
“We’re living in a finite world, one in which resource constraints are becoming increasingly binding.” Paul Krugman, ‘The Finite World’
Copper Parity
But what if all these new one billion consumers were to start consuming, over the next 10 years, just like an American? What’s going to happen to the world’s mineral resources if one billion more ‘Americans’ are added to the consuming class? Here’s what each of them would need to consume, per year, to live the American lifestyle…
In 2010, more than 38,000 pounds (19 tons) of minerals and fuels were needed per person to maintain the American lifestyle.

Out of the 38,000 total pounds needed, 21,675 pounds were energy fuels – the coal, petroleum, natural gas, uranium – required for transportation and to heat, cool and light homes and businesses.

One billion new consumers by 2025. Can everyone who wants to, live an American lifestyle? Can everyone everywhere else have everything we in North America have? The answer is a resounding no!
If we mined every last discovered, and undiscovered, pound of land based copper the expected 8.2 billion people in the developing world would only get three quarters of the way towards copper use parity per capita with the U.S.
Of course the rest of us, the other 1.8 billion people expected to be on this planet by 2050, aren’t going to be easing up, we’re still going to be using copper at prestigious rates while our eastern cousins play catch up.
Copper use parity isn’t going to happen, it can’t.
“The data also show that nations such as South Africa and China will need to increase their average urban per-capita copper stock-in-use by seven or eight times to achieve the same level of services as the developed countries if they use existing technology.
Is there enough copper to meet this potential requirement?
Concern about the extent of mineral resources arises when the stock of metal needed to provide the services enjoyed by the highly developed nations is compared with that needed to provide comparable services with existing technology to a large part of the world’s population. Our stock data demonstrate that current technologies would require the entire copper and zinc ore resource in the lithosphere and perhaps that of platinum as well.Even a lower level of services could not be sustainedworldwidebecause a continuing supply of new metal is needed to make up for inevitable losses in the recycling of the metal stock-in-use.
Substitution has the potential to ameliorate this situation, but one should not automatically assume that technology will produce a satisfactory substitute for every service at an affordable price and precisely when needed.
…anthropogenic and lithospheric stocks of at least some metals are becoming equivalent in magnitude, that world-wide demand continues to increase, and that the virgin stocks of several metals appear inadequate to sustain the modern ‘‘developed world’’ quality of life for all Earth’s peoples under contemporary technology…Do we really envision a developed world quality of life for all of the people of the planet…?” R. B. Gordon, M. Bertram, and T. E. Graedel, Metal Stocks and Sustainability
Despite what mainstream, swimming in the shallow end analysts say, copper is already in a very real, structural supply deficit. Most just don’t know it.
Lets state the obvious:
But
*Energy can be thought of as a proxy for labor, materials, energy and externalities – environmental, community impact etc.
Each year, the U.S. Geological Survey (USGS) estimates the amounts of reserves: the quantities of mineral that can be economically extracted or produced at the time of determination.
World copper reserves are currently placed at around 630 Mt. When considered as just a single consolidated global number copper reserves seem large and adequate for several decades of production at 2012 levels.
Unfortunately most people do not take into consideration that these reserves are made up of many separate deposits, each of which has to be considered as a standalone and on its own merits.
The economic viability of the world’s copper deposits are influenced by many factors that inevitably reduce the amount of copper that reaches production.
These factors are:
Each of these deposits is also subject to geologic, engineering, environmental and political constraints that are always changing.
Many mines do not come online on time and the disruption rate, the amount of promised copper that fails to materialize is now as high as 8 percent – operating mines can suffer production stoppages/slowdowns or move into lower grade ore.
A long term structural trend became evident in the industry in 2012 – shortfalls in targeted production were characterized by a fall in grades and recoveries rather than unexpected disruptions.
Consider
Chile produces a third of the world’s copper and has seen a seven fold increase in energy costs over the last ten years. CRU estimates Chile’s copper production costs have risen 60 percent over the last seven years compared to a world average of 30 percent.
Chile is the world’s top copper producer but the country as a whole is woefully short of power. The country’s power generation capacity currently stands at 17,000 megawatts. It is estimated that the country will need at least 30,000 megawatts of power by 2020 to keep up with the demand, the increased demand coming primarily from mining projects. Unfortunately the government only plans to add 8,000 megawatts between now and 2020 and there is serious opposition to these plans from environmental groups who have, so far, been wildly successful by suspending several key projects and more than $22 billion worth of power investment.
Also because of a severe water shortage in the high desert, where most of the country’s major copper mines are located, water must be pumped from the ocean to almost 800 meters above sea level and then pumped hundreds of kilometers to the mines, of course the seawater must also be desalinated.
Chile’s copper production is in trouble, its ancient power grid is breaking down, electricity supply to the north, already inadequate, is threatened. No new mines, water is severely restricted and desalinization of seawater is required.
Over the past seven years, forecasts for world mine copper production have consistently exceeded actual production figures. An important take away from the graph below would be the decline in production from existing mines and how “Probable Projects” barely keep pace with expected consumption.

The chart below provides a graphic view of the decline in world average copper grades since 1985, plus the declining grade forecasts based on new mines under construction.

Source Brook Hunt
The metal content of copper ore has been falling since the mid 1990s. A miner now has to dig up an extra 50 percent of ore to get the same amount of copper. As grade drops the amount of rock that must be moved and processed per tonne of produced copper rises dramatically – all the while using more energy that costs several times more than it use to. With the lower grades of ores now being mined energy becomes more and more of a factor when considering economics.
1m metric tonnes of new copper supply is required to be produced each year to keep up with copper demand. The following chart graphically illustrates how current projections for future copper production may be optimistic.

Source A. Gonzales
Copper prices need to be significantly above marginal cost, in other words, prices need to stay high enough to provide miners with an adequate return on their investment for building today’s much more expensive and riskier new mines. There is also a significant additional cost in keeping production constant year over year.
If copper does not stay well above miners marginal costs the much needed new mines will not be build.
Barclays said in February that the real expense of producing copper may be as much as 87 percent higher than back in 2007 due to higher labor and energy costs.
Rio Tinto says growth will continue to be a challenge for several reasons:
Resource Nationalism & Political Risk
Resource extraction companies, because the number of discoveries was falling and existing deposits were being quickly depleted, have had to diversify away from the traditional geo-politically safe producing countries.
Resource nationalism is the tendency of people and governments to assert control, for strategic and economic reasons, over natural resources located on their territory.
Two Examples:
Indonesia’s President Yudhoyono prohibited ore exports from Southeast Asia’s largest economy. He’s betting that investment and higher prices would more than offset job cuts and lost revenue from unprocessed ore shipments.
Zambia is Africa’s largest copper producer (and wants to directly market its copper), in second place is the DRC. The copper-belt which straddles Zambia’s and the Democratic Republic of the Congo’s borders is being tied up for internal development by the two countries.
Conclusion
The world’s exploding population, the massive shift from rural to urban, the growth of a very consumption minded middle class in developing countries, it’s all happening now.
Add in finite, increasingly hard to source resources.
The effects will be felt long before we actually start to run out of copper and there will be severe consequences:
Perhaps the two biggest reasons to get bullish on copper are one, the massive costs and risks involved in finding and opening new mines in often geo-political risky countries where a miners social license to operate is shaky at best.
And reason two would be regarding what’s going on today regarding a loss of funding for junior exploration. Exploration funding for juniors being down plus 60% over the last two years does mean something no reserve replacement for miners. Those juniors able to survive and advance their projects to the point where a major becomes interested are going to fare very well.
Is the coming consequence of living in a resource finite world (and not believing anything shallow swimming analysts say about copper surpluses), on your radar screen?
If it isn’t, maybe it should be?
Comments Off on China’s copper con
Building A U.S. Based Uranium Powerhouse
February 3rd, 2015
By Richard Mills.
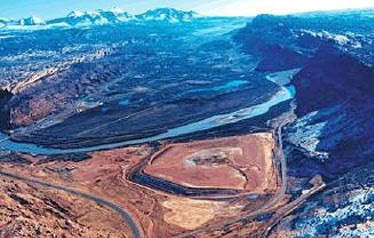
Global Uranium
The International Energy Agency (IEA) annual World Energy Outlook (WEO) 2014 report projects global energy trends through to 2040.
Some interesting predictions:
The WEO 2014 report also states there were 437 operating nuclear reactors with total installed capacity of 377,728 MWe (fuel consumption per GWe is 192 tonnes U3O8 ) accounting for 11% of global electricity generation.
According to the IEA nuclear’s share of electricity generation increases to 12% with total capacity increasing 60% to 624 GWe by 2040 this despite 200 reactors are expected to be retired by that time.
The largest increases in nuclear energy generation are expected in China, India, South Korea, and Russia. The number of countries operating reactors is expected to increase from 31 in 2013 to 36 in 2040.
 World Nuclear Power Reactors & Uranium Requirements WNA
“Industry experts project that, given the number of new reactors planned and the world-wide growing demand for electricity, the demand for uranium will grow significantly over the next decade…
The World Nuclear Association predicts that by 2020, mined production will account for 90% of global uranium supply, compared to 75% today…
By 2020, China alone will consume the equivalent of one-third of today’s global uranium market. China and Russia have already begun aggressively buying up huge stakes in uranium mining operations around the world in order to stockpile uranium to meet their rising domestic demand.”Virginia Uranium Inc.

Cantor Fitzgerald

Cantor Fitzgerald
Pre-Fukushima, Japan’s nuclear reactors supplied up to 30% of the country’s electricity. Analyst reports predict as many as 19 Japanese reactors will have been restarted by the end of 2016 amounting to roughly 14.5M lbs. of annual U3O8 demand.
Based on the most recent statistics from the World Nuclear Association, there are a total of 253 reactors that are either under construction, or planned around the world. Prior to the Fukushima incident in February 2011, there were only 218 reactors under construction or planned.
Ux Consulting company LLC or UxCo, in its “Uranium Market Outlook – Q1 2014” estimated that by 2030 there will be 609 nuclear reactors in operation worldwide in 41 countries, supplying 588 gigawatts of electricity. UxCo also estimated that uranium demand will grow from 172.1 million pounds of U3O8 in 2013 to 265.0 million pounds in 2030.
U.S. Uranium
At the end of September 2014, U.S. uranium concentrate production totaled 3,805,798 pounds U3O8. This amount is just 3% higher than the 3,712,541 pounds produced during the first nine months of 2013.
The U.S.’s 99 operating reactors (5 under construction) consume approximately 50 million pounds of uranium each year. However, the U.S. produces less than 5 million pounds and imports over 90 percent of the uranium it uses.

U.S. Energy Information
The Megatons to Megawatts™ Program was a government/industry partnership in which bomb grade uranium from dismantled Russian nuclear warheads was recycled into low enriched uranium (LEU) used to produce fuel for American nuclear power plants. TheU.S./Russia Megatons to Megawatts Program ended in 2013.
According to the World Nuclear Association, January 2014:
Russia and the U.S. signed a new uranium supply contract (in 2011) to replace the soon to be ending Megatons to Megawatts™ Program. A significant part of U.S. reactor fuel will now come from Russia’s commercial enrichment activities, using U.S. supplied feedstock, rather than the down blending of Russian weapons material. This new agreement means US has to source additional new uranium, deliver it to Russia for Russia to enrich, and then buy the resulting LEU.
By 2015, supplies to the USA are expected to be half the level supplied under the priorMegatons to Megawatts Program (the option exists to supply up to the same level), the new program is expected to continue until 2022.
Russia is a major player in the secondary (reprocessing) uranium market. However, with banking sanctions in place (and more being proposed), Russia is being squeezed out of international money markets. On Monday, 26th of January 2015, ratings agency S&P cut Russia’s sovereign credit rating to BBB-, just a cut above junk bond status. Moody’s downgraded Russia the proceeding week with the warning that further hits to the Kremlin’s credit rating are on the way. Many are convinced the Russians are going to have an increasingly hard time making fuel deliveries.
“We believe that Russia’s financial system is weakening and therefore limiting the Central Bank of Russia’s (CBR’s) ability to transmit monetary policy. In our opinion, the CBR faces increasingly difficult monetary policy decisions while also trying to support sustainable GDP growth.” S&P analysts
Building a U.S. Based Uranium Powerhouse
Energy Fuels (NYSE MKT: UUUU) has recently announced a proposed acquisition of Uranerz (NYSE MKT: URZ). Under the terms of the all-stock transaction, URZ shareholders receive 0.255 shares of UUUU for ownership of 55% in the combined company, Energy Fuels shareholders will own the remaining 45%.
The transaction is expected to create the largest integrated U.S. focused uranium producer through the combination of in-situ recovery (ISR) in Wyoming’s Powder River Basin (PRB), conventional uranium operations/alternate feed processing operations in the Southwest U.S., and a significant development pipeline of projects located throughout Utah, Wyoming, Arizona and New Mexico.
URZ’s Dennis Higgs, Glenn Catchpole and Paul Saxton have been nominated to the BoD of a new Energy Fuels.
Combined 2015 uranium sales are projected to be ~1MM lbs at $58/lb. The merged company will have a total of six separate uranium supply contracts with terms extending to 2020.
Conclusion
The merger is expected to close in mid 2015 following regulatory and shareholder approvals for both companies.
I like this proposed merger for several reasons:
Is a U.S. based uranium powerhouse on your radar screen?
If not, it should be.
Comments Off on Building A U.S. Based Uranium Powerhouse
What’s your edge?
January 16th, 2015
By Richard Mills.
As a general rule, the most successful man in life is the man who has the best information
In early July 2014, Mark Bristow Randgold Resources CEO, said the gold mining industry was fundamentally broke at a gold price of US$1,300.00/oz.
“Gold has special properties that no other currency, with the possible exception of silver, can claim. For more than two millennia, gold has had virtually unquestioned acceptance as payment. It has never required the credit guarantee of a third party. No questions are raised when gold or direct claims to gold are offered in payment of an obligation; it was the only form of payment, for example, that exporters to Germany would accept as World War II was drawing to a close. Today, the acceptance of fiat money — currency not backed by an asset of intrinsic value — rests on the credit guarantee of sovereign nations endowed with effective taxing power, a guarantee that in crisis conditions has not always matched the universal acceptability of gold.
If the dollar or any other fiat currency were universally acceptable at all times, central banks would see no need to hold any gold. The fact that they do indicates that such currencies are not a universal substitute. Of the 30 advanced countries that report to the International Monetary Fund, only four hold no gold as part of their reserve balances.” Golden Rule, Alan Greenspan.
The number one rule of investing is ‘always buy an asset that is priced below its replacement value.’ The cheaper you can pick up quality assets, knowing the price HAS to rise, the better.
Let’s see if gold is priced below replacement value.
In 2012, the World Gold Council (WGC), and senior gold producers, come up with a new production cost reporting measure. The new industry standard is now ‘all-in sustaining costs’ or AISC.
AISC was widely adapted by the sector in 2013. AISC includes sustaining capital (as grades decline and mines get older sustaining capital costs rise) as well as general and administrative (G&A) expenses.
AISC does not include costs such as project capital, dividends, working capital, taxes, financing and interest charges on debt, costs related to business combinations, asset acquisitions and asset disposals and items needed to normalize earnings (ie. stock options, charges for discontinued operations).
Let’s take a quick look at Newmont Mining Corp., a company that is primarily a gold producer.
Newmont Mining’s full year AISC guidance for 2014 is US$1,020 to $1080/oz. With today’s gold price of US$1223.00/oz and using a median price of $1,050/oz Newmont seemingly has a nice margin of US$173.00/oz.
But…
With US$350 billion in interest payments and US$200 billion in dividends each of the 5,000,000 ozs of gold Newmont is suppose to produce in 2014 gets $110.00 added to its $1,050.00 cost equaling $1,160.00/oz dropping Newmont’s margin to just $63.00.
Newmont is very close to being in the red even before many hundreds of millions of dollars have to be paid in taxes. And remember those other charges – project capital, working capital, costs related to business combinations, asset acquisitions, asset disposals and items needed to normalize earnings that are NOT included.
By taking a knowledgeable look at AISC reporting it’s easy to believe the gold mining industry, taken as a whole, is not generating free cash flow below US$1,300.00/oz.
Measures Taken
Attempting to get costs under control is having a hugely negative effect on the entire industry
“As gold prices have decreased, miners have responded by cutting sustaining capex, research and development, and exploration costs. Let’s pay attention to how the industry is achieving these cost cuts, because it matters if they’re coming on the sustaining side.” Dave Milstead, How much does it really cost to mine an ounce of gold?, Globe & Mail
Gold miners have resorted to high grading – mining the higher grade ores while leaving behind the lower grade. Dundee reported miners under their coverage processed 8% higher grades in 1H14. This is unsustainable over the long term and means much higher gold prices in the future are needed to make a go of mining the lower grade.

As gold prices dropped miners have cut back on spending. Many mines are no longer profitable at today’s gold price and they are being put on care and maintenance. New projects are on hold or cancelled outright, exploration spending levels have fallen through the floor.
A junior resource companies place in the food chain is to acquire projects, make discoveries and hopefully advance them to the point where a miner takes it over. Discoveries won’t be made if juniors aren’t out in the bush looking at rocks.
According to the Engineering and Mining Journal (E&MJ) junior resource exploration budgets dropped 39% in 2013 and fell a further 29% in 2014.
“It seems inevitable that the mining industry’s response to 2013’s gold price crash will be detrimental to mine supply levels in future years.”Gold Survey 2014 Update, Thomson Reuters GFMS

According to Visual Capitalist the global average grade of producing mines is 1.18g/t. The world average grade of undeveloped deposits is 30% lower, coming in at .89g/t.

The WealthCycles
Asian Gold Buying
In 2013, China was officially crowned the world’s largest gold market accounting for around a third of global gold demand. Consumer demand soared 32 percent to 1,066 tonnes (up 160% from five years ago) of gold in the form of bars, coins and jewelry topping India’s 2010 record of 1,007 tonnes.
Gold production in China, over the last decade, has more than doubled as the country produced 6,827,000 ounces of gold in 2004. In 2014, gold production estimates are expected to be around 14.5 million ounces. The Chinese keep all of the gold they mine and the export of gold bullion is banned.
The following graph shows where Switzerland’s (Switzerland is a global hub for gold refining, with more than two-thirds of global gold transiting through the country) gold comes from and where it goes.

Kingworldnews.com
A great percentage of the West’s gold has hemorrhaged East and continues to do so. The top five countries getting mostly U.S & UK gold out of Switzerland are Hong Kong, China, India, Singapore and Saudi-Arabia. Asia accounted for 63 percent of total consumption of gold jewelry, bars and coins last year, up from 57 percent in 2010.
China is also importing massive volumes of gold from Hong Kong.

The Shanghai Gold Exchange reported 2014 total withdrawals came in at over 2,100 tonnes, just 3.6% off the 2013 record.
According to the World Gold Council Chinese gold demand will rise by roughly 25% over the next four years.
Per capita gold holdings in China are five grams compared to a developed nation 20 gram average. China’s gold reserves, at 1.2% of its total reserves, makes it the 5th largest gold holder by country – in comparison the U.S. and Germany hold 70%.
India has once again overtaken China as the world’s biggest gold consumer, buying 225.1 tonnes of gold jewellery, coins and bars Q3 2014, compared to 182.7 tonnes in China. India recently relaxed gold import restrictions scrapping the 80:20 rule that stated that 20% of imported gold had to be re-exported in fabricated form.
Central banks were net buyers of gold for the 15th straight quarter buying 93 tonnes during Q32014.
Leverage
Gold is, in this author’s opinion, an extremely undervalued financial instrument. A portion of every investors portfolio needs to be dedicated to holding gold and silver bullion.
But historically, and perhaps especially so today for all the reasons listed above, the greatest leverage to rising precious metal prices has been owning the shares of junior resource companies focused on acquiring, discovering and developing precious metal deposits.
“When the time comes and the gold price is moving to the upside again, you’ve got to be in the shares because that’s where the leverage is. This opportunity that’s been created – I don’t think I’ve ever seen, in the 40 plus years I’ve been following the sector, the shares cheaper in relation to the price of bullion as they are now. Given my extreme bullishness on where bullion is headed in the next three to four years, I think the opportunity in the shares is historic and I encourage people to take a very close look at them. What really encourages me is very few people own them today. They don’t even talk about it.” John Embry, I’ve never seen this in my 40+ years in the investment business, Mining.com
Conclusion
Do you want to own the cheapest gold and silver you can find to reap the maximum coming rewards? If you do, buy it while it’s still in the ground.
The fact is junior resource companies – the owners of the worlds future precious metal mines – are on sale. If you like their management team, their projects and their plans for 2015, perhaps now is the time to be slowly acquiring a position.
Why? Well besides the fact that I believe that precious metal focused junior resource companies offer the greatest leverage to increased demand and rising prices for precious metals there’s obviously going to be a very real and increasing trend for Mergers and Acquisitions (M&A). Juniors, not majors, own the worlds future mines and juniors are the ones most adept at finding these future mines. They already own, and find more of, what the world’s larger mining companies need to replace reserves and grow their asset base.
Gold’s bull market is not over and here at Ahead of the Herd our edge is twofold. First, it’s being right about the future for precious metals. Second, it’s having an excellent selection of well managed junior’s with plenty of metal in the ground to gain the desired leverage to rising gold and silver prices.
Precious metal focused junior companies are again going to have their turn under the investment spotlight and should be on every investors radar screen.
Are they on yours?
If not, they should be.
Comments Off on What’s your edge?
Chinese Copper Elephant
December 24th, 2014By Richard (Rick) Mills.

As a general rule, the most successful man in life is the man who has the best information
Wood MacKenzie sees stronger prices for copper.
“Over the last 10 years, copper’s annual average growth rate in demand has been 13% for China. The annual growth rate over the next five years is going to be 5%. Over the last 10 years, average annual copper consumption has been 600,000 tonnes, and going forward it’s going to be 500,000 tonnes…” Northern Miner

Rio Tinto
An October update to the Thomson Reuters GFMS 2014 Copper Survey predicts global demand will have grown by 859,000 tonnes in 2014.
Again from the Northern Miner interview with Julian Kettle head of metals and mining research at Wood Mackenzie in London:
“Copper is always the most interesting metal, and the issue with copper is that we get disruptions to supply on an ongoing basis. Mine disruptions will typically vary from 3–8% of global copper supply, but this year we think it’s going to be above trend at 5–5.5%. So this year, we’ll see about 1 million tonnes of copper supply taken out of the market.
TNM: Why are disruptions so typical of copper?
JK: There are a whole range of factors. You’ve got pit-wall failures, strike action, technical issues, slow ramp-ups, weather-related issues and grade. If you were to look at what’s happened so far this year, the major contributor to disruption has been lower ore grades, slow project ramp-ups and a disruption to supply out of Indonesia because of the concentrate export ban. You had Grasberg reduce production levels to 60% of capacity and you also had a short-term stoppage of production at Batu Hijau.”
The International Copper Study Group forecast the copper market, after five straight years of deficits, should swing into a 2015production surplus of roughly 390,000 tonnes – less than a month of current daily demand. It’s obvious that even short lived disruptions would will have a huge impact on copper’s price.
BNP Paribas said that 18 new mines and expansions could result in 1.8 million mt of new mine supply over the next two years. If we can count on Thomson Reuters GFMS 2014 Copper Survey prediction of global demand growing by 859,000 tonnes in 2014 being carried forward another two years it’s very evident there is little to no copper surplus if we factor in even the low 3% estimate let alone use the 5.5% (1 million tonne) estimate given by Julian Kettle.
The elephant in the copper supply room is China, after all the country does consume 45% of the worlds copper.

“Time to turn positive on base metals, by Caroline Baine, senior commodities economist at Capital Economics, features a graph that shows China’s copper consumption growth in relation to physical copper usage.
It highlights the fact that like GDP, copper consumption in the country is now coming from a much higher base and points out that a 9% increase in copper consumption in 2004 resulted in a 280,000 tonne increase in usage, while the 9% jump in 2013 represented nearly 800,000 tonnes of additional copper.
Even better, copper consumption growth is outpacing overall economic growth and according to the independent research house the latest data suggest that China’s apparent copper consumption will have grown by a robust 10% this year and demand indicators point to strengthening going into 2015.” Frik Els, China vs copper – much better than you think, Mining.com
Conclusion
This author believes that the US and Europe are, or are in the process of becoming, mostly irrelevant when it comes to the demand side of the copper supply equation. Increased demand for the red metal in developing nations will more than make up for decreased demand in the western world. And when western economies recover, as they eventually must, then the supply squeeze will become even tighter.
The citizens of the worlds developing nations aspire to have what we have, the ease of travel, home phones, electricity, central plumbing, heating and air conditioning, cars, toys, consumer electronics and home appliances.
When you consider the recent lack of exploration spending, increasing demand from developing countries, country risk (the Democratic Republic of the Congo, the DRC, comes to mind) declining resources/grades at the world’s largest copper mines and that a sufficient number of new deposits that have been found are not being brought on stream in a timely enough fashion – and those that are, carry, for the most part, much lower grades than those presently being mined then you might be forgiven for coming to the same conclusion that I have – If even just one small black swan event happens in the finely balanced, extremely tight copper supply sector people are finally going to realize just how precarious our supply situation is regarding the red metal.
China alone has one fifth of the world’s population, India another 1.2 billion people, most of them want the same quality of living and level of consumerism and materialism we enjoy in the west. Most of our forecast population growth is expected to come from developing countries and Africa is expected to provide the lion’s share of that growth.
Could copper come into a major demand squeeze? Is the red metal on your radar screen?
If not, it should be.
Comments Off on Chinese Copper Elephant
The Makings of a discovery
November 22nd, 2014
By Richard Mills.
We are going to follow the process a junior resource company takes in making a discovery; in this case we are going looking for uranium, but are also reminded of the Voisey’s Bay story when two diamond prospectors almost inadvertently found a large nickel, copper and cobalt deposit. This junior has potential for not only uranium, but also gold and platinum group elements.
In this case, our junior is looking in the most prospective and geologically fertile place in the world for discovering uranium. There’s no contest here, if you are looking for uranium the Athabasca Basin in Northern Saskatchewan and Northeastern Alberta is where you need to be.
Athabasca Basin
 The Athabasca Basin is an ancient, roughly bathtub shaped, sedimentary basin located along the Northern Alberta-Saskatchewan border south of Lake Athabasca. The Basin covers approximately 100,000 square kilometers in Saskatchewan and a small portion of Alberta.
An airborne survey (a consortium flew an airborne radiometric survey over the Basin in 1967) and follow-up ground radiometric prospecting with systematic drilling led to the early discoveries of Rabbit Lake in 1968 and Cluff Lake in 1970 (the discovery of these two deposits led to the recognition of the unconformity deposit model).
When the Cluff Lake D Zone was found in 1969 the Athabasca Basin become host of the highest grade uranium deposit ever discovered. The D Zone discovery news resulted in a huge staking rush by not only junior companies, but also large multinational oil companies. The Athabasca Basin legend had been born and heralded the beginning of a prolific period of ongoing high-grade uranium discoveries incomparable to any other district in the world.
The initial discoveries were made by airborne then surface indicators – radioactive boulders, geochemical anomalies in the surrounding lakes and swamps and geophysical signatures. Hydrothermal fluids associated with high-grade uranium deposits will cause extensive alteration of the host rock, resulting in displacement and removal of minerals/elements, creating porosity and subsequent density contrast. This density contrast will be expressed as a gravity low anomaly and is a prime drill target when qualified by other coincident indicators of uranium mineralization such as geochemistry and radon.
The discoveries at Key Lake (richest open-pit deposit in the world) in 1975-76 and Cigar Lake in 1981 prompted a growing emphasis on Electromagnetic (EM) conductors as a key factor in exploration for these unconformity deposits.
Electromagnetic surveys outline areas where conductive material exists in the basement rocks. The commonly recognized conductive feature is graphite within meta sedimentary rocks. Although graphite does not always have uranium mineralization, the known uranium deposits in the Athabasca Basin almost always have graphite associated with them. Since 2006 virtually the whole basin has been covered by EM surveys.
It’s important to note that the same methods which led to the early basin discoveries are the same methods currently employed to make new discoveries.
Unconformity-related deposits
Most economic uranium deposits form when uranium is remobilized from one area and re-precipitated in a host rock where chemical conditions are conducive to concentrating the uranium at higher concentrations.
An unconformity is a time gap in the rock record between two rock units. In the Athabasca Basin, the lower unit may be deformed brecciated or altered while the overlying units are less deformed. Uranium deposits can occur in both the underlying and overlying units.
In the underlying units, there may be a weathering zone, fault zone or some other feature that increases the rocks porosity and permeability. In the overlying units, it may be the sandstones or some other features that allows the concentration of uranium. Most commonly these deposits form at or
near a major fault zone, where waters enriched in uranium mixed with a reducing agent that facilitated the deposition of the uranium in the host rock.

The deposits in the Athabasca Basin can occur below, across and immediately above the unconformity, with the highest grade deposits situated at or just above the unconformity (eg Cigar Lake and McArthur River). The earliest known discoveries within the Athabasca Basin were lower grade basement hosted deposits (eg. Cluff Lake, Key Lake and Rabbit Lake). Recent discoveries such as Roughrider and Patterson Lake South, are also basement hosted deposits.
Discovery
Geologists – our juniors equivalent of a police forces crime detective – need to follow various clues in order to discover the presence of uranium. That means our geologists need to be experienced in the search for our chosen mineral, knowledgeable in regards to our chosen area, armed with all the latest and greatest tools of the trade, and be up to date on the latest geophysical and geochemical techniques.
Upon interpretation of historical and modern data – and often times our management and geo’s proprietary knowledge of the area – claims are staked.
Initial work often includes airborne surveys that could include VTEM, ZTEM and a full tensor gravity gradiometry survey. Company’s geologists are then sent to the property to collect soil and rock samples, complete radon surveys, and/or complete geophysical surveys such as resistivity or HLEM. Samples are sent to the lab, surveys results are compiled, analyzed and tied together with results from the lab.
If results are favorable and provide good indications for the discovery of a mineralized body, a drill program is formulated and announced in a news release.
Lakeland Resources TSX.V – LK Announces Drill Program at Gibbons Creek and Star Properties
With only 54 million shares issued and outstanding, Lakeland is held strongly by insiders (25%). The company is well cashed-up with an estimated $2 million, and three projects are at the drill ready stage.Your author believes Lakeland represents the best early-stage drill speculation in the entire basin.
Here’s a summary of the first Lakeland project to be drilled.
Star/Gibbons Creek
The company wholly owns Gibbons Creek and holds a 100% option on Star, these two adjacent properties have been combined into one project.
Lakeland generated several drill ready targets at Star/Gibbons Creek based on their fall 2013 exploration program. Prospecting methods employed included:

Consider
Something to take note of here – Lazy Edward Bay, the second of Lakelands three drill ready projects, is an outstanding project and as I said is ready to be drilled. LK is definitely not a one shot Co. and this is extremely important when doing due diligence on a prospective junior always have a second, even third, project ready to go. If the first program isnt the success you’d hoped for there’s no sitting around waiting for junior to raise money, acquire another project and get it ready to drill. I think its obvious why I like L’K, three drill ready projects and $2m in the bank.
Conclusion
An investment into junior resource company’s should be based on who is involved. Lakeland’s has put together a management team, and advisory board with considerable expertise and experience in the uranium sector.
The driving force, on the geological side of Lakeland’s Resources is the same team of geologists (Dahrouge Geological) that originally conceived the Waterbury Lake Property (J-Zone sold to Denison) and the Patterson Lake Project that eventually turned into the Patterson Lake South (PLS) Uranium Deposit, being developed by Fission Uranium Corp.
Add Zimtu Capitals funding network to the mix and you have a junior with the ability to raise money and a team that is noted for generating multiple early stage discoveries!
Can lightning strike three times for Mr. J. Dahrouge & Co., our detective geologists?
Mother Nature never gives guarantees, and neither do I, regarding the location of her treasures, but your author believes all the geological necessities are present for a discovery, potentially a very large and rich discovery. Add in the fact three drill ready projects considerably de-risk the investment and you can see why Lakeland Resources TSV.VLK is on my radar screen as one of the best prospective for discovery juniors on the TSX.V today.
Is the geological fertility of the Athabasca Basin, the process of discovery, Lakeland Resources and a third lightning strike on your radar screen?
If not, they should be.
Comments Off on The Makings of a discovery
Barrick Comes Home
October 19th, 2014
By Richard (Rick) Mills.
As a general rule, the most successful man in life is the man who has the best information
As part of his plan to prevent a run on the dollar, stabilize the US economy, and decrease US unemployment and inflation rates, on August 15, 1971, U.S. President Richard Nixon directed Treasury Secretary Connally to, among other things, suspend with certain exceptions the convertibility of the dollar into gold or other reserve assets and ordered the gold window to be closed so that foreign governments could no longer exchange their dollars for gold.
For the very first time in our history, all money, all currencies, were fiat – the US dollar use to be gold backed and it was the rock all the worlds currencies were anchored to – when the US dollar became fiat, all the worlds currencies became fiat.
Hindsight – Inflation v. Gold
When a currency loses value it’s called inflation – prices seem inflated as each dollar is able to buy less and less.
If in 1971 I purchased an item for US$1.00 then in 2014 purchased that very same item it would cost $5.87 a cumulative rate of inflation of 487.3%.
Gold has gone from $35.00 an ounce (when Nixon closed the window) to, at the time I’m writing this, $1240.50. And was as high as $1900.00 oz for a short period.
My hindsight is 20/20 so I can clearly see that holding gold was a better move, over the ’71-2014 time period then owning dollars.
Foresight – U.S. $’s Future
Fact – The global economy, and that includes the U.S.’s, is dependent on life support in the form of exceptionally low interest rates.
Fact – We now have is a global wide QE happening, every central bank is now creating, or will soon be creating money as fast as they can and buying assets denominated in dollars.Every country is beggaring their neighbor by printing its own currency in a bid to keep their exports cheaper than their competitors. It’s a race to not just worth less but to worthless.
Q – What do you think is going to happen when the U.S. rejoins the race to worthless, the Fed restarts the printing presses and doesn’t raise interest rates?
Hint – Since the Federal Reserve was created in 1913 the U.S. dollar has lost more than 95 percent of its purchasing power.
Worrisome Things
In our immediate future there are a lot of serious issues including; currency devaluation, continual war, deteriorating geo-politics, religious genocide, China and its faltering relations with other China Sea stakeholders, Ebola, resource nationalism, climate change, possible bond market implosion, social unrest, very weak global macroeconomic data, resource wars, scarcity of fresh water for drinking, sanitary purposes and irrigation.
Investors need to own some precious metal bullion and the shares of gold/silver exploration/development companies.
Country Risk
One of the most serious and unpredictable risks facing mining operations and investor interests is “country risk” – where the political and economic stability of the host country is questionable and abrupt changes in the business environment could adversely affect profits or the value of the company’s assets.
Many countries might come to mind as places where shareholders could, without warning, receive news that their operations have been taken over by the government and/or its friends, or that permits are suddenly suffering delays or have been cancelled outright.
There’s not a lot of country risk in Nevada, U.S.A. And that’s good because Nevada produces more gold then South Africa and Chile combined – the state of Nevada accounts for six percent of global gold production.
Barrick Gold Corp.
Barrick Gold Corp., the world’s largest gold miner, knows all about Nevada.
And perhaps that’s why Barrick is ‘coming home’ to the state that helped make the company – Nevada is home to some of Barrick’s largest operations, including its massive Goldstrike and Cortez mines.
According to many of Barrick’s senior officers Nevada is the most prospective place on earth to explore for gold. Strange that much of the company’s attention, to its great detriment, has been globally focused in recent years.
But now Barrick is shuffling management, cutting costs (for 2013, Barrick produced 7.2 million ounces of gold at all-in sustaining costs of US $915/ounce and 539 million pounds of copper at C1 cash costs of $1.92/pound) and refocusing its operations. This renewed focus comes following billions in impairment charges in 2013 (and half a billion more in early 2014) related to the value of many of its ‘not in Nevada’ projects.
In an effort to cut costs, the company has sold its portfolio of mines down to 19 compared to the 27 it had in 2012.
Spring Valley
Yet in Nevada Barrick is advancing its South Arturo project, extending the ore body at Cortez Hills and expanding its Turquoise Ridge mine. It’s also fact tracking its Spring Valley joint venture (JV) with Midway Gold.

2014 Updated Spring Valley Resource Estimate
Barrick is coming home to Nevada. Top company executives have repeatedly said Nevada is the primary focus of the company’s gold mining ventures.
Barrick completed its 70 percent earn in on the Spring Valley project by spending US$38 million a year ahead of schedule.
After Midway opted to be carried to production (will pay back its share of development capital from production) Barrick raised its interest in Spring Valley to 75 percent.
Barricks going to spend US$17.4 million on Spring Valley in 2014 – twice the amount that was spent in 2013.
Barrick has publicly stated that Spring Valley “could potentially be a new stand-alone gold mine.”
Barrick even highlighted the project in the company’s most recent investor presentation.

After reading all of the above you’d have to think Barrick, the world’s largest gold miner, is pretty serious about fast tracking development of the Spring Valley project.
Terraco Gold TSX.V – TEN
Terraco owns a gold net smelter return (NSR) royalty suite of assets on almost all of the Spring Valley deposit.

Terraco’s NSR includes three separate components:
Ian Gordon, President of Longwave Analytics, kindly breaks down (do it yourself here) the numbers for us as to what the Spring Valley deposit NSR royalty might possibly be worth to Terraco’s shareholders:
“1. Contained gold – 327,857 ounces for 14 years and 220,002 ounces in year 15.
2. Expected gold recovery – 80%=298,286 produced or payable ounces per annum for 14 years and 176,002 ounces in year 15.
3. Mine life – 15 years.
4. Anticipated gold price for the life of the mine – $1,500.00 (U.S.) per ounce.
5. Approximately 75% of the ore body lies within Terraco’s 3% royalty and 22% within the 1% royalty. On the basis of the anticipated annual gold production this equates to net proceeds to Terraco of $129,607,778 (U.S.) over the 15 year life of the mine.
By applying a reasonable 5% discount rate to each year of the royalty proceeds, the net present value of the 16 year total royalty payments of $129,607,778 (U.S.) paid to Terraco equals $70,528,067 (U.S.). From this amount $16,083,000 (U.S.) is deducted, which is the amount that Terraco must pay to exercise on the remaining royalty option. This leaves a net present value of Terraco’s royalty on the Spring Valley project of $55,940,312 (U.S.). Terraco Gold has 134,797,151 shares outstanding, which when divided into the net present value of the royalty is equal to a value $0.415 per share.”
Today, Oct. 16th 2014, Terraco closed at .175.
Midway Gold owns 25 percent of the Spring Valley Project and is carried, free, to production. Midway gets to keep ten percent of its share of production profits, the rest, 90 percent, goes to Barrick to pay them back for Midway’s share of production costs. Once Barrick is paid back for the carry Midway will receive it’s full 25 percent.
There’s a total NSR royalty on the deposit of seven percent. We know three percent belongs to TEN’s shareholders, another three percent belongs to an entity I will keep nameless and one percent is locked into a family trust and will never be sold.
Barrick’s Spring Valley gold deposit, the one it seems so keen to fast track, has a 25 percent carried partner and a seven percent NSR royalty.
Story Time
In 1985, Franco-Nevada paid US$2,000,000.00 for a royalty interest in a small Nevada mine called Goldstrike. At the time Goldstrike had just 30,000 oz. of gold.
One year later Barrick purchases the property and starts exploring.
The Goldstrike Property produced 892,000 ounces of gold in 2013 at all-in sustaining costs of $901 per ounce. Goldstrike’s proven and probable mineral reserves as at December 31, 2013, were 10.7 million ounces of gold.
Franco-Nevada has gotten an NSR royalty payment on every ounce of gold that has ever come out of Barrick’s Goldstrike mine and will continue to do so for the life of the mine.
Here’s what David Harquail, President and CEO of Franco-Nevada – the company that in the mid 1980’s pioneered the use of royalties – has to say about the royalty business…
“It’s the best business because you don’t have to do the risky exploration, but you still can get the upside of a great discovery.”
No kidding. Either way, keeping the royalty or selling it would be huge for Terraco shareholders.
 Moonlight
There’s more to the Terraco/Nevada story than ‘just’ an NSR royalty on a 75 percent Barrick owned fast tracked gold project.
Terraco also controls the over 35 sq km Moonlight Project, a contiguous land package connected to the north side of the Spring Valley project. The Moonlight Project is one of the largest early stage properties remaining on the Humboldt Trend and the company has been quietly consolidating and increasing its land position over the last several years.
Barrick’s drilling confirms the Spring Valley deposits gold mineralization is open to the north (towards Moonlight) and at depth.
So there is evidence to suggest that Moonlight could be the next mineralized event in a string of deposits on the Humboldt Trend ranging from Relief Canyon at the south end, north through Nevada Packard, Rochester, Spring Valley and Moonlight.
As if Terraco’s Nevada story wasn’t already interesting enough another of the world’s major miners walked into Terraco’s Nevada story, the following is from TEN’s website…
“Southern Humboldt Range New Entrant – Sumitomo
Regional Southern Humboldt Range activity, in addition to the above noted Spring Valley developments, includes a new entrant along trend adjoining Terraco’s Moonlight Project to the North. Renaissance Gold Inc. (“Renaissance”) has signed an exploration agreement with Sumitomo Corporation’s U.S. subsidiary, Summit Mining Exploration II, Inc., to earn up to a 70% interest in the Fourth of July project that is along strike (to the north) from the Rochester Mine, Barrick’s Spring Valley and Terraco’s Moonlight Project. Terraco’s Moonlight Project now sits between two major mining companies in Barrick and Sumitomo.”
Almaden
In addition to the Spring Valley Royalty and it’s Moonlight Project, Terraco has an advanced-stage gold project in Idaho (the Nutmeg Mountain / Almaden Project) which hosts a National Instrument 43-101 compliant gold resource of almost one million ounces. This advanced-stage project has excellent access and infrastructure and has over 66,140 meters of drilling in 903 drill holes.
The project is host to a low-sulphidation, epithermal gold deposit that sits on the side of Nutmeg Mountain, you would push material down to end up on a leach pad, there’s no stripping ratio to speak of and there’s already landslide material at the bottom – the inferred resource of 84,000 ozs of gold.
Conclusion
There are a whole lot of reasons (and all of them spring from having an excellent management team) for investors to have Terraco Gold Corp. TSX.V – TEN on their radar screen.
Comments Off on Barrick Comes Home
Zero bound only game in town
October 13th, 2014
By Richard Mills.
The Federal Reserve tried to fix the U.S. economy by Quantifornication – stimulus measures.
Investors reacted to the Fed’s unconventional efforts. Since the U.S. dollar is the world’s reserve currency and precious metals are priced in dollars they bought gold and silver to protect their wealth against currency devaluation and inflation.
Gold catapulted to a record in 2011 as investors wagered on higher inflation and a weakening dollar.
 |
 |
Gold and silver soar in price
How things have changed, the dollar has recently gained a lot of new friends while gold has very few left. The Fed is going to end its bond-purchasing program this month and start raising interest rates sometime in 2015, experts are talking June/July.
Investors believe:
Expectations regarding the Fed’s present, and it’s next moves, are pushing the dollar ever higher, gold and silver lower.

The chart above compares the movement in the dollar index with gold’s price.
Have investors got it wrong? Should we be more happy about rising interest rates or more worried about Russia/Ukraine, religious genocide, China and its deteriorating relations with other China Sea stakeholders, Ebola, very weak macroeconomic data coming out of Europe/Japan/Brazil, a slowdown in China and more than a few other hot buttons?
And do rising long rates really threaten gold? Has gold’s price ever gone up in conjunction with rising interest rates?
The following information and snippet is from Adam Hamilton and Scott Wright over at Zeal Intelligence.
Between August 1976 and January 1980 gold went up 731.7 percent, at the same time 10y Treasury yields climbed from 7.7 percent to 11.0 percent, a 42.2 percent climb.
From April 2001 to May 2006 gold nearly tripled with a 180.6 percent gain. During that time the average yield in benchmark 10y Treasuries was over 4.4 percent.
“For nearly its entire bull run, gold thrived in long-yield environments much higher than today’s.
During the first 7 years of gold’s secular bull climaxing in March 2008, the metal nearly quadrupled with a 291.7% gain. Yet over that entire span, 10y Treasury yields averaged 4.5%.
By December 2009 gold’s secular bull had been powering higher for nearly 9 years, and somehow managed to gain 373.5% across a once-in-a-century stock panic over a secular span where the 10y Treasury yield averaged 4.3%…Rising long rates weren’t a threat to gold in its last secular bull, and they weren’t a threat to gold in this secular bull…
Between June 2003 and June 2006, 10y Treasury yields soared 68% higher from 3.1% to 5.3%. Surely 5%+ yields would crush gold, right? All those deluded fools buying that anachronistic zero-yielding relic would see the error in their irrational ways and shift into good safe Treasuries. But that’s not what happened. Over that 3-year span, the gold price climbed 63.8% despite a steady rising-long-rate environment!”
Peters got his thinking cap on
 “Peter Pan’s advice was to think of an impossible thing each morning. FOMC members have presumably been following this advice…” Vincent Reinhart, chief U.S. economist at Morgan Stanley and former top U.S. central bank staffer, referencing the Federal Reserve’s exit strategy
Are we even going to see rising rates?
The following snippets are from an article written by Michael Pento over at pentoport.com…
“Today, the equity and bond markets have positioned themselves for the best outcomes of all possible scenarios. These markets are assured that the Fed can painlessly exit QE in October and real interest rates will rise with no ill effects on the economy…
As the world’s Central Banks frantically print money, the US dollar is soaring due to the belief that the US economy will remain unscathed from a global economic slowdown…
Investors should think again if they believe the Yellen Fed will be aggressively raising rates and boosting the value of the dollar given the labor market’s already-fragile condition…today’s central banks, determined to smooth out every hiccup in the economy, only have one answer–print money. When all you have is a printing press, every problem looks like a monetary crisis.
The Fed will not be raising rates anytime soon. To the contrary, Ms. Yellen will soon be forced back into the money printing business…
The next phase in the gold bull market will include the four conditions of; negative real interest rates, rapid money supply growth, a falling dollar and skyrocketing deficits.” Michael Pento,Why Goldman Sachs is Wrong on Gold
Could the U.S. government survive higher rates? Not according to Peter Schiff of Euro Pacific Capital…
“Unfortunately, the Fed’s zero interest-rate policy (ZIRP) is the very thing making the economy appear healthy. It has boosted stocks and financed corporate acquisitions. It has also allowed the federal government to continue operating under a crushing debt load. Even a rise in rates to historically average levels could very well bankrupt the federal government and many of America’s remaining industrial giants.”
Tom McClellan, from the McClellan Market Report, tells us the dollar is in for a big downturn.
The U.S. Dollar Index has recently been in one of the biggest blowoff moves we have seen in years. The lesson of the past blowoffs is that the downward slope out of the eventual top tends to symmetrically match the slope of the advance up into it.
…commercial traders of various currency futures contracts are already making a huge bet on a dollar decline…
The current reading is the highest in the history of this indicator, which dates back to the creation of the euro currency in 1999. That is another way of saying that the “smart money” commercial traders are making a huge bet that this uptrend in the dollar is going to reverse itself. Commercial traders are often early in adopting a lopsided position, but they are nearly always proven to be correct.
…a big dollar downturn should be a huge tailwind for gold prices finally starting to rise.”
Here’s Gregory Mannarino’s take on whether or not the U.S. is really in a recovery.
“All you need to do is look at two metrics, just two, and you can see there is no economic recovery. One of them is the money velocity. That’s the rate that cash is moving through an economy. We are at historic lows here. We also have a labor force participation rate at a three decade low. So, please explain to me how we can have a recovery without those two simple metrics.” Gregory Mannarino, financial analyst/trader during a Greg Hunter interview on USAWatchdog
 |
 |
Zero Bound
According to Wikipedia “the Zero Lower Bound (ZLB) or Zero Nominal Lower Bound (ZNLB) is a macroeconomic problem that occurs when the short-term nominal interest rate is at or near zero, causing a liquidity trap and limiting the capacity that the central bank has to stimulate economic growth.”
“Based on the lessons of the Depression scholars like Ben Bernanke and Lars Svensson have hit on the key ingredients to a monetary-policy solution.
They are:
Mr Svensson describes his combining of these basic elements as the “foolproof” route off the zero lower bound.” Economist, ‘On escaping the zero lower bound’
Hello…hello, calling Ben and Lars, are you there? This is earth calling Ben and Lars, did you get the interstellar memo? It ain’t working dudes, Janet’s fucking everything up.
The reality we now have is a global wide QE is happening, every central bank is now creating, or will soon be creating money as fast as they can. All of this money is looking for a home where it will earn a return – a return that isn’t being eroded by inflation – and right now their best option is supporting the U.S. dollar by printing their currency and buying assets denominated in dollars.

A rising dollar does have benefits for the U.S.:
A stronger dollar comes with some serious problems although they will take a few quarters to manifest themselves:
So far we’re looking at U.S. based internationals earnings dropping, with a resulting fallout effect on markets. U.S. growth will slow, GDP will drop, deficits are going to again balloon out of control and disinflation or outright deflation instead of inflation will be the norm.
Some people would argue that QE has been successful, at the very least preventing full blown economic disaster. Well maybe, but for sure no one can argue against the fact it has been a resounding failure in reviving household consumption. Dropping labor force participation rates and vanishing money velocity equals low household expenditures.
“Since early 2008, annualized growth in real consumer expenditure has averaged a mere 1.3% – the most anemic period of consumption growth on record.
This is corroborated by a glaring shortfall in the “GDP dividend” from Fed liquidity injections. Though $3.6 trillion of incremental liquidity has been added to the Fed’s balance sheet since late 2008, nominal GDP was up by just $2.5 trillion from the third quarter of 2008 to the second quarter of this year.” Stephen S. Roach, ‘The Fed Trap’ Project Syndicate
Household consumption accounts for 70 percent of the U.S. economy.
Conclusion
As the dollar gains, gold loses more ground.
Ironical isn’t it? After all, the main reason behind gold’s bull market was a failing dollar system that, truth be told is in worse shape now then when the precious metal bull started to run.
Fact – Gold and silver are dollar alternatives.
Fact – All the talk regarding a return to higher interest rates is overshadowing escalating political tensions. You cannot ignore geo-politics, tensions are rising across the globe.
Fact – The U.S. is not going to be able to withstand the pressures on its economy arising from a much stronger dollar for long.
Every country is ‘Beggaring Their Neighbor’ by printing its own currency in a bid to keep their exports cheaper than their competitors. It’s a race to not just worth less but to worthless and the new Zero Bound is the only game in town. The U.S. can’t, and won’t stand by and watch, sooner rather than later they will have to join the race…again.
Trying to pick an absolute bottom is a mug’s game, yes there might be more downside coming to precious metals but this author believes there is a massive dollar correction coming. You need to have precious metals on your radar screen.
Do you?
Comments Off on Zero bound only game in town