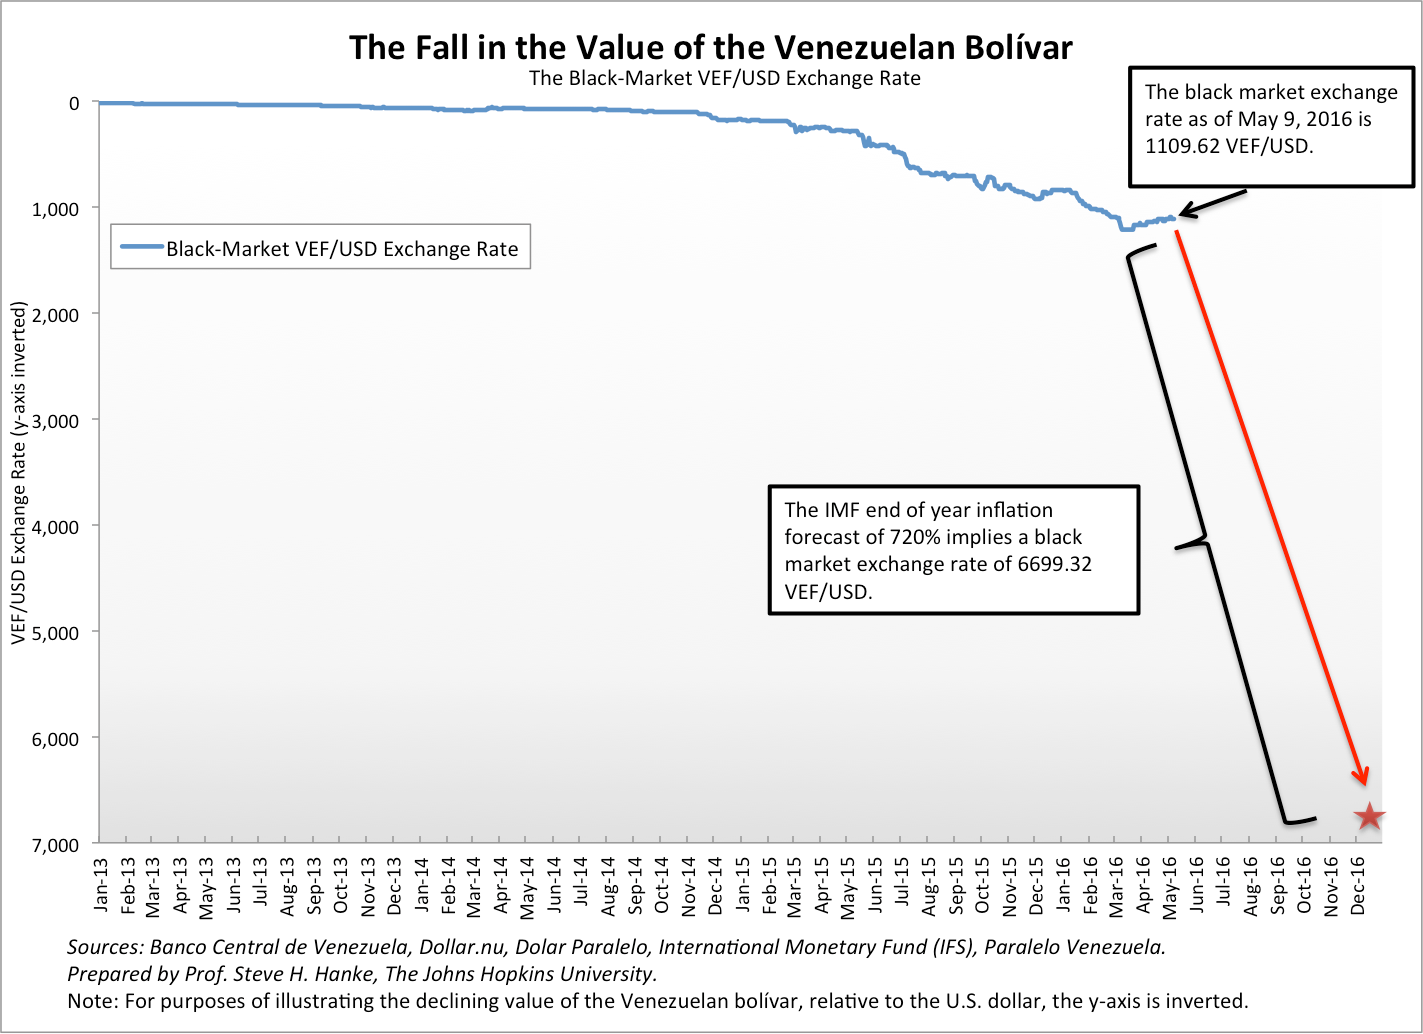
In January, the International Monetary Fund (IMF) told us that Venezuela’s annual inflation rate would hit 720 percent by the end of the year. The IMF’s World Economic Outlook, which was published in April, stuck with the 720 percent inflation forecast. What the IMF failed to do is tell us how they arrived at the forecast. Never mind. The press has repeated the 720 percent inflation forecast ad nauseam.
Since the IMF’s 720 percent forecast has been elevated to the status of a factoid, it is worth a bit of reflection and analysis. We can reverse engineer the IMF’s inflation forecast to determine the bolivar-greenback exchange rate implied by the inflation forecast.
When we conduct that exercise, we calculate that the VEF/USD rate moves from today’s black market (read: free market) rate of 1,110 to 6,699 by year’s end. So, the IMF is forecasting that the bolivar will shed 83 percent of its current value against the greenback by New Year’s Day, 2017. The following chart shows the dramatic plunge anticipated by the IMF.
Comments Off on The IMF Predicts a Collapse of Venezuela’s Bolivar
Ever since the U.S. Federal Reserve (Fed) began to consider raising the federal funds rate, which it eventually did in December 2015, a cottage industry has grown up around taper talk. Will the Fed raise rates, or won’t it? Each time a consensus congeals around the answer to that question, all the world’s markets either soar or dive.
This obsession with taper talk — the interest rate story — is simple, but strange. Indeed, it is misguided — wrongheaded. So, why the obsession? It is, in part, the result of a Keynesian hangover. The Keynesians focus on interest rates. The mainstream macro model that is widely in use today is referred to as a “New Keynesian” model. The thrust of monetary policy in this model is entirely captured by changes in current and expected interest rates (the price of money). Money is nowhere to be found, however.
The misguided focus on interest rates not only poses a problem for those who are observing the current economic environment and formulating expectations, but also for those who are interpreting important economic and market events of the past. For example, Nobelist and Keynesian Robert Shiller, in his famous book, Irrational Exuberance, comes to the conclusion that the stock market crash in 1929 was caused by the Fed’s excessively restrictive monetary policy. That’s because Shiller focuses on interest rates and thinks that the Fed’s increase in the discount rate in August 1929 signaled monetary tightening. But, as Elmus Wicker carefully documents in Wall Street, the Federal Reserve and Stock Market Speculation: A Retrospective, which was recently published by the Center for Financial Stability in New York, the Fed was accommodative, not restrictive, prior to the 1929 stock market crash.
This interest rate obsession is amazing, particularly since Keynes dedicates quite a few pages in A Tract on Monetary Reform (1923) to money and its role in national income determination. Then, in his two-volume 1930 work, A Treatise on Money, Keynes devotes a great deal of space to banks and their important role in creating money. In particular, Keynes separates money into two classes: state money and bank money. State money is the high-powered money that is produced by central banks. Bank money is produced by commercial banks through deposit creation.
Keynes spends many pages in The Treatise dealing with bank money. This isn’t surprising because, as Keynes makes clear, bank money was much larger than state money in 1930. Well, not much has changed since then. Today, bank money accounts for almost 82 percent of the broad money supply (M4) in the United Kingdom.
We should keep our eyes on money broadly measured (state, plus bank money), and money properly measured (when available, Divisia, not simple sum measures). A monetary approach to national income determination is what counts over the medium term. The link between growth in the money supply and nominal GDP is unambiguous and overwhelming. Never mind. There remain plenty of deniers of basic principles and centuries of clear evidence.
Since the collapse of Lehman Brothers in 2008, there has been a dramatic change in monetary policies in most parts of the world. Bank regulations have been tightened and supervision has become much more severe. Large-scale bank recapitalizations and deleveraging have become the order of the day. These policies, which impact the production of bank money, have been ultra-tight and procyclical.
In an attempt to expand the total supply of broad money, many central banks have had to engage in quantitative easing (QE). This state money policy is ultra-loose and countercyclical. But, given that state money accounts for a relatively small portion of broad money, broad money in many countries has been growing relatively slowly. So, overall monetary conditions have been relatively tight and modestly procyclical. In consequence, real GDP growth and inflation, which constitute nominal GDP growth, have come in below their trend rates.
The accompanying table shows the changes in state money, bank money, and broad money for the ten largest economic regions in the world. The U.S., Japan, the Eurozone, the U.K., and Korea lead the field in terms of QE. All have ramped up their production of state money. This can be observed by noting that the proportion of state money to broad money jumps up from September 2008 to January 2016 in these countries. For China, Canada, Brazil, India, and Russia, the picture is different. The share of state money to broad money declined, indicating that they did not engage in QE. When we look at bank money, the situation in the U.S., Japan, and the U.K. has been stunning. For these countries, the amount of bank money in the economy was lower in January 2016 than in September 2008. Talk about tight bank money policies. It’s not surprising that the U.S., Japan, and the U.K. embraced QE early in the game. If they had not done so, the growth in broad money would have been much more anemic than it was, and deep recessions would have ensued.
The Eurozone arrived at the QE party a bit late. But, it arrived nevertheless. Now, European Central Bank (ECB) President Mario Draghi and QE face a wave of criticism. Many in Germany, for example, oppose QE. Many even argue that the ECB (and other central banks) are out of ammunition. This is nonsense.
Let’s take a look at one QE operation that would directly boost the money supply without increasing the government’s net debt. The process begins with the government borrowing from commercial banks. Short-dated government paper is transferred to banks. In exchange, the deposit balance of the government is credited.
This new government deposit is not counted as a part of the money supply. The government then uses its bank deposits (which are not considered money) to purchase long-dated government bonds from the non-bank private sector. These transactions add to the non-bank private sector’s bank deposits and directly to the money supply, because bank deposits in the name of private persons and entities are money. So, the quantity of money is directly increased by this debt market operation, and an equivalent amount of long-dated government debt is reduced — literally eliminated.
Of course, the amount of short-dated government debt increases when the government initially borrows from the commercial banks. Accordingly, these debt market operations leave the government’s total net debt unchanged, but it does change the composition of the government’s debt, leaving it with a shorter average duration.
So, forget claims that central banks are out of ammunition. Again, the reason that most come to that incorrect conclusion is that they focus on interest rates.
Moving from the broad picture to the U.S., we see in the accompanying table that there have been three QEs. Their impact on state, bank, and broad money is shown in the table. Each QE was associated with a significant increase in state money, which offset, to some degree, the negative “contributions” of bank money to the total supply of broad money.
The accompanying chart traces out the monetary liabilities of the Fed and profiles the course of state money since the Lehman Brothers bankruptcy. By the summer of 2014, QE 3 had run its course, and the level of state money has remained stable.
The last chart depicts the huge expansion of state money. That’s shown by the widening of the green area since the Lehman Brothers collapse. Although expansive, the QE has hardly been enough to offset the tightness in bank money. In consequence, broad money has only been growing at a 1.72 percent annual growth rate since October 2008. So, it’s not surprising that nominal GDP has grown relatively slowly and that we have not witnessed the inflation surge predicted by many who were only watching the Fed’s balance sheet balloon.
To say that money and monetary policies are misunderstood is an understatement. What’s worrying is that the political class does not have the faintest understanding of the importance of bank money. Their populist bank-bashing rhetoric and regulations are putting a drag on the growth of bank money and economic activity.
On April 6th, the Wall Street Journal published an editorial that merits careful examination: “Jack Lew’s Political Economy”. The Journal correctly points out that the Obama administration’s meddling with regulations and red tape is killing U.S. investment and jobs. The most recent example being the Treasury’s new rules on so-called tax inversions, which burried a merger between Pfizer, Inc. and Allergan PLC.
As the Journal concluded: “This politicization has spread across most of the economy during the Obama years, as regulators rewrite longstanding interpretations of longstanding laws in order to achieve the policy goals they can’t or won’t negotiate with Congress. Telecoms, consumer finance, for-profit education, carbon energy, auto lending, auto-fuel economy, truck emissions, home mortgages, health care and so much more.”
“Capital investment in this recovery has been disappointingly low, and one major reason is political intrusion into every corner of business decision-making. To adapt Mr. Read [Pfizer CEO Ian Read], the only rule is that the rules are whatever the Obama Administration wants them to be. The results have been slow growth, small wage gains, and a growing sense that there is no legal restraint on the political class.”
Washington’s destructive policies have been dubbed “regime uncertainty” in a strand of innovative analyses pioneered by Robert Higgs of the Independent Institute. Regime uncertainty relates to the likelihood that an investor’s private property – namely, the flows of income and services it yields – will be attenuated by government action. As regime uncertainty is elevated, private investment is notched down from where it would have been. This can result in a business-cycle bust and even economic stagnation. I recommend Higgs’ most recent book for evidence on the negative effects of regime uncertainty: Robert Higgs. Taking a Stand: Reflections on Life Liberty, and the Economy. Oakland, CA: The Independent Institute, 2015.
When Freddie Gray was born in 1989, Baltimore hosted 787,000 residents and 445,000 jobs. By the time his fatal injuries in police custody provoked riots last April, the city’s population had fallen by one fifth, to 623,000, and its job base had shrunk by one quarter, to 334,000.
Little wonder that throughout his life, Mr. Gray had never been legally employed. Nevertheless, friends and family considered him “a good provider,” according to The Baltimore Sun.
This was because he worked in the drug trade, which filled his city’s economic vacuum. An average day on the corner can yield take-home pay ten times that available in the low-skill warehousing or service jobs sometimes available to high-school dropouts like Gray.
The catch, of course, is that such rewards carry two great risks. The lesser of these is regular involvement with the justice system. Gray was arrested 18 times and served three years behind bars in his tragically brief life.
Far more dangerous is how competition works in illegal markets. When selling contraband, one does not pursue market share by advertising high quality or low prices. Sales are increased by acquiring territory from rivals, often violently.
For Baltimore’s drug cartels, the post-riot disequilibrium provided an opportunity for market expansion. Inevitably, each strategic assassination produced reprisals and collateral damage.
As a result, 2015 saw the highest homicide rate in Baltimore’s history, at 55 per 100,000 residents — over 13 times New York’s rate. This horrific suffering was concentrated in the African-American community: 93% of victims were black, of which 95% were male and 65% aged 18 to 34.
In Freddie Gray’s demographic, then, the homicide rate was 450 per 100,000 — higher than the peak U.S. combat death rates recorded in the wars in Iraq and Afghanistan.
The prevailing narrative is that all this is a by-product of structural racism and exemplifies a society “built on plunder” (according to the celebrated black radical Ta-Nehisi Coates). This is a myth.
It is not that racism doesn’t exist but rather that it is relatively constant. When explaining variations in economic and social outcomes, constants have little power.
It’s the application of destructive public policies that explain why neighborhoods like Gray’s Sandtown-Winchester are deprived. If one had to put a label on this malignant force, it might be structural statism: an addiction to market-unfriendly governmental approaches to every problem.
The federal government encourages this addiction. Its partial subsidies for a vast array of entitlements and so-called urban renewal programs induce dependency and leverage the expansion of bureaucracies in Baltimore and elsewhere.
The damaging effects of the statist compulsion are best seen in housing policy. Shortly after the 1937 passage of the Wagner-Steagall Act — premised on the notion that government landlords would serve poor and working-class tenants better than private ones — Baltimore established its Housing Authority. At the end of WWII, the city had built ten projects. By 1980, it would have 30 more.
The resulting intracity diaspora destroyed vast amounts of social capital. The neighborhoods that were leveled to access urban renewal subsidies may not have been pretty, but their residents had accumulated valuable but invisible capital — relationship networks, commercial contacts, and bonds of trust — that government planners simply ignored.
And if that weren’t bad enough, those placed in projects often found City Hall to be a slumlord. Baltimore recently paid $8 million to tenants alleging that Housing Authority workers demanded sex before making needed repairs. Federal audits have been consistently critical over the years, citing deteriorated public properties and administrative inefficiency that often resulted in high vacancy rates and unspent Section 8 voucher monies.
But most critically, this and other renewal programs opened a budgetary vein. Initially, federal housing loans covering 90% of construction costs were irresistible, but Uncle Sam later paid only one third of operating costs. Tenants and the city were supposed to cover the rest. But revenue shrank as subsidized, poor tenants crowded out working-class rent-payers, while costs soared.
In consequence, Baltimore raised its property tax 19 times between 1950 and 1975, and wrecked its economy. Each rate hike imposed capital losses on home and business owners. Predictably, they fled — not plunderers, but plundered. Repeated financial crises, job losses and social dysfunction followed.
Over time, city leaders understood that their tax policy was toxic to investors. Rather than pursue broad-based relief, however, they handed out special breaks to well-connected developers who focused their efforts on the waterfront, far from Mr. Gray’s neighborhood.
Now, at the anniversary of his death and as Baltimore’s primary election approaches, there is much talk that the city is about to chart a new course.
But course changes long have been advertised and seldom delivered. There is no meaningful political competition in cities like Baltimore, which has not elected a Republican mayor since 1963. Among the platoon of Democrats vying to fill the leadership vacuum, the platforms are as different as Tweedledum from Tweedledee — and predictably statist.
The city recently cadged hundreds of millions of dollars in aid from the state for new social-service programs and slum clearance projects. Officials have also pledged a $535 million tax subsidy to a billionaire for yet another waterfront development — its latest attempt to attract new capital without cutting taxes for the little guy. Most troubling, the City Council is advancing legislation to wrest budgetary power from the mayor, which will diminish Baltimore’s already-feeble fiscal discipline.
Post-“unrest” Baltimore seems less interested in effective reform than in more extravagant statism: new programs, projects and pork. We are doubling down on a failed strategy, hoping for different results.
Comments Off on One Year After: Freddie Gray and ‘Structural Statism’
In 2010, Brazil’s Finance Minister, Guido Mantega, coined the phrase “currency war” when he complained about the “cheap” Chinese renminbi (RMB). Mantega claimed this gave China an unfair trade advantage. As he put it to the Financial Times, “we’re in the midst of an international currency war, a general weakening of currency. This threatens us because it takes away our competitiveness.”
That was then. Now the Brazilians are conspicuously silent, because the shoe is on the other foot. The Brazilian real has lost a whopping 25% against the RMB since January 2015. The currency wars continue and are every bit as intense as they were back in 2010, when Mantega coined the phrase.
But, the conventional wisdom about the wonders of weak currencies long predates Mr. Mantega — economists and political leaders have been deceiving the public on the advantages of currency devaluations for centuries.
The advertised goal of a devaluation is to increase the price of foreign produced goods and services and decrease the price of domestically produced goods and services. These changes in relative prices are supposed to switch domestic and foreign expenditures away from foreign produced goods and services towards those produced domestically. This is supposed to improve the devaluing country’s international trade balance and balance of payments.
For the public, this argument has a certain intuitive appeal. After all, a devaluation is seen as nothing more than a price reduction for domestically produced exports, and price reductions are always seen as a means to increase the quantity of goods sold. When it comes to currency devaluation, the analysis is not that simple, however. Even if we use a narrow, Marshallian partial equilibrium model (one consistent with the common man’s economic intuition) to determine the effects of a devaluation, the analysis becomes quite complicated. Contrary to the common man’s conclusion, a devaluation will often result in a reduction of exports and a deterioration in a country’s trade balance and balance of payments. When the models become more general and inclusive, a light shines even more brightly on just how confusing and contradictory the arguments favoring devaluations are. Calls for devaluations, as popular as they might be, are a delusion.
But, without entering the technical weeds of economic analysis, it is clear why a devaluation strategy is a loser’s game. In 1947, the famous Cambridge don Joan Robinson penned “Beggar-My-Neighbor Remedies for Unemployment.” She not only coined the phrase “beggar-my-neighbor,” but concluded that so-called competitive devaluations would be unsuccessful in achieving their advertised objectives. Among other things, Robinson wrote that a devaluation would prompt a retaliation in the form of a competitive devaluation. Thus, the initiator of a currency war could, and would, always be neutralized — checkmate.
The case against devaluations is even stronger than this. In spite of their continued popularity, both economic theory and evidence fail to support them. Let’s take a look at the evidence. Real devaluations are supposed to lead to export booms. Real devaluations occur when the rate of a nominal devaluation exceeds the rate of inflation. To grasp the intuition of this relationship, consider the case in which the rate of inflation is allowed to catch up with the rate of the devaluation. In that case, everything after the devaluation would be exactly the same as before it, except the rate of inflation would be higher.
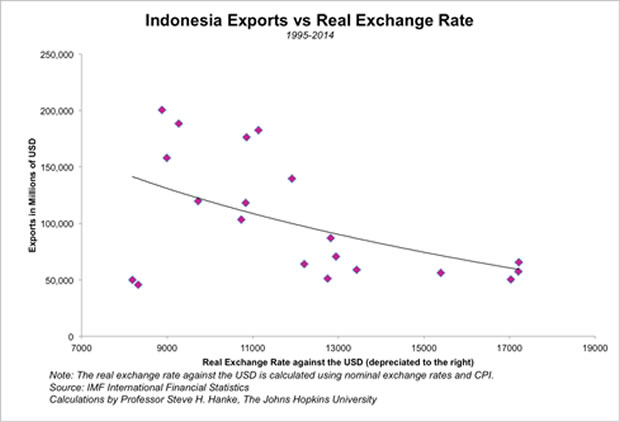
Evidence from Indonesia, for the 1995 – 2014 period, is typical. When the rupiah depreciated in real terms against the U.S. dollar, lower levels of exports were realized. On the other hand, exports were higher when the rupiah appreciated in real terms (see the accompanying chart). This is exactly the opposite of the relationship advertised by those who embrace devaluation strategies. They claim that real devaluations will make exports boom, and that currency appreciations will kill them.
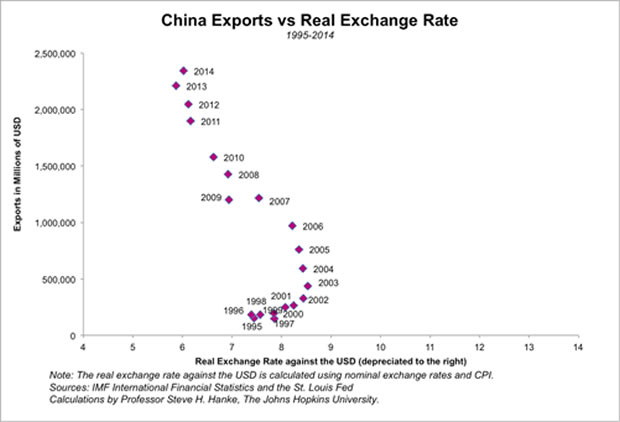
The case of China, like that of Indonesia’s, runs counter to conventional wisdom. China, from 1995 – 2014, is of particular interest and importance because the RMB is at the center of the so-called currency wars. As the accompanying chart shows, the RMB, in real terms, has mildly appreciated against the greenback, and Chinese exports have soared. These data not only poke a hole in the layman’s notions about the wonders of weak currencies, but also illustrate why most politicians are ignorant of the basic facts, and could be successfully prosecuted for false advertising.
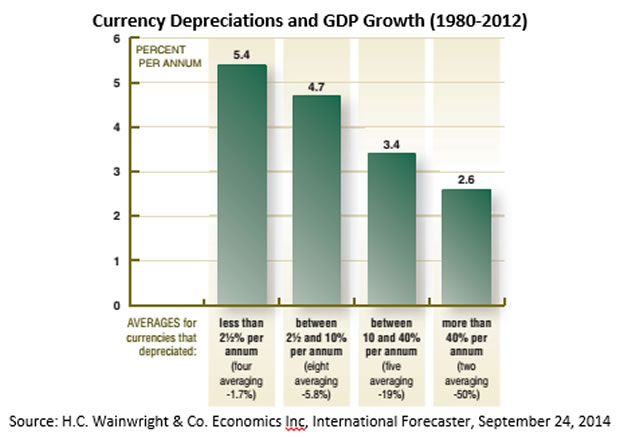
When we move beyond a country’s exports to its GDP, we find the same picture: currency devaluations are associated with slower GDP growth. David Ranson studied the relationship between currency devaluations and GDP growth for nineteen countries in the 1980 – 2012 period. The results are clear: to slow down economic growth, call for a currency devaluation (see the accompanying chart).
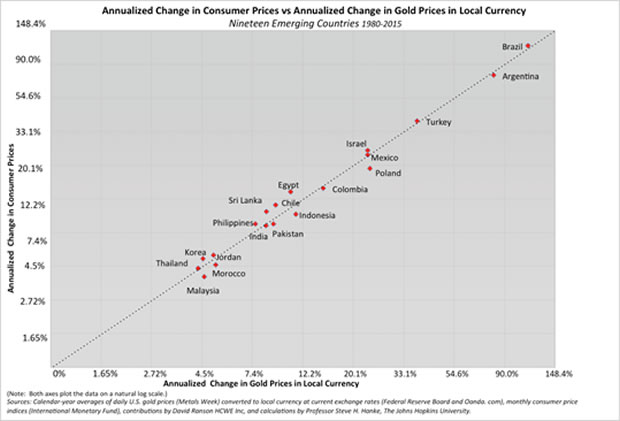
So, if devaluations fail to deliver more trade and higher GDP growth rates, what do they deliver? Well, one thing devaluations deliver is inflation. If we measure the strength of local currencies by the price of gold in those currencies, a virtual one-to-one relationship between the increase in the price of gold in a local currency (a weakening currency value) and a country’s annualized inflation rate exists. The accompanying chart for nineteen developing countries, over the 1980 – 2015 period, shows the tight link between a weaker currency and higher inflation rates.
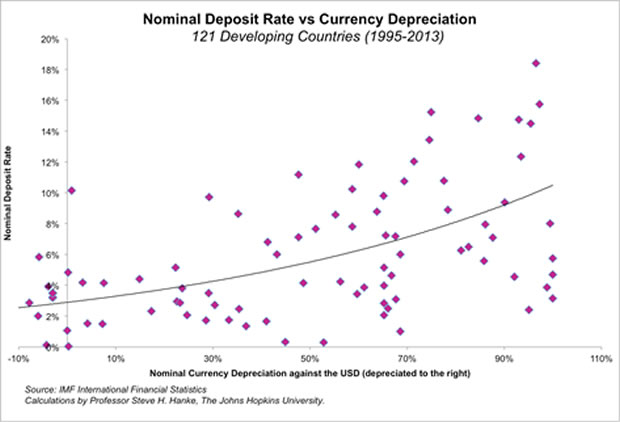
In addition, devaluations deliver higher interest rates, as the accompanying chart illustrates. When developing countries’ currencies are devalued against the U.S. dollar, interest rates in those countries go up. This results because people with assets denominated in currencies that are depreciating demand higher interest rates to compensate for the local currency’s loss in value relative to the U.S. dollar.
The arguments supporting currency devaluations are utterly confused and contradictory supported by neither economic theory nor empirical evidence.
Comments Off on Currency Wars, the Devaluation Delusion
In 2010, Brazil’s Finance Minister, Guido Mantega, coined the phrase “currency war” when he complained about the “cheap” Chinese renminbi (RMB). Mantega claimed this gave China an unfair trade advantage. As he put it to the Financial Times, “we’re in the midst of an international currency war, a general weakening of currency. This threatens us because it takes away our competitiveness.”
That was then. Now the Brazilians are conspicuously silent, because the shoe is on the other foot. The Brazilian real has lost a whopping 25% against the RMB since January 2015. The currency wars continue and are every bit as intense as they were back in 2010, when Mantega coined the phrase.
But, the conventional wisdom about the wonders of weak currencies long predates Mr. Mantega – economists and political leaders have been deceiving the public on the advantages of currency devaluations for centuries
The advertised goal of a devaluation is to increase the price of foreign produced goods and services and decrease the price of domestically produced goods and services. These changes in relative prices are supposed to switch domestic and foreign expenditures away from foreign produced goods and services towards those produced domestically. This is supposed to improve the devaluing country’s international trade balance and balance of payments.
For the public, this argument has a certain intuitive appeal. After all, a devaluation is seen as nothing more than a price reduction for domestically produced exports, and price reductions are always seen as a means to increase the quantity of goods sold. When it comes to currency devaluation, the analysis is not that simple, however. Even if we use a narrow, Marshallian partial equilibrium model (one consistent with the common man’s economic intuition) to determine the effects of a devaluation, the analysis becomes quite complicated. Contrary to the common man’s conclusion, a devaluation will often result in a reduction of exports and a deterioration in a country’s trade balance and balance of payments. When the models become more general and inclusive, a light shines even more brightly on just how confusing and contradictory the arguments favoring devaluations are. Calls for devaluations, as popular as they might be, are a delusion.
But, without entering the technical weeds of economic analysis, it is clear why a devaluation strategy is a loser’s game. In 1947, the famous Cambridge don Joan Robinson penned “Beggar-My-Neighbor Remedies for Unemployment.” She not only coined the phrase “beggar-my-neighbor,” but concluded that so-called competitive devaluations would be unsuccessful in achieving their advertised objectives. Among other things, Robinson wrote that a devaluation would prompt a retaliation in the form of a competitive devaluation. Thus, the initiator of a currency war could, and would, always be neutralized – checkmate.
The case against devaluations is even stronger than this. In spite of their continued popularity, both economic theory and evidence fail to support them. Let’s take a look at the evidence. Real devaluations are supposed to lead to export booms. Real devaluations occur when the rate of a nominal devaluation exceeds the rate of inflation. To grasp the intuition of this relationship, consider the case in which the rate of inflation is allowed to catch up with the rate of the devaluation. In that case, everything after the devaluation would be exactly the same as before it, except the rate of inflation would be higher.
Evidence from Indonesia, for the 1995 – 2014 period, is typical. When the rupiah depreciated in real terms against the U.S. dollar, lower levels of exports were realized. On the other hand, exports were higher when the rupiah appreciated in real terms (see the accompanying chart). This is exactly the opposite of the relationship advertised by those who embrace devaluation strategies. They claim that real devaluations will make exports boom, and that currency appreciations will kill them.
The case of China, like that of Indonesia’s, runs counter to conventional wisdom. China, from 1995 – 2014, is of particular interest and importance because the RMB is at the center of the so-called currency wars. As the accompanying chart shows, the RMB, in real terms, has mildly appreciated against the greenback, and Chinese exports have soared. These data not only poke a hole in the layman’s notions about the wonders of weak currencies, but also illustrate why most politicians are ignorant of the basic facts, and could be successfully prosecuted for false advertising.
When we move beyond a country’s exports to its GDP, we find the same picture: currency devaluations are associated with slower GDP growth. David Ranson studied the relationship between currency devaluations and GDP growth for nineteen countries in the 1980 – 2012 period. The results are clear: to slow down economic growth, call for a currency devaluation (see the accompanying chart).
So, if devaluations fail to deliver more trade and higher GDP growth rates, what do they deliver? Well, one thing devaluations deliver is inflation. If we measure the strength of local currencies by the price of gold in those currencies, a virtual one-to-one relationship between the increase in the price of gold in a local currency (a weakening currency value) and a country’s annualized inflation rate exists. The accompanying chart for nineteen developing countries, over the 1980 – 2015 period, shows the tight link between a weaker currency and higher inflation rates.
In addition, devaluations deliver higher interest rates, as the accompanying chart illustrates. When developing countries’ currencies are devalued against the U.S. dollar, interest rates in those countries go up. This results because people with assets denominated in currencies that are depreciating demand higher interest rates to compensate for the local currency’s loss in value relative to the U.S. dollar.
The arguments supporting currency devaluations are utterly confused and contradictory supported by neither economic theory nor empirical evidence.
Comments Off on Currency Wars, the Devaluation Delusion
The Egyptian pound is plummeting, again, losing 6.1% of its value against the greenback over the past week. As shown in the accompanying chart, the black market premium has soared to 25.2%.
The plunging pound has dramatically pushed up Egypt’s implied annual inflation rate. It now stands at 28.9%. The Egyptian pound might just be General Sisi’s Achilles’ heel.
The currency speculators are restless, again. Many, like George Soros and Kyle Bass, are reportedly taking aim at the Hong Kong dollar (HKD). HKD bear circles think China’s renmimbi (RMB) will lose value against the U.S. dollar (USD) as China’s economy slows down and capital flight from China continues. This, it is asserted, will put pressure on the HKD, and force its devaluation. Thus rendering the fixed rate of 7.8 HKD/USD null and void, and pumping profits into the pockets of those who bet on a devaluation of the HKD.
Like past speculative attacks against the HKD, this will fail and the bears will be forced back into hibernation, suffering large losses. What is fascinating is how so many experienced currency speculators, like George Soros, can be so ill-informed about Hong Kong’s monetary setup. This is far from the first speculative attack on the HKD; the most massive occurred during the Asian Financial Crisis of 1997-98. We cannot forget hedge fund guru Bill Ackerman’s well-advertised “bet the house” attack against the HKD in 2011. It failed badly.
The currency speculators aren’t the only ones ill-informed about Hong-Kong. Financial journalists — even veterans with Hong Kong market experience — clearly don’t understand the currency board system that governs the course of the HKD. For example, Jake van der Kamp, a columnist at the South China Morning Post and former analyst at Morgan Stanley, recently fanned the speculative flames by penning a provocative column titled “From a Currency Board to a Banana Republic Manipulation.” This brought out a response from John Greenwood, the architect of Hong Kong’s currency board system, installed in 1983, and a member of the Currency Board Committee of the Hong Kong Monetary Authority. Greenwood politely took van der Kamp to the woodshed and told him that he didn’t know what he was talking about, and van der Kamp had the good sense to admit that he had sinned.
So, why is there so much confusion about exchange rates — particularly fixed exchange rates delivered by currency board systems, like Hong Kong’s? To answer that question, we must develop a taxonomy of exchange-rate regimes and their characteristics. As shown in the accompanying table, there are three types of regimes: floating, fixed, and pegged.
In fixed and floating rate regimes the monetary authority aims for only one target at a time. Although floating and fixed rates appear dissimilar, they are members of the same free-market family. Both operate without exchange controls and are free-market mechanisms for balance-of-payments adjustments. With a floating rate, a central bank sets a monetary policy, but the exchange rate is on autopilot. In consequence, the monetary base is determined domestically by a central bank. With a fixed rate, there are two possibilities: either a currency board sets the exchange rate and the money supply is on autopilot, or a country is “dollarized” and uses the U.S. dollar, or another foreign currency, as its own and the money supply is again on autopilot.
Under a fixed-rate regime, a country’s monetary base is determined by the balance of payments, which move in a one-to-one correspondence with changes in its foreign reserves. With either a floating or a fixed rate, there cannot be conflicts between monetary and exchange rate policies, and balance-of-payments crises cannot rear their ugly heads. Floating and fixed-rate regimes are inherently equilibrium systems in which market forces act to automatically rebalance financial flows and avert balance-of- payments crises.
Most people use “fixed” and “pegged” as interchangeable or nearly interchangeable terms for exchange rates. In reality, they are very different exchange-rate arrangements. Pegged-rate systems are those in which the monetary authority aims for more than one target at a time. They come in many varieties: crawling pegs, adjustable pegs, bands, managed floats, and more. Pegged systems often employ exchange controls and are not free-market mechanisms for international balance-of-payments adjustments. They are inherently disequilibrium systems, lacking an automatic adjustment mechanism. They require a central bank to manage both the exchange rate and monetary policy. With a pegged rate, the monetary base contains both domestic and foreign components.
Unlike floating and fixed rates, pegged rates invariably result in conflicts between monetary and exchange rate policies. For example, when capital inflows become “excessive” under a pegged system, a central bank often attempts to sterilize the ensuing increase in the foreign component of the monetary base by selling bonds, reducing the domestic component of the base. And when outflows become “excessive,” a central bank often attempts to offset the decrease in the foreign component of the monetary base by buying bonds, increasing the domestic component of the monetary base. Balance-of-payments crises erupt as a central bank begins to offset more and more of the reduction in the foreign component of the monetary base with domestically created base money. When this occurs, it is only a matter of time before currency speculators spot the contradictions between exchange rate and monetary policies and force a devaluation, interest-rate increases, the imposition of exchange controls, or all three.
As the accompanying monetary composition chart makes clear, China’s RMB falls into the pegged regime category. The RMB’s monetary base has foreign and domestic components that move around. In addition, China imposes capital controls. So, the RMB bears might be smelling blood.
That’s not the case with the HKD, which is linked to the USD via a currency board. As such, the board’s monetary base (reserve money) must be backed by foreign reserves — 100%, or slightly more. The accompanying chart shows that this so-called currency board “backing (or ‘stock’) rule” is strictly followed in Hong Kong. The “flow rule” — that reserve money must change in a one-to-one relationship with changes in the currency board’s foreign exchange reserves — is also strictly followed in Hong Kong (see the accompanying chart).
There has never been a system that followed currency board rules — like Hong Kong’s — that has been broken by a speculative attack. And Hong Kong’s will not be the first. Indeed, its currency board is operating exactly as it should, which is why it can’t be broken.
So, what will happen? When the U.S. Fed embraced quantitative easing, USDs flowed into Hong Kong. Now that the Fed has started to notch up the Fed funds rate, the flows have reversed. In consequence, the currency board is automatically tightening up, and both broad money and credit to the private sector are decelerating and are below their trend rates (see the accompanying chart).
This is just what is supposed to happen. We should expect a slow-down in the Hong Kong economy. But, the HKD will remain rock solid.
The Great Recession of 2008-09 brought with it quantitative easing. This, in turn, spawned a cottage industry of books, articles and blog posts about hyperinflation. The burgeoning literature contains a great deal of hype, which validates the 95% Rule: 95% of what is written about economics and finance is either wrong or irrelevant.
The assignment turned out to be much more daunting than I had anticipated. Fortunately, my load was made lighter, because I was assisted by Nicholas Krus.
Our first step was to define hyperinflation. Ever since 1956, when Prof. Phillip Cagan wrote his classic article on hyperinflation, the threshold for hyperinflation in the professional literature has been defined as 50% per month. That was the easy part. Armed with that threshold, we produced The Hanke-Krus Hyperinflation Table. That required a great deal of heavy lifting. We had to locate, document, and verify each hyperinflation episode. All 56 episodes that have ever occurred are represented in the table. While there are many interesting conclusions that can be made by a study of the table, it is worth noting that Germany’s well-known hyperinflation (1923) ranks as only the fifth most virulent. It doesn’t even come close to the world’s top four hyperinflations.
Today there is much musing about Venezuela’s alleged hyperinflation. Even though Venezuela’s annual inflation is the highest in the world (442%), Venezuela is not close to the hyperinflation threshold. Its monthly inflation rate is “only” 21%.
It’s time to halt the hype. Instead, check The Hanke-Krus Hyperinflation Table.
Before we delve into the economic prospects for 2016, let’s take a look at the economies in the Americas, Asia, Europe and the Middle East/Africa to see how they fared in the 2014-15 period. A clear metric for doing this is the misery index. For any country, a misery index score is simply the sum of the unemployment, inflation, and bank lending rates, minus the percentage change in real GDP per capita. A higher misery index score reflects higher levels of “misery.”
For purposes of consistency, I have used data from the Economist Intelligence Unit. Only countries with current data for 2015 are included in the accompanying tables.
A review of these tables indicates a clear rogue’s gallery. It includes the following countries with misery index scores of 40 or above: Venezuela, Brazil, Argentina, Ukraine, and South Africa. The only region not contributing to that gallery is Asia. But, that’s not the end of the story. All countries with scores over 20 are seriously deficient. These countries are ripe for reform.
Turning to 2016, it started with a bang. The world’s major stock markets are volatile and in negative territory. Commodity markets, led by oil, continue to plunge, and so has the value of most emerging market currencies against the U.S. dollar. Combined public and private debt levels relative to GDP have soared, and are well over the ratios that existed during the top of the last credit cycle in 2007. With this debt binge, the level of non-performing loans on banks’ books has soared, too. And if that’s not enough, the Institute of International Finance has just increased its estimate of net capital outflows from emerging markets in 2015 to $735 billion, with $676 billion of capital flight coming from China alone. Talk about a carry trade unwind.
The World Bank and the International Monetary Fund (IMF) have been revising downward their forecasts for global GDP growth. At present, the World Bank forecast for global GDP growth in 2016 is a paltry 2.9 percent, while the IMF’s 2016 forecast of 3.4 percent isn’t much better. It’s becoming clear that the global economy will face headwinds in 2016. It’s no surprise, therefore, that many are in a state of high anxiety and that a spiral of pessimism is developing.
One of the major sources of the storm is ironically what statists and interventionists around the world (read: “The Establishment”) think will save us — namely, big governments. More specifically, the academic literature has dubbed them “Big Players.” While there is a budding and serious academic literature on Big Players, or what could be termed Market Disrupters, there is virtually no mention in the financial press that the Big Players might just bury us. Perhaps this is because the valuable insights provided by the rigorous, and what is at times quite technical, analysis of Big Players is very contra-establishment. Indeed, instead of stabilizing markets, the Big Players disrupt them. They are the purveyors of instability. For those who wish to grapple with the technical literature, I recommend: Roger Koppl. Big Players and the Economic Theory of Expectations. New York: Palgrave Macmillan, 2002.
Big Players have three defining characteristics. Firstly, they are big — big enough to influence markets. Secondly, they are largely insensitive to the discipline of profits and losses — in short, immune from competitive pressures. Thirdly, they act with a large degree of discretion in the sense that their actions are not governed by a prescribed set of rules.
With these characteristics, Big Players are hard to predict. In consequence, they can disrupt. Among other things, they divert entrepreneurial attention away from the assessment of strictly economic market fundamentals — the present value of prospective cash flows and services generated — toward the actions of the Big Players. These are inherently political, and subject to unpredictable change. This reduces the reliability of expectations, with skill becoming devalued and luck counting for more.
The Big Players’ discretionary interventions render most market signals about fundamentals unreliable. They create environments that are ripe for herding and bandwagon effects, as well as noise trading, which is subject to fads and fashions. This explains, in part, why investment groups are spending big bucks to create a thinking, learning, and trading computer — a search for a super-algorithm. Never mind. Big Players increase volatility and create bubbles. They are the disrupters of the universe.
Closely related to the Big Players problem is a strand of innovative analysis pioneered by Robert Higgs of the Independent Institute. It concerns what Higgs calls “regime uncertainty.” Regime uncertainty relates to the likelihood that investors’ private property in their capital and the flows of income and services it yields will be attenuated by government action (read: the discretionary action of Big Players, among other things). As regime uncertainty is elevated, private investment is notched down from where it would have been. This can result in a business-cycle bust and even economic stagnation. For Higgs’ most recent book, which contains evidence on the negative effects of regime uncertainty, I recommend: Robert Higgs. Taking a Stand: Reflections on Life Liberty, and the Economy. Oakland, CA: The Independent Institute, 2015.
The real question is: are Big Players ascending or descending? In gathering data to answer this question, I have become convinced that the Big Players problem is big and getting bigger. Indeed, the problem has become much more pronounced since the onset of the great recession of 2008-2009.
Most central banks possess all the characteristics of Big Players in spades. Since the advent and implementation of quantitative easing (QE), they have become bigger players, with the state money they produce making up a much greater portion of broad money (state, plus bank money) than before 2009. Not only have their balance sheets exploded, but the composition of some of their balance sheets has changed in surprising ways. It used to be that central bank assets were solely comprised of domestic and foreign government bonds. Well, now you can find corporate bonds on some central bank balance sheets. And that’s not all. Central banks use their discretion to purchase equities, too. Just take a look at the Swiss National Bank (SNB), one of the alleged paragons of conservative central banking. By late last year (Q3), the total value of stocks held by the SNB had risen to $38.95 billion. That’s the size of some of the largest hedge funds in the world, and amounts to over 5 percent of Switzerland’s GDP.
The Bank of Japan (BoJ) is also openly a big buyer of stocks — namely, Japanese ETFs. The BoJ is authorized to purchase roughly $25 billion of ETFs per year, and the government leans on the BoJ to use its fire power — especially when the Japanese stock markets are “weak.”
Less surprising is the stock-buying propensity of the People’s Bank of China (PBoC). It has thrown hundreds of billions of yuan into purchasing publically listed Chinese shares in a bid to stave off multiple stock market crashes. And, when it comes to Chinese markets, the PBoC is not alone. When Beijing cracks the whip, the “national team” — a group of state-owned banks, brokers, pension funds, government agencies, and you name it — either buy or sell. Much of the same goes on in Russia and elsewhere, but in those places the scope and scale of the Big Player phenomenon is no match for that of the Middle Kingdom.
Right behind central banks are sovereign-wealth funds (SWFs). With over $7 trillion in assets, they are huge. But, transparency (read: disclosure rules) with regard to size, holdings and strategies is limited. About all we know is that when the SWFs’ political masters command, the SWF technocrats march.
Then there are traditional state-owned enterprises (SOEs). While the wave of privatizations that started in the late 1970s put a dent in the SOEs, they remain Big Players in many countries. And, when compared to similar private enterprises, their actions are more unpredictable and their performance is dismal. Sales per employee are lower for SOEs. Adjusted profits per employee are lower. Per dollar of sales, operating expenses plus wages are higher. Sales per dollar investment are lower. Profits per dollar of total assets are lower. Profits per dollar sales are lower. Sales per employee grow at a slower rate. And, with the exception of state-owned oil companies, who often have considerable monopoly power, most traditional SOEs generate accounting losses.
But, traditional SOEs are only the tip of the iceberg. State capitalism — a model in which governments pick winners and use capitalist tools such as listing SOEs on stock markets — is on the rise. With state capitalism, the visible hand of the State replaces Adam Smith’s invisible hand of the markets. State capitalism runs the gamut from public-private partnerships to SOEs, and highlights the relevance of the Big Player problem. For a review of State Capitalism, I recommend the special report on that topic, which was published in the 21 January 2012 issue of The Economist. A review of that edifying report will convince the reader that the Big Player problem lurks everywhere.
Going forward, we will clearly face headwinds created by Big Players and regime uncertainty.
Comments Off on Economic Headwinds: Big Players, Regime Uncertainty and the Misery Index
Surprise! Venezuela, the world’s most miserable country (according to my misery index) has just released an annualized inflation estimate for the quarter that ended September 2015. This is late on two counts. First, it has been nine months since the last estimate was released. Second, September 2015 is not January 2016. So, the newly released inflation estimate of 141.5% is out of date.
I estimate that the current implied annual inflation rate in Venezuela is 392%. That’s almost three times higher than the latest official estimate.
Venezuela’s notoriously incompetent central bank is producing lying statistics – just like the Soviets used to fabricate. In the Soviet days, we approximated reality by developing lie coefficients. We would apply these coefficients to the official data in an attempt to reach reality. The formula is: (official data) X (lie coefficient) = reality estimate. At present, the lie coefficient for the Central Bank of Venezuela’s official inflation estimate is 3.0.
Stagnationists have been around for centuries. They have embraced many economic theories about what causes economic stagnation. That’s a situation in which total output, or output per capita, is constant, falling slightly, or rising sluggishly. Stagnation can also be characterized by a situation in which unemployment is chronic and growing.
Before we delve into the secular stagnation debate — a debate that has become a hot topic — a few words about current economic developments in the U.S. are in order. What was recently noticed was the Federal Reserve’s increase, for the first time in nearly a decade, of the fed funds interest rate by 0.25 percent. What went unnoticed, but was perhaps more important, was that the money supply, broadly measured by the Center for Financial Stability’s Divisia M4, jumped to a 4.6 percent year-over-year growth rate. This was the largest increase since May 2013.
Since changes in the money supply, broadly determined, cause changes in nominal GDP, which contain real and inflation components, we can anticipate a pick-up in nominal aggregate demand in the U.S. Indeed, if M4 keeps growing at its current rate, nominal aggregate demand, measured by final sales to domestic purchasers, will probably reach its long-run average annual rate of 4.8 percent by mid-2016 (see the accompanying chart). This rate of nominal aggregate demand growth was last reached in 2006, almost ten years ago. So, the current economic news from the U.S. is encouraging.
But what about the secular stagnation debate? The secular stagnation thesis in a Keynesian form was popularized by Harvard University economist Alvin Hansen. In his presidential address to the American Economic Association in 1938, he asserted that the U.S. was a mature economy that was stuck in a rut that it could not escape from. Hansen reasoned that technological innovations had come to an end; that the great American frontier (read: natural resources) was closed; and that population growth was stagnating. So, according to Hansen, investment opportunities would be scarce, and there would be nothing ahead except secular economic stagnation; unless, fiscal policy was used to boost investment via public works projects.
Hansen’s economics were taken apart and discredited by many non-Keynesian economists. But, the scholarly death blow was dealt by George Terborgh in his 1945 classic The Bogey of Economic Maturity. In the real world, talk of stagnation in the U.S. ended abruptly with the post-World War II boom.
Secular stagnation in the U.S. is nothing more than a phony rationale for more government waste.
It is worth noting that many Keynesians were caught up, at least temporarily, in the secular stagnation fad. Even Paul Samuelson, a leader of the Keynesians — thanks, in part, to his popular textbook — was temporarily entrapped. But, like Houdini, he miraculously escaped. That said, there were things in Economics that Samuelson probably wished he had thrown overboard, too. My favorite from the 13th edition (1989) is: “The Soviet economy is proof that contrary to what many sceptics had earlier believed, a socialist command economy can function and even thrive.”
Today, another Harvard University economist, Larry Summers, is beating the drums for secular stagnation. And Summers isn’t just any Harvard economist. He was formerly the president of Harvard and a U.S. Treasury Secretary. Summers, like Hansen before him, argues that the government must step up to the plate and invest more to fill the gap left by deficiencies in private investment, so that the economy can be pulled out of its stagnation rut. He is preaching the stagnation gospel beyond the ivy-covered halls at Harvard. And, he is picking up followers. For example, Canada’s new Prime Minister, Justin Trudeau, has latched onto Summers and the stagnation thesis. What better way to justify expanding government investments, or should we say white elephants?
For evidence to support Summers’ secular stagnation argument and his calls for more government investment, he points to the anemic private domestic capital expenditures in the U.S. As the accompanying chart shows, gross private domestic business investment, which does not include residential housing investment, has rebounded modestly since the great recession. But, most of this gross investment has been eaten up in the course of replacing capital that has been used up or became obsolete. Indeed, the private capital consumption allowances shown in the chart are huge. While these capital consumption figures are approximate, they are large enough to suggest that there is little left for net private business investment. This means that the total capital stock, after actually shrinking in 2009, has grown very little since then.
If we take a longer look, one starting in 1960, it appears that net private domestic investment as a percent of GDP has trended downward (see the accompanying chart). This is due to the fact that private capital consumption allowances as a percentage of GDP have trended upward. This shouldn’t surprise us. With the increasingly rapid rate of innovation, obsolescence and, therefore, capital consumption have increased. On the surface, these facts appear to give the stagnationists a reed to lean on. But, it’s a weak one.
To understand the troubling net investment picture, we must ask why businesses are so reluctant to invest. After all, it’s investment that fuels productivity and real economic growth. Are the stagnationists on to something? Have we really run out of attractive investment opportunities that require the government to step in and fill the void?
A recent book by Robert Higgs, Taking a Stand: Reflections on Life, Liberty, and the Economy, helps answer these questions. In 1997, Higgs first introduced the concept of “regime uncertainty” to explain the extraordinary duration of the Great Depression of the 1930s. Higgs’ regime uncertainty is, in short, uncertainty about the course of economic policy — the rules of the game concerning taxes and regulations, for example. These rules of the game affect the net benefits and free cash flows investors derived from their property. Indeed, the rules affect the security of their property rights. So, when the degree of regime uncertainty increases, investors’ risk-adjusted discount rates increase and their appetites for making investments diminish.
Since the Great Recession of 2009, regime uncertainty has been elevated. This has been measured by Scott R. Baker of Northwestern University, Nicholas Bloom of Stanford University and Steven J. Davis of the University of Chicago. Their “Economic Policy Uncertainty Index for the U.S.,” which was published by the Cato Institute in Washington, D.C., measures, in one index number, Higgs’ regime uncertainty. In addition, there is a mountain of other evidence that confirms the ratcheting up of regime uncertainty during the tenure of the George W. Bush and Barack Obama administrations. For example, a recent Pew Research Center survey finds that the percent of the public that trusts Washington, D.C. to do the right thing has fallen to all-time lows of around 20 percent.
So, contrary to the stagnationists’ assertions, the government is the problem, not the solution. Secular stagnation in the U.S. is just what it was when Alvin Hansen popularized it in the 1930s: Its bunk. Nothing more than a phony rationale for more government waste.
Many were surprised when NATO defied Moscow and invited Montenegro to join the military alliance. Some, like the New York Times went so far as to assert that the tiny Balkan state was of “no strategic significance.” What nonsense. The Sage of Baltimore, H.L. Mencken, writing in the June 1934 issue of The Seven Seas after a visit to Montenegro, reminds his readers of just how strategic Montenegro has been over the centuries. “It has been, in its time, Roman, Venetian, Turkish, Spanish, Serbian, Hungarian, Bulgarian, Russian, French, English and Austrian, and all the while it was really Montenegran.”
Members of the NYT editorial board, as well as many others in the press, clearly know little of Montenegro’s history — an oversight that can be corrected by a study of Elizabeth Roberts’ Realm of the Black Mountain: A History of Montenegro (2007). A field trip to the Adriatic deep-water part of bar would be edifying for any strategist, too. Never mind.
As for me, Montenegro’s march to NATO was no surprise. Indeed, I was part of the march, when it started back in 1999. At that time, I was a State Counselor to Montenegro and advisor to President Milo Djukanovic, a position I held until 2003. Yes, he is the same Milo Djukanovic who has led the march since day one and is still president.
Back in 1999, Montenegro was still part of the rump Yugoslavia. In that year, NATO actually bombed Yugoslav forces in Montenegro. But, there was trouble in paradise. Djukanovic was tired of laboring under Slobodan Milosevic’s yoke. And many Montenegrins were fed up with the economic madness that Milosevic was dishing out from Belgrade. Just recall Milosevic’s great hyperinflation, which started in January 1992. It peaked in January 1994, when the official monthly inflation rate was 313 million percent. For some color, consider that the worst month of Weimar Germany’s 1922-23 hyperinflation saw prices go up by only 32,400 percent. The Yugoslav hyperinflation was devastating. Long before NATO struck Belgrade in 1999, Milosevic’s monetary madness had destroyed the Yugoslav economy.
From the first time I met Djukanovic in 1999, it was clear that he envisioned Montenegro’s secession from the rump Yugoslavia and a march toward the European Union and NATO. But, how would he make the break and start the march? That’s where I came into the picture. The Yugoslav dinar was Milosevic’s Achilles’ heel, and Djukanovic knew it. For more on the history on Montenegro’s marches, Norman Davies’ Vanished Kingdom: The Rise and Fall of States and Nations (2013) is a most edifying read.
With Zeljko Bogetic, I wrote a book, Cronogroska Marka (1999). It laid out the modalities for Montenegro to dump the Yugoslav dinar, which would be the first step in the march. As soon as this book hit the streets and I was appointed as State Counselor and Djukanovic’s advisor, I became one of Milosevic’s marked men. The official accusations that swirled in Belgrade claimed that I was, among other things, the head of a group that was trying to destabilize Serbia by unloading counterfeit dinars into the economy.
The German mark was the unofficial coin of the realm throughout the rump Yugoslavia. We knew that the German mark was Djukanovic’s trump card. If Montenegro officially adopted the mark, it would not only stabilize the economy, but also pave the way for reestablishing Montenegro’s sovereignty. On November 2, 1999, Djukanovic boldly announced that Montenegro was officially adopting the German mark as its national currency. This was Montenegro’s first secession step — a step that was eventually supported by the United States and its allies. On November 4th, I, with the help of Senators Steve Symms and Trent Lott, arranged a meeting at the U.S. Capitol in which Djukanovic and I made a case for Montenegro’s currency reform and the start of the march. The members of congress in attendance – Trent Lott, Steve Symms, Richard Lugar, John Warner, Harry Reid, Larry Craig, Kay Bailey Hutchison, among others – warmly received our message.
It was the German mark then. Today, it’s NATO. No surprise. That’s where Djukanovic told the assembled, on November 4, 1999, he was headed.
Money matters — it’s one of Milton Friedman’s maxims that I repeat often in my columns. Since the Northern Rock bank run of 2007 — the “opening shot” of the financial crisis — the money supply, broadly measured, in the United States, Great Britain, and the Eurozone has taken a beating.
Recently, in the United States, money supply growth has started to rebound somewhat. This is a positive sign, because the quantity of money and nominal gross domestic product (GDP), as well as related measures of aggregate demand, are all closely related. Indeed, if broad money growth is robust, the nominal GDP, which is composed of real and inflation components, will be robust and vice versa.
When it comes to measuring the money supply, we must heed the words of Sir John Hicks, a Nobelist and high priest of economic theory: There is nothing more important than a balance sheet.
Components of the money supply appear on a bank’s balance sheet as liabilities. The money supply is simply the sum all of the deposits and various other short-term liabilities of the financial sector. On every balance sheet, the sum total of assets must equal total liabilities. In consequence, the money supply (short-term liabilities) must have either an asset or longer-term liability counterpart on the balance sheet (see the accompanying chart).
One of these counterparts is known as credit, and it includes various financial instruments, such as private loans, mortgages, etc. Money and credit are often confused as synonyms, but they are not the same thing — credit is a counterpart to money. Any economist worth his salt should have the money supply on his dashboard. But, it is also important to look at what the financial sector is doing with these deposits — are they lending this money back out to the economy, and if so, to whom? There is one very important counterpart of the money supply that is particularly worth looking at — loans to private individuals and businesses, known as “private credit.”
In the U.S., movements in the money supply (Divisia M4) and private credit tend to move in the same direction. Since 2013, the year-over-year growth rate of the money supply, broadly measured, has started to increase (see the accompanying chart).
Indeed, the Divisia M4 annual growth rate almost reached its trend rate of growth (4.39 percent) in August of this year. But, it has subsequently slipped back to a 3.4 percent annual rate.
During this period of modest acceleration in Divisia M4 growth, the growth rate in private credit has strongly accelerated and is now comfortably above its trend rate of growth (6.58 percent). So, money and credit growth look rather promising. After all, they are precursors of nominal aggregate demand growth.
This linkage between the growth rate in broad money (Divisia M4) and nominal aggregate demand (measured by the proxy final sales to domestic purchasers) can be observed in the accompanying chart. The interesting aspect of the chart is that it confirms that the U.S. is still in a growth recession — the U.S. is growing, but growing at below its trend rate when measured by final sales to domestic purchasers (2.62 percent versus 4.85 percent). This has resulted, in part, because broad money growth has been anemic, even though it has picked up the pace recently.
For many, the idea of anemic money growth sounds strange. After all, the Fed turned on the money pumps in the wake of the 2008 crisis (read: engaged in quantitative easing). But, the Fed only directly controls what is known as state money, also known as the monetary base, which includes currency in circulation and bank reserves with the Fed. The vast majority of the money supply, properly measured, using a broad metric, is what is known as bank money. This is money produced by the private banking sector via deposit creation, and it includes liquid, money-like assets such as demand deposit and savings deposits.
The Fed has indeed been quite loose when it comes to state money, with the state money portion of the total money supply, measured by M4, increasing from 5 percent of the total before the crisis, to 21 percent today. But where does the lion’s share of broad money (the other 79 percent of the money supply) come from, if not from the central bank? It comes from commercial banks. And that is where financial regulation comes into the picture.
For some time, I have warned that higher bank capital requirements, when imposed in the middle of an economic slump, are wrong-headed (read: pro-cyclical) because they put a squeeze on the money supply and stifle economic growth. Thus far, the result of efforts to impose these capital requirements has been financial repression — a credit crunch. This has proven to be a deadly cocktail to ingest in the middle of a slump.
In the aftermath of the financial crisis, politicians, regulators, and central bankers around the world have pointed their accusatory fingers at commercial bankers. They assert that the keys to preventing future crises are tougher regulations and more aggressive supervision, centered around higher capital requirements for banks.
This would be fine if higher capital requirements were being imposed during an economic boom, because capital hikes cause money supply growth to slow, which tends to cool down the economy. But, when capital hikes are imposed during a slump or a growth recession, they become pro-cyclical and actually make things worse. Indeed, the imposition of higher capital requirements in the wake of the financial crisis has caused banks to shrink their loan books and dramatically increase their cash and government securities positions.
For a bank, its assets (cash, loans and securities) must equal its liabilities (capital, bonds and liabilities which the bank owes to its shareholders and customers). In most countries, the bulk of a bank’s liabilities (roughly 90 percent) are deposits. Since deposits can be used to make payments, they are “money.” Accordingly, most bank liabilities are money.
To increase their capital-asset ratios, banks can either boost capital or shrink risk assets. If banks shrink their risk assets, their deposit liabilities will decline. In consequence, money balances will be destroyed.
The other way to increase a bank’s capital-asset ratio is by raising new capital. This, too, destroys money. When an investor purchases newly-issued bank equity, the investor exchanges funds from a bank account for new shares. This reduces deposit liabilities in the banking system and wipes out money.
So, paradoxically, the drive to deleverage banks and to shrink their balance sheets, in the name of making banks safer, destroys money balances. This, in turn, dents company liquidity and asset prices. It also reduces spending relative to where it would have been without higher capital-asset ratios.
The United States has employed a loose state money/tight bank money monetary policy mix. Yes, for all the talk of quantitative easing and Fed’s loose monetary policy, the inconvenient truth is that the overall money supply in the U.S., broadly measured, is still, on balance, quite tight — thanks in large part to ill-timed bank capital hikes.
But, this isn’t the bank regulators last act. In mid-November, the Basel Committee on Bank Supervision, which sets worldwide standards, surprised the banking community by indicating that banks would have to dramatically increase the amount of capital they hold as a buffer against adverse market moves. At about the same time, the Fed rolled out new regulations to bolster the large banks’ “total loss-absorbing capacity” (read: increase their capital-asset ratios). All this increased capital is advertised as something that is needed to make banks safer and protect taxpayers from footing the bill for bank bailouts. This could well prove to be false advertising, because the increased mandates for more bank capital will slow the growth of money and credit, which will also slow nominal GDP growth — relative to where it would have been.
Comments Off on Bank Regulations Continue to Hinder the U.S. Recovery
In September, Pope Francis visited the United States, where he addressed the U.S. Congress. His address, while nuanced, hit on social justice themes. The Pope’s remarks were well received by left-of-center politicians who embrace progressive policies. When the Pope left the U.S., he traveled to Latin America, where he spoke in his native Spanish and was more direct. While in Bolivia, Pope Francis had this to say: “Let us not be afraid to say it: we want change, real change, structural change,” the Pope said, decrying a system that “has imposed the mentality of profit at any price, with no concern for social exclusion or the destruction of nature.”
“Has the spread of free markets improved people’s lives?”
Pope Francis’ rhetoric inspired the anti-free market forces in Bolivia, and elsewhere. They believe that the goals of social justice and poverty reduction can best be achieved by collective efforts, not by free markets.
Pope Francis raises an important question. Has the spread of free markets improved people’s lives?
Interestingly, the recipient of the 2015 Nobel Prize in economics, Angus Deaton, answers that question. Indeed, Deaton’s 2013 book, The Great Escape: Health, Wealth, and the Origins of Inequality, opens with: “Life is better now than at almost any time in history.”
Deaton’s conclusion was echoed in an edifying essay, “The Age of Milton Friedman,” penned by Harvard economist Andrei Shleifer in 2009. In that essay, Shleifer observed that, from about 1980, the world had embraced the free markets that Nobelist Friedman had championed. Shleifer also indicated that living standards had risen sharply, poverty had declined dramatically, while life expectancy had increased. Shleifer asked whether the spread of free markets accounted for the improvements, and he answered with a resounding, “Yes.” With a series of charts, Shleifer let the data talk. In what follows, I do the same.
The best elixir to address the concerns of Pope Francis and other progressives is more free markets, not fewer. Just look at the pictures. As the saying goes, they are worth a thousand words.
Comments Off on Pictures for the Pope and progressives
The rupiah is plumbing the depths it last visited in 1998 during the Asian financial crisis. The accompanying chart of the rupiah’s value against the U.S. dollar tells the tale. Although the rupiah’s recent plunge is not as dramatic as the postJuly 1997 float of the rupiah, it is ugly nevertheless.
To put the picture into perspective, it is edifying to look at the rupiah’s sad history since 1949 (See the accompanying table).
When the Dutch recognized an independent Indonesia in 1949, one rupiah was equal to one Dutch guilder, whose value was 3.8 per U.S. dollar. In December 1965, the rupiah was redenominated at a rate of 1,000 old rupiahs to one new rupiah (today’s unit). Since independence, and in terms of the original rupiah, there has been a depreciation in the exchange rate from 3.8 per dollar to approximately fourteen million per dollar. That amounts to a depreciation against the dollar of almost 3.7 million times. With those kinds of numbers, it’s not surprising that the rupiah has been one of the worst performing currencies in Asia over the past 50 years.
“Although the rupiah’s recent plunge is not as dramatic as the post-July 1997 float of the rupiah, it is ugly nevertheless.”
In an attempt to stop the rupiah’s fall, Jakarta’s plunge protection team has swung into action with a wrongheaded law that would ban the use of foreign currencies for local transactions. No more price quotes for hotel rooms in U.S. dollars. The same will be the case for office units in Jakarta, which have been primarily paid for in U.S. dollars. This is yet another case in which President Joko Widodo claims he wants to do the “right thing,” but reaches for the wrong policy lever.
Instead of banning the use of foreign currencies, Indonesia should encourage currency competition, rather than trying to protect the Bank of Indonesia (BI). Indeed, what the BI needs is a good dose of competition and the ensuing monetary discipline. After all, if there was a real competitive currency regime in which Indonesians were free to use any currency they wished, they could (and would) switch out of the rupiah into a foreign currency, when the BI misbehaves. Currency competition would do wonders for Indonesia by disciplining the BI and encouraging sound monetary policies, which would result in a stable rupiah.
Peru offers an example of a successful competitive currency regime. In fact, Peru has a parallel currency system. For a decade and a half Peruvians have been allowed to hold and use two currencies: either the Peruvian sol or the U.S. dollar. Peruvians are free to buy and sell, to deposit and lend, to save and invest, at home and abroad, in either currency. The exchange rate between the sol and the greenback is freely floating and there are no restrictions on convertibility. This system puts a harsh discipline on the Central Reserve Bank of Peru. In consequence, the central bank performs. Over the past decade the annual inflation rate in sols has averaged 2.5% and Peru’s annual real growth rate has averaged 6.5%.
However, the rupiah isn’t the only economic problem facing President Jokowi. Indonesia is in need of major economic reforms to boost competition in the real economy, to remove red tape, to reduce corruption, and to enhance growth. Let’s look at the metrics. Yes. Metrics which serve as proxies for economic freedom have been developed and are widely used. For example, The Heritage Foundation and The Wall Street Journal jointly publish an annual volume, The Index of Economic Freedom, which now incorporates 178 countries. The Economic Freedom of the World, which includes 157 countries, is published jointly by the Fraser Institute and the Cato Institute. And the World Bank issues an annual, Doing Business Report, which deals with the ease of doing business in 189 countries. Data from these annuals on economic freedom show that there is a strong positive linkage between measures of economic freedom and economic growth.
To improve a country’s economic freedom score, and thus ratchet up its economic growth rate, governments must make credible commitments to implement liberal economic reform programs. A commitment is made more credible the more one binds oneself to the achievement of an objective. At the extreme, when a commander on the battlefield orders his troops to burn all bridges behind them to cut off all avenues of retreat, his enemies will be confident that his intentions are to fight to the last man.
A credible commitment is something that many politicians are reluctant to entertain. That said, there have been numerous cases in which politicians have made credible commitments to adopt liberal economic policies. These have resulted in dramatic increases in economic freedom and prosperity, regardless of the type of political regime or stripe of the political party that embraced reforms.
Singapore, for example, gained its independence in 1965 when it was expelled from a two-year federation with Malaysia. At that time, Singapore was backward and poor — a barren speck on the map in a dangerous part of the world. Its population was made up of a diverse group of immigrants with a history of communal tensions. However, Singapore had a leader with clear ideas on how to modernize the country
Lee Kuan Yew ruled out passing the begging bowl and accepting foreign assistance of any kind. Instead, he embraced stable money and first-world competition. Stable money was initially achieved with a currency board. Competition was attained by light taxation, minimal regulation of business and free trade. In addition, Lee Kuan Yew insisted on personal security, public order and the protection of private property. To accomplish his objectives, his central principle for organizing a “small” government was to run a tight ship with no waste or corruption. To implement that principle, he appointed only first-class civil servants and paid them first-class wages.
Today, Singapore is one of the freest, most flexible and prosperous economies in the world. Hong Kong too, along with Singapore, ranks as one of the world’s freest economies. When we move down — way down — on the economic freedom rankings, we find Indonesia.
The accompanying table shows the rankings by the three economic freedom metrics for the year 2000 and the most recent year reported. What is striking about Indonesia is not only its low ranking, indicating the need for reform, but the fact that there hasn’t been noticeable improvement since 2000.
To enhance economic freedom, Indonesia has its work cut out. It will not only have to deliver on President Joko Widodo’s recently proposed plan to simplify or remove 89 regulations that hinder business, but it will have to do something big and visionary — like Lee Kuan Yew did in Singapore. Something that would lift Indonesia’s respectable growth rates, stabilize the plunging rupiah and reduce its crippling inflation (see the accompanying tables).
The fog of war has removed any sense of certainty regarding developments on the Syrian battlefield. That said, we know that ISIS has captured several towns, and that waves of Syrian refugees are disembarking upon Europe’s shores. But, the picture remains chaotic and hazy.
However, there is one objective indicator of reality in Syria. It is the Syrian pound’s black-market (read: free-market) exchange rate. The Johns Hopkins-Cato Institute Troubled Currencies Project (TCP) tracks and reports this important indicator on a daily basis. With the exception of a plunge in June 2013, the Syrian pound has witnessed an orderly, not chaotic, deterioration.
From Syria’s black-market exchange, standard economic theory and reliable empirical techniques allow us to produce accurate inflation estimates. Indeed, with the free market exchange-rate data (usually black-market data) reported by the TCP, the inflation rate can be calculated. The principle of purchasing power parity (PPP), which links changes in exchange rates and changes in prices, allows for a reliable inflation estimate, when inflation rates are elevated. To calculate the inflation rate in Syria, all that is required is a rather straightforward application of a standard, time-tested economic theory (read:PPP).
Despite the chaotic battlefield situation, the Syrian economy is, well, less chaotic. It is experiencing a slow and uneventful deterioration. That’s clear. As the charts depict below, both annual and monthly implied inflation rates have been rather stable, aside from the June 2013 hyperinflation scare.
With Russia’s recent ramp-up in Syria, it will be worth paying particular attention to the SYD/USD black-market exchange rate. If the pound stabilizes, or strengthens, we will know that the presence of Russia, from the al-Assad government’s point of view, is paying dividends.
Comments Off on On an objective indicator of the state of play in Syria
The plunging Shanghai Stock Exchange and the sudden reversal in the yuan’s appreciation have caused fears to spread beyond China’s borders. Is something wrong with the world’s growth locomotive? In a word, yes.
The most reliable approach for the determination of nominal gross domestic product (GDP) and the balance of payments is the monetary approach. Indeed, the path of an economy’s nominal GDP is determined by the course of its money supply (broadly determined).
The accompanying chart of China’s money supply and private credit tells us why China’s economy is in trouble. The annual trend rate of money supply (M2) growth is 17.1%. In early 2012, M2 was growing at an annual rate of 20% — well above the trend rate. Then, M2’s annual growth rate suddenly plunged to 15% and has been drifting down ever since.
Today, the annual M2 growth rate is a bit above 10%. In consequence, nominal GDP will decline from its current level. This spells trouble for China, and the rest of the world. These prospective troubles are already baked in the cake.
Just why has the M2 annual growth rate declined? One factor behind the decline has been recent hot money capital flight. This shows up when we decompose the reserve money (state money) produced by the People’s Bank of China. The foreign exchange contribution to state money is no longer pulling the rate of state money up. It is pulling it down (see the accompanying monetary composition chart).
How did China arrive at this point — a point of high uncertainty and potential economic instability? A look at China’s exchange-rate regimes provides a window into these troubled waters. Since China embraced Deng Xiaoping’s reforms on 22 December 1978, China has experimented with different exchange-rate regimes. Until 1994, the yuan was in an ever-depreciating phase against the U.S. dollar. Relative volatile readings for China’s GDP growth and inflation rate were encountered during this phase.
After the maxi yuan depreciation of 1994 and until 2005, exchange-rate fixity was the order of the day, with little movement in the CNY/USD rate. In consequence, the volatility of China’s GDP and inflation rate declined, and with the yuan firmly anchored to the U.S. dollar, China’s inflation rates began to shadow those in America (see the accompanying exchange-rate table). Then, China entered a gradual yuan appreciation phase (when the CNY/ USD rate declined in the 2005-14 period). In terms of volatility, economic growth and inflation rates, China’s performance has deteriorated ever since it dropped exchange-rate fixity. This ever-appreciating yuan vis-á-vis the U.S. dollar phase appears to have ended this August, with a small yuan depreciation.
So, why did China drop exchange-rate fixity in 2005? After all, China’s fixed-rate regime had performed very well. Pressure from the U.S. and many nonsensical mercantilist’s arguments caused China to abandon fixity in 2005.
The wrong-headed thinking in Washington is that exchange-rate flexibility in China would result in an ever-appreciating yuan against the greenback. Forget all the talk about the glories of a market-determined, flexible exchange-rate. That rhetoric is just a cover for Washington’s real agenda: an ever-appreciating yuan.
The United States has recorded a trade deficit in each year since 1975. This is not surprising because savings in the U.S. have been less than investment. The trade deficit can be reduced by some combination of lower government consumption, lower private consumption or lower private domestic investment. But, you wouldn’t know it from listening to the rhetoric coming out of Washington.
This is unfortunate. A reduction of the trade deficit should not even be a primary objective of federal policy. Never mind. Washington seems to thrive on counter-productive trade and currency wars that damage both the U.S. and its trading partners.
From the early 1970s until 1995, Japan was an enemy. The mercantilists in Washington asserted that unfair Japanese trading practices caused the U.S. trade deficit and that the U.S. bilateral trade deficit with Japan could be reduced if the yen appreciated against the dollar — a weak dollar policy. Washington even tried to convince Tokyo that an ever-appreciating yen would be good for Japan. Unfortunately, the Japanese complied and the yen appreciated, moving from 360 to the greenback in 1971 to 80 in 1995.
In April 1995, Secretary of the Treasury Robert Rubin belatedly realized that the yen’s great appreciation was causing the Japanese economy to sink into a deflationary quagmire. In consequence, the U.S. stopped arm-twisting the Japanese government about the value of the yen and Secretary Rubin began to evoke his now-famous strong-dollar mantra. But, while this policy switch was welcomed, it was too late. Even today, Japan continues to suffer from the mess created by the yen’s appreciation. As Japan’s economy stagnated, its contribution to the increasing U.S. trade deficit declined, falling from its 1991 peak of almost 60% to 9% in 2014. While Japan’s contribution declined, China’s surged from slightly more than 9% in 1990 to 47% in 2014. With these trends, the Chinese yuan replaced the Japanese yen as the mercantilists’ whipping boy.
Interestingly, the combined Japanese-Chinese contribution has actually declined from its 1991 peak of over 70% to only about 56% in 2014. This hasn’t stopped the mercantilists from claiming that the Chinese yuan is grossly undervalued, and that this creates unfair Chinese competition and a U.S. bilateral trade deficit with China.
This raises an obvious question: does a weak yen or yuan vis-á-vis the dollar (in nominal terms) explain the contribution of Japan and China to the U.S. trade deficit? After all, this exchange-rate argument (read: competitive advantage) is what the mercantilists use to wage war. When it comes to Japan, whose contribution to the U.S. trade deficit has been declining for the past twenty years, there is a very weak relationship between the yen’s strength and Japan’s contribution to the trade deficit. Certainly not something worth going to war over. And as for China, the relationship between the strength of the yuan and China’s contribution to the U.S. trade deficit contradicts the mercantilist conjecture. Indeed, the Chinese yuan has appreciated in nominal terms relative to the greenback over the past twenty years, and so has the Chinese contribution to the U.S. trade deficit.
It isn’t only the mercantilists’ pols who don’t understand that nominal exchange rates don’t have much to do with trade deficits. Some economists — most notably C. Fred Bergsten of the Peterson Institute for International Economics and supply-side guru Arthur B. Laffer — don’t seem to understand the economics behind the U.S. trade deficit, which has been with us since 1975. Those economics were fully explained by one of my occasional collaborators, the late Ronald I. McKinnon from Stanford University. Indeed, he elaborated on them in his last book, The Unloved Dollar Standard: From Bretton Woods to the Rise of China (2013). In short, the U.S. trade deficit is the result of a U.S. savings deficiency, not exchange rates. As a result, the trade deficit can be reduced by some combination of lower government consumption, lower private consumption or lower private domestic investment. You wouldn’t know this basic truth by listening to the rhetoric coming out of Washington.
What should China do? First, Beijing should stop listening to Washington. Second, it should adopt a free-market, exchange-rate regime — like the currency board system in Hong Kong. Since 1983, the HKD/USD exchange rate has been fixed at 7.8, and the Hong Kong dollar has been fully convertible and fully backed by U.S. dollar reserves. By adopting such a fixed-rate regime, Beijing would dump instability and embrace stability.
My Globe Asia column in May was titled “Greece: Down and Probably Out.” Well, it’s out. Yes, Greece descended from drama to farce rapidly.
If all goes according to plan, the left-wing Greek government will come to an agreement with the so-called troika — the European Commission (EC), the European Central Bank (ECB), and the International Monetary Fund (IMF) — over the details of a third bailout program by August 20th. This rescue package will probably be worth €86 billion (U.S. $94.5 billion). So, since 2010, Greece will have received three bailouts worth a whopping €430 billion (U.S. $472.2 billion). This amounts to a staggering €39,000 (U.S. $42,831) for every man, woman, and child in Greece.
Like past bailouts, the third one will fail to stop Greece’s economic death spiral. The experts from the EC, ECB, and particularly those from the IMF have been wrong about the prospects for the Greek economy since day one. The experts have failed to embrace a coherent theory of national income determination. Indeed, they have often engaged in ad hoc theorizing that has, at times, appeared to be convoluted and politically motivated. The result has been a series of wildly optimistic forecasts about the course of the Greek economy followed by wrongheaded policies.
What has been missing from the experts’ toolkit is the monetarist model of national income determination. The monetary approach posits that changes in the money supply, broadly determined, cause changes in nominal national income and the price level (as well as relative prices — like asset prices). Sure enough, the growth of broad money and nominal GDP are closely linked. The data in the following chart speak loudly to the linkage.
Greece’s monetary tune started to be played by the ECB in 2001, when Greece was allowed to adopt the euro on false pretenses. Yes, the experts at the Hellenic Statistical Authority had cooked the Greek books, and the experts at Eurostat knew the Greek data were phony. Still, Greece was allowed to enter the eurozone.
Following the Northern Rock fiasco and bank run in September 2007 and the bankruptcy of Lehman Brothers in September 2008, the ECB allowed the supply of state money to grow. Then, in 2009, Jürgen Stark, the ECB chief economist, convinced the President of the ECB Jean-Claude Trichet that state money (the monetary base) was growing too rapidly and that excessive inflation was just around the corner. In consequence, the ECB withdrew its non-standard measures (read: credit facilities) to Greek banks in the spring of 2010. As the accompanying chart shows, that fateful ECB withdrawal marked a turning point in the growth of broad money in Greece. It, and the Greek economy, have been contracting ever since. This was in spite of a massive fiscal stimulus (a fiscal deficit of 12.7% of GDP) in 2009, prior to the October elections. Money dominates. The important thing to watch is the growth of broad money.
Shortly after the October 2009 victory of the Panhellenic Socialist Movement brought George Papandreou to power, his government passed a so-called austerity budget in which the fiscal deficit was supposed to be squeezed down to 9.4% of GDP.
Greece was clearly in trouble and needed a helping hand. But, the EC and ECB were untrusting of the Greek government. So, in March 2010, the IMF was called in to negotiate loan conditions for new Greek financing. Dominique Strauss-Kahn (DSK) was the IMF’s managing director and was preparing to run for the French presidency as the Socialist candidate. DSK was more than willing to give his socialist brothers in Athens a helping hand. In 2010, Greece received a massive bailout.
Just how massive? Normally, the IMF is limited to lending up to six times a country’s IMF quota subscription to that country. However, if the IMF judges a country’s debt to be sustainable, then that country can qualify for “exceptional access,” and the IMF credit extended to such a country can exceed the 600% limit. Thanks to DSK and the IMF experts, the debt sustainability reports were rosy, until recently. The IMF, as well as the other members of the troika, extended credit to Greece, and did so generously.
The following table tells the tale. Greece holds the record for the highest IMF credit level relative to a country’s quota.
The first and second bailouts of May 2010 and February 2012 did boost the growth rate of state money. But, bank money, which accounts for the lion’s share (over 80%) of total money (M3) contracted at a very rapid rate. In consequence, the money supply (M3) has generally plunged since the bailouts, and so has nominal (and real) economic activity. And the worst is yet to come: note that the last dismal data for state and bank money in Greece are for June. Since then, things have deteriorated, with bank closures and the imposition of capital controls. This spells more trouble for Greek banks that produce over 80% of Greece’s money and for the economy.
The four big Greek banks were already in trouble (as of Q1 2015). The accompanying table presents the Texas Ratios for the four banks that make up 87% of bank assets in Greece. Ratios over 100% mean that, if nonperforming loans must eventually be written off, a bank will become insolvent. If current data were available, I believe the nonperforming loans would be much higher than in the first quarter of 2015. In addition, with the collapse of the money supply and little chance of a recovery in the production of bank money, a high percentage of nonperforming loans will be written off. In consequence, the Greek banking system will be insolvent. This means that calls for a fourth Greek bailout are right around the corner.
The IMF failures in Greece bring back vivid memories of the Asian Financial Crisis of 1997-98. On August 14, 1997, shortly after the Thai baht collapsed on July 2nd, Indonesia floated the rupiah. This prompted the IMF to proclaim that “the floating of the rupiah, in combination with Indonesia’s strong fundamentals, supported by prudent fiscal and monetary policies, will allow its economy to continue its impressive economic performance of the last several years.”
Contrary to the IMF’s expectations, the rupiah did not float on a sea of tranquility. It plunged from 2,700 rupiahs per U.S. dollar at the time of the float to lows of nearly 16,000 rupiahs per U.S. dollar in 1998. Indonesia was caught up in the maelstrom of the Asian crisis.
By late January 1998, President Suharto realized that the IMF medicine was not working and sought a second opinion. In February, I was invited to offer that opinion and began to operate as Suharto’s Special Counselor. I proposed as an antidote an orthodox currency board in which the rupiah would be fully convertible into the U.S. dollar at a fixed exchange rate. On the day that news hit the street, the rupiah soared by 28% against the U.S. dollar. These developments infuriated the U.S. government and the IMF.
Ruthless attacks on the currency board idea and the Special Counselor ensued. Suharto was told in no uncertain terms — by both the President of the United States, Bill Clinton, and the Managing Director of the IMF, Michel Camdessus — that he would have to drop the currency board idea or forego $43 billion in foreign assistance.
Why all the fuss over a currency board for Indonesia? Politics. The U.S. and its allies wanted a regime change in Jakarta, not currency stability. Former U.S. Secretary of State Lawrence Eagleberger weighed in with a correct diagnosis: “We were fairly clever in that we supported the IMF as it overthrew [Suharto]. Whether that was a wise way to proceed is another question. I’m not saying Mr. Suharto should have stayed, but I kind of wish he had left on terms other than because the IMF pushed him out.” Even Michel Camdessus could not find fault with these assessments. On the occasion of his retirement, he proudly proclaimed: “We created the conditions that obliged President Suharto to leave his job.”
As the Indonesian episode should teach us, the IMF’s management can be very political and often neither trustworthy nor competent. Greece offers yet another chapter.