In truth, Bulgaria, not the greenback, is the better currency model after Grexit.
What if the eurozone shows Greece the door? There are claims that the creation of a new currency regime in Greece would be fraught with problems. While the practical, technical problems would be relatively small, the political problems could be daunting.
The question I often hear is more-or-less the following: if Greece were forced out of the eurozone, couldn’t it follow either the Montenegrin, the Ecuadorian, or the Bulgarian examples of successful currency regime change-overs? Since I participated in the design and implementation of these three change-overs, I can vouch for the details of just what was involved.
Montenegro — Montenegro uses the euro, but is not a formal member of the eurozone. In consequence, it avoids the moral hazard (read: potential Greek-like bad behavior) created by the European Monetary Union.
Montenegro’s opportunity for a currency regime change-over was served up by Slobodan Milosevic in January 1992. That’s when the great hyperinflation began in the rump Yugoslavia. It peaked in January 1994, when the official monthly inflation rate was 313 million percent. For some color, consider that the worst month of Weimar Germany’s 1922-23 hyperinflation saw prices go up by only 32,400 percent. The Yugoslav hyperinflation was devastating. Long before NATO struck Belgrade in 1999, Milosevic’s monetary madness had destroyed the Yugoslav economy.
In 1999, Montenegro was still part of the rump Yugoslavia, and its official currency was the discredited Yugoslav dinar. But, the mighty German mark was the unofficial coin of the realm.
Montenegro’s President, Milo Djukanovic, knew that the German mark was his trump card. If Montenegro officially adopted the mark, it would not only stabilize the economy but also pave the way for reestablishing Montenegro’s sovereignty. On November 2, 1999, he boldly announced that Montenegro was officially adopting the German mark as its national currency. This was Montenegro’s first secession step — a step supported by the United States and its allies.
The Montenegrin economy stabilized immediately and began its steady growth amid falling inflation. It wasn’t surprising that, in May 2006, voters in Montenegro turned out in record numbers to give a collective thumbs-down to their Republic’s union with Serbia. Montenegro was once again independent. And on March 15, 2007, Montenegro signed a stabilization and association agreement with the European Union, the first step towards EU membership. Then, on December 17, 2010, Montenegro received word that it was a candidate to join the EU. When the accession process comes to an end, Montenegro will enter the EU with euros in hand. Indeed, Montenegro was euro-ized from day one.
While the political winds were behind Montenegro’s sails when it adopted the German mark, and ultimately the euro, the political headwinds from Brussels and Frankfurt for such a change-over in Greece would be enormous.
Can you imagine President Obama telephoning Prime Minister Tsipras to announce that the U.S. would back the dollarization of Greece?
Ecuador — Ecuador uses the U.S. dollar, but the country is not part of the U.S. Federal Reserve System. Ecuador represented a prime example of a country that was incapable of imposing the rule of law and safeguarding the value of its currency, the sucre. The Ecuadorian sucre traded at 6,825 per dollar at the end of 1998, and by the end of 1999 the sucre-dollar rate was 20,243. During the first week of January 2000, the sucre rate soared to 28,000 per dollar.
With the sucre in shambles, President Jamil Mahuad announced, on January 9, 2000, that Ecuador would abandon the sucre and officially dollarize the economy. Telephone calls from both President Bill Clinton and then U.S. Treasury Secretary Larry Summers encouraged Mahuad to dollarize. The positive confidence shock was immediate. On January 11 — even before a dollarization law had been enacted—the central bank lowered the rediscount rate from 200 percent a year to 20 percent. On February 29, the Ecuadorian Congress passed the so-called Ley Trolebus, which contained dollarization provisions. It became law on March 13, and after a transition period in which the dollar replaced the sucre, Ecuador became the world’s most populous dollarized country. And dollarization remains, to this day, highly popular; most Ecuadorians — 85 percent — still give dollarization a thumbs up.
It is difficult to see how Greece could follow in the footsteps of Ecuador. Can you imagine President Obama telephoning Prime Minister Tsipras to announce that the U.S. would back the dollarization of Greece?
The currency board system killed inflation immediately, established stability, and remains the most trusted institution in Bulgaria.
Bulgaria — Bulgaria issues its own currency, the lev. It is a clone of the euro. Bulgaria is, therefore, part of a unified currency area with the eurozone, but Bulgaria is not a formal member of the European Monetary Union. In consequence, it does not face the moral hazard problems thrown up by the eurozone. Indeed, Bulgaria must impose fiscal discipline because the government cannot go to the European Central Bank, or the Bulgarian National Bank for that matter, and borrow funds. Not surprisingly, Bulgaria runs a tight fiscal ship and its debt-to-GDP ratio is one of the lowest in the E.U. at 29 percent.
In 1997, Bulgaria was in the grip of a hyperinflation that peaked in February, when the monthly rate hit 142 percent. To kill hyperinflation, Bulgaria installed a currency board on July 1, 1997. Under the currency board rules, the Bulgarian lev became freely convertible at a fixed rate with the German mark and it was fully backed by German mark reserves. In consequence, the Bulgarian lev became a clone of the German mark (now the euro).
Bulgaria’s currency board system was endorsed by the U.S. and Germany. The International Monetary Fund even joined the party. The currency board system killed inflation immediately, established stability, and remains the most trusted institution in Bulgaria.
In the event of a Grexit, Greece’s best option to establish sound money and fiscal discipline would be to emulate their Balkan neighbors to the North, and install a currency board that issues drachmas that clone the euro. Greece would remain in a unified currency area with the euro, without the moral hazard problems associated with formal membership in the eurozone. The external political headwinds which would accompany either the Montenegrin or Ecuadorian option would abate. The major political issues would be internal, because a drachma issued by a currency board would require Greek fiscal discipline.
Banks in Greece will not open their doors Monday morning. Greece has been moving towards this dramatic final act ever since it was allowed to enter the Eurozone with cooked fiscal accounts in January 2001 — two years after the euro was launched. One Greek government after another embraced the idea that it did not have to rein in fiscal expenditures to match revenues because Brussels would cover any shortfalls. That idea appeared to have worked, until other members of the Eurozone realized that the entire European project would fall apart if it became a transfer union.
This realization was brought into sharp focus by the bailout demands of Prime Minister Alexis Tsipras and his left-wing coalition government. Brussels finally realized that if the demands of the Tsipras government (read: Europeans must pay for Athens’ largesse) were met, the Eurozone would morph into a giant moral hazard zone. So, Brussels was forced to throw down the gauntlet: enough is enough.
Where does Athens go from here? Well, to quote former President George W. Bush, as he observed the unfolding financial crisis in 2008: “If money doesn’t loosen up, this sucker could go down.” Well, “W” had a point. Changes in the money supply, broadly determined, cause changes in nominal national income and the price level.
Since October 2008, until the Syriza party took power, the broad measure of the Greek money supply (M3) contracted at an annual rate of just over 6%. And as night follows day, the economy collapsed, shrinking by over 25% since the crisis of 2008.
Since the Tsipras government took the helm, the monetary contraction in Greece has accelerated. This means that a Greek depression of even greater magnitude is already baked in the cake.
And that’s not all. It is going to get worse. The total money supply (M3) can be broken down into its state money and bank money components. State money is the high-powered money (the so-called monetary base) that is produced by central banks. Bank money is produced by commercial banks through deposit creation. Contrary to what most people think, bank money is much more important than state money. In Greece, for example, bank money makes up just over 84% of the total money (M3) supply.
With banks so wounded, Greece is destined to become a financial zombie state.
I estimate the current annual implied inflation rate in Ukraine to be 92 percent. This is the world’s second-highest inflation rate, far lower than Venezuela’s 480 percent but slightly higher than Syria’s 75 percent.
I regularly estimate the annual inflation rates for Ukraine. To calculate those inflation rates, I use dynamic purchasing power parity (PPP) theory. I computed the 92 percent rate by using black-market exchange rate data that the Johns Hopkins-Cato Institute Troubled Currencies Project has collected over the past year.
A recent front-page feature article in the New York Times attests to the severity of Ukraine’s inflation problem. Danny Hakim’s reportage contains many anecdotes that are consistent with my inflation estimates based on PPP. For example, chocolate that used to cost 80 Ukrainian hryvnian per kilogram has dramatically increased to 203 Ukrainian hryvnia per kilogram over the past 17 months — a 154 percent increase. On an annualized basis, this amounts to an inflation rate of 93 percent — almost exactly the same number I obtained when applying the scientific PPP As evidence of the Alice in Wonderland nature of Ukraine’s current state of affairs, President Petro Poroshenko penned an op-ed in the Wall Street Journal on June 11. The title of his unguarded, gushing piece perfectly reflects the sentiments contained in his article: We’re Making Steady Progress in Ukraine, Despite Putin.
The President failed to even allude to Ukraine’s inflation problem. He is apparently unaware of the harsh realities facing the citizens of his country. He is also apparently unaware that his finance minister, Natalie Jaresko, whom he praises to high heaven, was recently in Washington, D.C., where she used a new Ukrainian law as cover to threaten a sovereign debt default. The reportage on these threats appeared in London’s Financial Times on June 11, the same day the Wall Street Journal published President Poroshenko’s op-ed.
It is time for Ukraine to get real.wry
Comments Off on Ukraine: The World’s Second-Highest Inflation
Although Venezuela’s inflation has soared (see “Up, Up, and Away“), Venezuela is not experiencing a hyperinflationary episode — yet. Since the publication of Prof. Phillip Cagan’s famous 1956 study “The Monetary Dynamics of Hyperinflation,” the convention has been to define hyperinflation as when the monthly inflation rate exceeds 50 percent.
I regularly estimate the monthly inflation rates for Venezuela. To calculate those inflation rates, I use dynamic purchasing power parity (PPP) theory. While Venezuela’s monthly inflation rate has not advanced beyond the 50-percent-per-month mark on a sustained basis, it is dangerously close. Indeed, Venezuela’s inflation rate is currently 45 percent per month (see the accompanying chart).
If inflation moves much higher, the legacy of Hugo Chavez’s Bolivarian Revolution will be that Venezuela joins the rather select hyperinflation club as the 57th member. Yes, there have only been 56 documented hyperinflations.
Comments Off on Venezuela: Not Hyperinflating — Yet
The rule of law subjects the State to a fixed set of rules that limits the scope of its coercive powers. Individuals and their property are protected from the arbitrary, ad hoc actions of the State and other individuals. In consequence, individuals can plan their activities within the confines of known, fixed “rules of the game.” This allows people to pursue their personal ends, as long as their actions do not infringe on the broadly-defined property rights of their fellow citizens.
When properly applied, the rule of law guarantees freedoms in the economic, political, intellectual and moral spheres. In the economic sphere, money constitutes an important element. The great Austrian economist Ludwig von Mises dealt at length with this issue in The Theory of Money and Credit, which was published originally in 1912:
“It is impossible to grasp the meaning of the idea of sound money if one does not realize that it was devised as an instrument for the protection of civil liberties against despotic inroads on the part of governments. Ideologically it belongs in the same class with political constitutions and bills of rights. The demand for constitutional guarantees and for bills of rights was a reaction against arbitrary rule and the non-observance of old customs by kings. The postulate of sound money was first brought up as a response to the princely practice of debasing the coinage. It was later carefully elaborated and perfected in the age which—through the experience of the American Continental Currency, the paper money of the French Revolution and the British Restriction period—had learned what a government can do to a nation’s currency system.”
Today, Venezuela has at best a tenuous grip on the rule of law. This is nowhere more visible than in the monetary sphere. The country’s foreign exchange reserves are falling like a stone (see the accompanying chart).
Relative to the mighty U.S. dollar, Venezuela’s currency, the bolivar, is also falling like a stone. Indeed, it has lost 47% against the greenback just since the start of the year (see the accompanying chart).
As night follows day, inflation has soared as the bolivar has plunged. I estimate Venezuela’s annual inflation rate at 335%. That’s the highest rate in the world. For those holding bolivars, it amounts to: “no rule of law, bad money.” It is worth noting that currency debasement and inflation robbery were not always the order of the day in Caracas. During the decade of the 1950s, the average annual inflation rate was only 1.7% — not much above Switzerland’s. In the 1960s, Venezuela actually witnessed a decade of mild deflation. It wasn’t until the 1980s that Venezuela experienced a decade of double-digit annual inflation. Today, inflation, contrary to the official numbers and amateur estimates, has soared well into triple-digit territory.
When inflation rates are elevated, standard economic theory and reliable empirical techniques allow us to produce accurate inflation estimates. With free market exchange-rate data (usually black-market data), the inflation rate can be calculated. The principle of purchasing power parity (PPP), which links changes in exchange rates and changes in prices, allows for a reliable inflation estimate.
To calculate the inflation rate in Venezuela, all that is required is a rather straightforward application of a standard, time-tested economic theory (read: PPP). Using black-market exchange rate data that The Johns Hopkins-Cato Institute Troubled Currencies Project has collected over the past year, I estimate Venezuela’s current annual inflation rate to be 335% (see the accompanying chart).
Facing this inflationary theft, Venezuelan’s have voted with their wallets. Indeed, they have unofficially begun to dollarize the economy. But, the only way to establish the rule of law in the monetary sphere is to officially dollarize the economy by officially dumping the hapless bolivar and replacing it with the U.S. dollar.
Ecuador, where I served as the chief advisor to the Minister of Finance, when that country dollarized, offers some lessons that merit Caracas’ attention.
Ecuador represented a prime example of a country that was incapable of imposing the rule of law and safeguarding the value of its currency, the sucre. The Banco Central del Ecuador was established in 1927, with a sucre-U.S. dollar exchange rate of 5. Until the 1980s, the central bank periodically devalued the sucre against the dollar, violating the rule of law. In 1982, the central bank began to exercise its devaluation option with abandon. From 1982 until 2000, the sucre was devalued against the dollar each year. The sucre traded at 6,825 per dollar at the end of 1998, and by the end of 1999 the sucre-dollar rate was 20,243. During the first week of January 2000, the sucre rate soared to 28,000 per dollar.
In the case of Ecuador, the inability of the government to abide by the rule of law was, in part, a consequence of traditions and moral beliefs. Ecuadorian politics have traditionally been dominated by elites (interest groups) that are uninhibited in their predatory and parochial demands on the State. With the lack of virtually any moral inhibitions, special interest legislation was the order of the day. For example, during the rout of the sucre in 1999, laws were passed that allowed bankers to make loans to themselves. In addition, state guarantees for bank deposits were introduced. These proved to be a deadly cocktail, one that allowed for massive looting of the banking system’s deposit base. This, as well as the collapsing sucre, enraged most Ecuadorians.
With the rule of law (and the sucre) in shambles, President Mahuad announced on January 9, 2000 that Ecuador would abandon the sucre and officially dollarize the economy. The positive confidence shock was immediate. On January 11—even before a dollarization law had been enacted—the central bank lowered the rediscount rate from 200% a year to 20%. But, this newfound ray of hope was threatening to some, and during a 24-hour period (January 21–22), a coup d’état ensued. While the Mahuad government was toppled, the coup was a bungled affair and the former Vice President Gustavo Noboa assumed the Presidency. He honored Mahuad’s dollarization pledge. On February 29, the Congress passed the so-called Ley Trolebus, which contained dollarization provisions. It became law on March 13, and after a transition period in which the dollar replaced the sucre, Ecuador became the world’s most populous dollarized country on September 13.
With much the same enthusiasm as Ecuador’s coup plotters and the rigidity of a dogmatic cleric, the critics of dollarization condemned it as something akin to voodoo economics. Well, the critics have been predictably proven wrong.
The misery index is an objective measure of just how well dollarization has worked. The index is equal to the sum of the inflation rate (end of year), bank’s lending interest rates and unemployment rate, minus the actual percentage change in GDP per capita. Simply put, a high index means higher misery.
In Ecuador, prior to the implementation of dollarization in 2000, the country sustained a misery index of over 120. The public suffered greatly from inflation, but after dollarization was implemented, high inflation was stifled and misery drastically fell. The accompanying chart shows the direct link between dollarization and the immediate and sustained decrease in misery. From 2003 through 2014, the misery index in Ecuador has been remarkably constant at around 20 – one of the lowest in Latin America.
Ecuadorians know that dollarization has allowed them to import a vital element of the rule of law – one that protects them from the grabbing hand of the State. That’s why recent polling results show that dollarization is embraced by 85% of the population. It’s time for Venezuelans, as well as many others, to take note and dollarize.
Comments Off on Venezuela: No Rule Of Law, Bad Money
When banks are in distress, it is important to assess how easily the bank’s capital cushion can absorb potential losses from troubled assets. To do this, I performed an analysis using Texas Ratios for Greece’s four largest banks, which control 88% of total assets in the banking system.
We use a little known, but very useful formula to determine the health of the Big Four. It is called the Texas Ratio. It was used during the U.S. Savings and Loan Crisis, which was centered in Texas. The Texas Ratio is the book value of all non-performing assets divided by equity capital plus loan loss reserves. Only tangible equity capital is included in the denominator. Intangible capital — like goodwill — is excluded.
Despite the already worry-some numbers, the actual situation is far worse than even I had initially deduced. A deeper analysis of the numbers reveals that Greece’s largest banks include deferred tax assets as part of total equity in their financial statements. Deferred tax assets are created when banks are allowed to declare their losses at a later time, thereby reducing tax liabilities. This is problematic because these deferred tax assets are really just “phantom assets” in the sense that these credits cannot be used (read: worthless) if the Greek banks continue to operate at a pretax loss.
Similar to its neighbors — Portugal, Spain and Italy —Greece provides significant state support to its banks by offering credit for loss deductions for taxable future profits. For the four largest banks, this type of support made up 38-61% of total equity (see accompanying chart).
Adjusting the Texas Ratio to account for the phantom assets yields much higher ratios. These indicate significantly higher risk of bank failures, barring a capital injection (see the accompanying chart).
Comments Off on Yet Another Greek Secret: The Case of Phantom Assets
Led by the charismatic Alexis Tsipras, the Syriza party took office in Athens on January 26th. The most prominent member of the new Prime Minister’s cabinet is Yanis Varoufakis, the Finance Minister. He is an economics professor, with a complete repertoire of anti-capitalist rhetoric. And with government spending amounting to 58.5% of Greek GDP, Varoufakis’ hot anti-austerity harangues have turned the meaning of the word “austerity” on its head. After three months in office, the Syriza coalition has accomplished virtually nothing. There have been no commitments — credible or not — to do anything.
As Greece’s economic drama (read: crisis) moves towards its final stage, people are anxious to see how it will end. “I looked up the answers in the history books,” writes John Dizard in the Financial Times, “it works better than trying to get inside information from the cabinet, since there is no information on the inside.”
It turns out that this is not the first time Greece has been in financial hot water. Indeed, that Balkan country has been a serial deadbeat. Following its recognition as a state in 1832, Greece spent most of the remainder of the 19th century under the control of creditors. The pattern started with a default in 1832. In consequence, Greece’s finances were put under French administration. Following Greece’s defeat at the hands of Turkey in 1897, Greece’s fiscal house was entrusted to a Control Commission. During the 20th century, the drachma was one of the world’s worst currencies. It recorded the world’s sixth highest hyperinflation. In October 1944, Greece’s monthly inflation rate hit 13,800%.
Fast forward and we observe Greece’s entry into the European Monetary Union (EMU) on January 1st, 2001, two years after the eleven original members established the EMU. Greece’s entry was under a cloud because most either knew or suspected that it came with some accounting trickery. Still, the Greeks were enthusiastic new members of the “club.” If Greece could enter without following the rules and free ride — the other members of the “club” would have to pay the bill. That was the thinking in Athens. But, Greece got into trouble when others stopped picking up the tab. This is a classic recipe for a fiscal time bomb, and time is running out.
The International Monetary Fund (IMF), as well as the European Union (EU) and other creditors have supplied plenty of fissionable material for the bomb. As for the IMF, it has never before extended credit to any country on such a scale. Under normal conditions, the IMF is supposed to be limited to lending up to 200% of a country’s quota in a single year and 600% in cumulative total. Under the IMF’s “exceptional access” policy, however, there are virtually no limits on lending. Greece has talked its way into IMF credits worth an astounding 1,860% of its quota. In consequence, Greece owes the IMF about $30 billion, with big chunks of the debt due relatively soon.
The creditors have a Greek problem. In the words of former President George W. Bush: “this sucker is going down.”
To understand why, one needs a theory of national income determination. Unfortunately, most of what is written about Greece fails to offer much by way of such a theory. Indeed, the financial musings about the Greek crisis adhere to my “95% Rule”: 95% of what appears in the financial press is either wrong or irrelevant.
The monetary approach fills this void. It posits that changes in the money supply, broadly determined, cause changes in nominal national income and the price level. Sure enough, the growth of broad money and nominal GDP are closely linked.
Greece is in a depression. During the 2008-13 period, GDP has dropped by almost 30%. Last year, GDP managed to stabilize, with growth of less than 1%. But, this year looks very grim. A review of the accompanying chart explains these dismal data. The broad money measure for Greece (M3) has contracted dramatically since the onset of the 2009 financial panic. Indeed, it’s been contracting at a 6.04% annual rate. In consequence, the monetary approach to national income would predict a serious contraction in GDP — just what has occurred in Greece. We can expect further contraction of the Greek economy. It’s already baked in the cake. Broad money (M3) growth has been in negative territory since December 2014, and it’s currently contracting at a 9.77% rate.
The total money supply can be broken down into its state money and bank money components. State money is the high-powered money (the so-called monetary base) that is produced by central banks. Bank money is produced by commercial banks through deposit creation. Contrary to what most people think, bank money is much more important than state money. In Greece, for example, bank money makes up 84.26% of the total money supply.
So, let’s take a look at Greek banks — the all-important producers of money. To do that, we analyze the state of Greece’s four largest banks which account for 87% of the total bank assets in Greece (see the accompanying table).
We use a little known, but very useful formula to determine the health of the Big Four. It is called the Texas Ratio. It was used during the U.S. Savings and Loan Crisis, which was centered in Texas. The Texas Ratio is the book value of all non-performing assets divided by equity capital plus loan loss reserves. Only tangible equity capital is included in the denominator. Intangible capital — like goodwill — is excluded.
The ratio measures the likelihood of failure by comparing a bank’s bad assets to its available provisions for bad loans plus its capital. When the ratio exceeds 100%, a bank does not have the capacity to absorb its losses from troubled assets. In consequence, it will either require a fresh capital injection, or it will fail.
At the close of business last year, the Texas Ratios exceeded 100% for the Piraeus Bank, Alpha Bank, and the Eurobank Ergasias (see the accompanying table). And the national bank of Greece wasn’t much better, with a ratio of 98.7%. Since the first of the year, the deposit bases of the banks, as well as the economy, have deteriorated markedly, suggesting that the Texas Ratios have also deteriorated. The banks are in big trouble, as indicated by their stock prices. Given that these prices (see the accompanying charts) are well below each bank’s book values, the idea of raising fresh capital in the private markets is out of the question. After all, it would result in a massive dilution of existing shareholders. The state could inject new capital into the system. But, the state has no funds. So, Greece’s banking system, which produces about 85% of Greece’s money supply, is on the verge of being forced to shut down.
Another Greek debt default is just around the corner. And given that money dominates, the specter of an economic collapse is not out of the question.
Venezuela has the dubious honor of registering the world’s highest inflation rate. According to my estimate, the annual implied inflation rate in Venezuela is 252%.
The only other country in which this rate is in triple digits is Ukraine, where the inflation rate is 111%. The only encouraging thing to say about Ukraine’s shocking figure is that it’s an improvement over my February 24th estimate of 272%—an estimate that attracted considerable attention because Matt O’Brien of the Washington Post understood my calculations and reported on them in the Post’s “Wonk blog.”
As a bailout has started to take shape in Ukraine, the dreadful inflation picture has “improved.” Since February 24th, the hryvnia has strengthened on the black market from 33.78 per U.S. dollar to 26.1 per U.S. dollar. That’s almost a 30% appreciation (see the accompanying chart).
As night follows day, currency strength is followed by lower inflation. When inflation rates are elevated, standard economic theory and reliable empirical techniques allow us to produce accurate inflation estimates. With free market exchange-rate data (usually black-market data), the inflation rate can be calculated. The principle of purchasing power parity (PPP), which links changes in exchange rates and changes in prices, allows for a reliable inflation estimate.
To calculate the inflation rate in Ukraine, all that is required is a rather straightforward application of a standard, time-tested economic theory (read: PPP). Using black-market exchange rate data that the Johns Hopkins-Cato Institute Troubled Currencies Project has collected over the past year, I estimate Ukraine’s current annual inflation rate to be 111%.
That rate is much higher than the “official” rate of 34.5%. Both the International Monetary Fund’s Extended Fund Facility for Ukraine (which has recently been approved) and Ukraine’s debt rescheduling negotiations (which have just commenced) are sitting on quicksand. Programs and negotiations based on a false premise are always treacherous affairs.
Comments Off on Ukraine: The World’s Second-Highest Inflation
Charles W. Calomiris and Peter Ireland, two distinguished economists and friends, wrote an edifying piece in The Wall Street Journalon 19 February 2015. That said, their article contains a great inflation canard.
They write that “Fed officials should remind markets that monetary policy takes time to work its way through the economy—what Milton Friedman famously referred to as “long and variable lags”—and on inflation.” That’s now a canard.
For recent evidence, we have to look no further than the price changes that followed the bursting of multiple asset bubbles in 2008. The price changes that occurred in the second half of 2008 were truly breathtaking. The most important price in the world — the U.S. dollar-euro exchange rate — moved from 1.60 to 1.25. Yes, the greenback soared by 28% against the euro in three short months. During that period, gold plunged from $975/oz to $735/oz and crude oil fell from $139/bbl to $67/bbl.
What was most remarkable was the fantastic change in the inflation picture. In the U.S., for example, the year-over-year consumer price index (CPI) was increasing at an alarming 5.6% rate in July 2008. By February 2009, that rate had dropped into negative territory, and by July 2009, the CPI was contracting at a -2.1% rate. This blew a hole in a well-learned dogma: that changes in inflation follow changes in policy, with long and variable lags.
Milton Friedman was certainly correct about the period covered in the classic, which he co-authored with Anna J. Schwartz: A Monetary History of the United States, 1867-1960. Recall that the world of that era was one in which the fixed exchange rates ruled the roost. That’s not today’s world. Indeed, many important currencies now float. Since the world adopted a flexible exchange-rate “non-system”, changes in inflation can strike like a lightning bolt.
We are still in the grip of the Great Recession. Economic growth remains anemic and below its trend rate in most parts of the world. And what’s more, this state of subdued economic activity has been with us for over seven years.
In the U.S. (and elsewhere) the central bank created a classic aggregate demand bubble that became visible in 2004. The Fed’s actions also facilitated the creation of many market-specific bubbles in the housing, equity, and commodity markets. These bubbles all dramatically burst, with the bankruptcy of Lehman Brothers in September 2008.
The price changes that occurred in the second half of 2008 were truly breathtaking. The most important price in the world — the U.S. dollar-euro exchange rate – moved from 1.60 to 1.25. Yes, the greenback soared by 28% against the euro in three short months. During that period, gold plunged from $975/oz to $735/oz and crude oil fell from $139/bbl to $67/bbl.
What was most remarkable was the fantastic change in the inflation picture. In the U.S., for example, the year-over-year consumer price index (CPI) was increasing at an alarming 5.6% rate in July 2008. By February 2009, that rate had dropped into negative territory, and by July 2009, the CPI was contracting at a -2.1% rate. This blew a hole in a well-learned dogma: that changes in inflation follow changes in policy, with long and variable lags. Since the world adopted a flexible exchange-rate “non-system”, changes in inflation can strike like a lightning bolt.
True to form, central bankers have steadfastly denied any culpability for creating the bubbles that so spectacularly burst during the Panic of 2008-09. What’s more, they have repeatedly told us that they have saved us from a Great Depression. For central bankers, the “name of the game” is to blame someone else for the world’s economic and financial troubles.
To understand why the Fed’s fantastic claims and denials are rarely subjected to the indignity of empirical verification, we have to look no further than Milton Friedman. In a 1975 book of essays in honor of Friedman, Capitalism and Freedom: Problems and Prospects, Gordon Tullock wrote:
“…it should be pointed out that a very large part of the information available on most government issues originates within the government. On several occasions in my hearing (I don’t know whether it is in his writing or not but I have heard him say this a number of times) Milton Friedman has pointed out that one of the basic reasons for the good press the Federal Reserve Board has had for many years has been that the Federal Reserve Board is the source of 98 percent of all writing on the Federal Reserve Board. Most government agencies have this characteristic…”
Friedman’s assertion has subsequently been supported by Larry White’s research. He found that, in 2002, 74% of the articles on monetary policy published by U.S. economists in U.S.-edited journals appeared in Fed-sponsored publications, or were authored (or co-authored) by Fed staff economists.
The explanations of the Great Recession have been all over the map and surprisingly incoherent. For example, Andrew Lo reviewed twenty one books on the topic in the January 2012 issue of the Journal of Economic Literature. He found that the mainstream, post-crisis approach amounts to an ad hoc approach that lacks a unifying theory or theme. That said, the literature – from Alan Greenspan’s 2013 book The Map and The Territory to the 2009 tome Animal Spirits by George Akerlof and Robert Shiller – is punctuated with a great deal of conjecture about changes in investors’ animal spirits and how these wrecked havoc on the financial markets and the economy during the Panic of 2008-09 and the ensuing Great Recession. Much of this is borrowed from a recent fashion in economics: behavioral finance.
But, this line of argument goes back to earlier theories of the business cycle; theories that stress the importance of changes in business sentiment. For example, members of the Cambridge School of Economics, which was founded by Alfred Marshall, all concluded that fluctuations in business confidence are the essence of the business cycle. John Maynard Keynes put great stress on changes in confidence and how they affected consumption and investment patterns. Frederick Lavington, a Fellow of Emmanuel College and the most orthodox of the Cambridge economists, went even further in his 1922 book, The Trade Cycle.
Lavington concluded that, without a “tendency for confidence to pass into errors of optimism or pessimism,” there would not be a business cycle. So, the mainstream approach fails to offer much of a theory of national income determination. The monetary approach fills this void. Tim Congdon – a master of the high theory of monetary economics and all the knotty practical details of money and banking, too – has supplied us with a most satisfying and comprehensive treatment of the causes of business cycles and the current Great Recession. Three of Congdon’s most important books are listed in the references at the bottom of this editorial.
The monetary approach posits that changes in the money supply, broadly determined, cause changes in nominal national income and the price level (as well as relative prices – like asset prices). Sure enough, the growth of broad money and nominal GDP are closely linked. Indeed, the data in the following chart speak loudly.
By observing the plunge in broad money, the contraction in the U.S. economy was, therefore, inevitable and in line with the monetary approach to national income determination (see the accompanying chart).
But why has post-crisis growth remained so low? Well, because the growth in broad money has remained well below its trend rate. Indeed, Divisia M4 is only growing at a 2.7% year-over-year rate. Why? Since the crisis, the policies affecting bank regulation and supervision have been massively restrictive. By failing to appreciate the monetary consequences of tighter, pro-cyclical bank regulations, the political chattering classes and their advisers have blindly declared war on bank balance sheets. In consequence, bank money, which accounts for between 70% to 90% of broad money in most countries, has contracted or failed to grow very much since the crisis. Since bank money is an elephant in the room, even central bank quantitative easing has been unable to fully offset the tightness that has enveloped banks. Looking at the U.S., there is a ray of hope, however: credit to the private sector has finally started to grow above its trend rate.
The money and credit picture in the Eurozone has been much more dire than in the U.S. In fact, this has resulted because, until recently, the European Central Bank has refused to offset, with quantitative easing, the regulatory-induced tight monetary policies imposed on banks. That is now changing and credit to the private sector is about ready to become positive for the first time since 2012 (see the accompanying chart).
China, the last of the Big Three, has a monetary problem (as well as others). Broad money has been growing at below its trend rate since 2012, and it’s becoming weaker with each passing month (see the accompanying chart). In an attempt to pump up the growth rate in broad money, China’s central bank has cut interest rates twice since last November and lowered reserve requirements for banks. But so far, it has proven to be too little, too late. Not surprisingly, official forecasts for China’s 2015 GDP growth have been dialed back.
The monetary approach offers a coherent theory of national income determination – one that stands up to the test of empirical verification. It explains the Panic of 2008-09 and the ensuing Great Recession with ease. The monetary approach reigns supreme.
References:
Comments Off on The Monetary Approach Reigns Supreme
For some years, hot money flowed in, adding massively to China’s foreign reserve stockpile. Speculators borrowed cheaply in U.S. dollars and bought yuan-denominated assets in anticipation of an ever-appreciating yuan. Well, this carry trade has shifted into reverse, with $91 billion in net outflows in the last quarter of 2014. And with that, the ever-appreciating yuan story has come to a close, too. Indeed, the yuan has lost 1.8% against the greenback since the New Year.
A clear picture of the drag that the hot money outflows are putting on China is shown by inspecting the annual growth rate in the People’s Republic of China’s net foreign assets. With the reserve of the carry trade, the slowdown in net foreign assets growth has been pronounced.
This, in turn, has reduced the foreign asset component of the growth in China’s money supply, putting a squeeze on the economy’s fuel supply. Indeed, China’s money growth rate has fallen well below its trend rate since mid-2012.
In an attempt to reverse the slump in China’s money supply growth, the People’s Bank has just reduced its benchmark interest rates for the second time in three months. A wise move.
The specter of currency wars rises like a phoenix once again. This time around, most of the warriors reside in Washington, D.C.. The strong dollar has inflamed the currency warriors (read: mercantilists) led by Democratic Senator Chuck Schumer from New York and Lindsey Graham, a Republican Senator from South Carolina. These mercantilists argue that “cheap” foreign currencies give the U.S.’s trading partners an “unfair” advantage, something worth doing battle over.
About the only thing the mercantilists have right is the fact that the U.S. dollar has been strengthening. As the accompanying chart shows, the currencies of all the U.S.’s top trading partners have lost value against the greenback over the past six months. These losses have ranged from 1.8% for the Chinese yuan to 21.6% for the Brazilian real. Russia, the fifteenth largest trading partner of the U.S., has seen the value of its ruble fall 39.5% over the past six months.
So, the currency hawks want to do what they always want to do: go to war. The particular trigger is the Trans-Pacific Partnership (TPP), a trade agreement between Asian countries and the U.S.. With this agreement, which the Obama administration is pushing for, the currency warriors have spotted an opening. They want to insert enforceable rules against so-called currency manipulation into the TPP.
All this saber rattling is a broken mercantilist record, particularly with regard to the U.S.’s biggest Asian trading partners: Japan and China. Indeed, these two countries have accounted for the lion’s share of the U.S. trade deficit over the past twenty years (see the accompanying chart).
From the early 1970s until 1995, Japan was viewed by the mercantilists as an enemy. They asserted that unfair Japanese trading practices caused the U.S. trade deficit, and that the U.S. bilateral trade deficit with Japan could be reduced if the yen appreciated against the dollar — a “weak dollar policy.” Washington even tried to convince Tokyo that an ever-appreciating yen would be good for Japan. Unfortunately, the Japanese complied and the yen strengthened, moving from 360 to the greenback in 1971 to 80 in 1995.
In April 1995, Secretary of the Treasury Robert Rubin belatedly realized that the yen’s great appreciation was causing the Japanese economy to sink into a deflationary quagmire. In consequence, the U.S. stopped arm-twisting the Japanese government about the value of the yen and Secretary Rubin began to evoke his now-famous strong-dollar mantra.
But, while this policy switch was welcomed, it was too late. Even today, Japan continues to suffer from the mess created by the yen’s appreciation.
As Japan’s economy stagnated, its contribution to the increasing U.S. trade deficit declined, falling from its 1991 peak of almost 60% to 9.3% today. While Japan’s contribution declined, China’s surged from slightly more than 9% in 1990 to 47.2% today. With these trends, the Chinese yuan replaced the Japanese yen as the mercantilists’ whipping boy.
Interestingly, the combined Sino-Japanese contribution to the U.S. trade deficit has actually declined from its 1991 peak of over 70% to 56.7%. This hasn’t stopped the mercantilists from claiming that the Chinese yuan is grossly undervalued, and that this creates unfair Chinese competition and a U.S. bilateral trade deficit with China.
This raises an obvious question: does a weak yen or yuan vis-à-vis the dollar (in nominal terms) explain the contribution of Japan and China to the U.S. trade deficit? After all, this exchange-rate argument (read: competitive advantage) is what the mercantilists use to wage war. When it comes to Japan, whose contribution to the U.S. trade deficit has been declining for the past twenty years, there is a very weak relationship between the yen’s strength and Japan’s contribution to the trade deficit (see the accompanying chart). Certainly not something worth going to war over. And as for China, the relationship between the strength of the yuan and China’s contribution to the U.S. trade deficit contradicts the mercantilist conjecture (see the accompanying chart). Indeed, the Chinese yuan has appreciated in nominal terms relative to the greenback over the past twenty years, and so has the Chinese contribution to the U.S. trade deficit.
But, evidence fails to sway the mercantilists. They still want tough currency manipulation provisions inserted into the TPP. They don’t realize that the term “currency manipulation” is hard to define and, therefore, is not an operational concept that can be used for economic analysis. In consequence, currency manipulation rules would be almost impossible to implement. The U.S. Treasury (UST) has acknowledged this fact in reports to Congress. Indeed, in 2007, the UST attempted to have the International Monetary Fund (IMF) act as a currency cop and go after manipulators. Raghuram Rajan, who is currently governor of India’s central bank and was the IMF’s chief economist in 2007, pronounced the episode an “unmitigated disaster.”
It isn’t only the mercantilists’ pols who don’t understand that nominal exchange rates don’t have much to do with trade deficits. Some economists – most notably C. Fred Bergsten of the Peterson Institute for International Economics and supply-side guru Arthur B. Laffer – don’t seem to understand the economics behind the U.S. trade deficit, which has been with us since 1975. Those economics were fully explained by one of my occasional collaborators, the late Ronald I. McKinnon from Stanford University. Indeed, he elaborated on them in his last book, The Unloved Dollar Standard: From Bretton Woods to the Rise of China (2013). In short, the U.S. trade deficit is the result of a U.S. savings deficiency, not exchange rates. As a result, the trade deficit can be reduced by some combination of lower government consumption, lower private consumption or lower private domestic investment. You wouldn’t know this basic truth by listening to the rhetoric coming out of Washington.
In my misery index, I calculate a ranking for all countries where suitable data exist. My misery index — a simple sum of inflation, lending rates, and unemployment rates, minus year-on-year per capita GDP growth — is used to construct a ranking for 108 countries. The table below is a sub-index of all Latin American countries presented in the world misery index.
A higher score in the misery index means that the country, and its constituents, are more miserable. Indeed, this is a table where you do not want to be first.
Venezuela and Argentina, armed with aggressive socialist policies, end up the most miserable in the region. On the other hand, Panama, El Salvador, and Ecuador score the best on the misery index for Latin America. Panama, with roughly one tenth the misery index score of Venezuela, has used the USD as legal tender since 1904. Ecuador and El Salvador are also both dollarized (Ecuador since 2000 and El Salvador since 2001) – they use the greenback, and it is clear that the embrace of the USD trumps all other economic policies.
The lesson to be learned is clear: the tactics which socialist governments like Venezuela and Argentina employ yield miserable results, whereas dollarization is associated with less misery.
Comments Off on Measuring Misery in Latin America 2014: More Dollarization, Please
The Russian ruble ended 2014 in bad shape. Not as bad as the Ukrainian hryvnia or the Venezuelan bolivar, but bad, nevertheless. For most of 2014, Russia faced an ever-increasing ratcheting up of economic sanctions. These set the stage for what was to come late in the year: the collapse of oil prices and the announcement on November 10th that the ruble would be allowed to float. When combined, these three ingredients created a perfect storm.
In the storm, the ruble fell like a stone. In addition to witnessing most of the ruble’s purchasing power vanish, the Russians saw the volatility of their currency explode, reflecting the increased uncertainty of the ruble’s course. Not a pretty picture (see the accompanying chart). But, one that can be brought into some focus by reflecting on analogies with the Indonesian financial crisis of 1997-98.
On August 14, 1997, shortly after the Thai baht collapsed on July 2, Indonesia floated the rupiah. This prompted Stanley Fischer, Deputy Managing Director of the International Monetary Fund, to proclaim that “the management of the IMF welcomes the timely decision of the Indonesian authorities. The floating of the rupiah, in combination with Indonesia’s strong fundamentals, supported by prudent fiscal and monetary policies, will allow its economy to continue its impressive economic performance of the last several years.”
“If Russia wants to avoid further ruble turmoil, it should tether the ruble tightly to the U.S. dollar.”
Contrary to the IMF’s expectations, the rupiah did not float on a sea of tranquility. It plunged from 2,700 rupiahs per U.S. dollar at the time of the float to lows of nearly 16,000 rupiahs per U.S. dollar in 1998. Indonesia was caught up in the maelstrom of the Asian crisis.
By late January 1998, President Suharto realized that the IMF medicine was not working and sought a second opinion. In February, I was invited to offer that opinion and began to operate (pro bono as usual) as Suharto’s Special Counselor. Although I did not have any opinions on the Suharto government, I did have definite ones on the matter at hand. After the usual open discussions at the President’s private residence, I proposed as an antidote an orthodox currency board in which the rupiah would be fully convertible into the U.S. dollar at a fixed exchange rate. On the day that news hit the street, the rupiah soared by 28 percent against the U.S. dollar. These developments seemed to infuriate the U.S. government and the IMF.
Ruthless attacks on the currency board idea and the Counselor ensued. Suharto was told in no uncertain terms — by both the President of the United States, Bill Clinton, and the Managing Director of the IMF, Michel Camdessus — that he would have to drop the currency board idea or forego $43 billion in foreign assistance. He was also aware that his days as President would be numbered if the rupiah was not stabilized.
Economists jumped on the bandwagon too. Every half-truth and non-truth imaginable was trotted out against the currency board idea. In my opinion, those oft-repeated canards were outweighed by the full support for an Indonesian currency board (which received very little press) by four Nobel Laureates in Economics: Gary Becker, Milton Friedman, Merton Miller, and Robert Mundell.
Why all the fuss over a currency board for Indonesia? Merton Miller understood the great game immediately. As he wrote when Mrs. Hanke and I were in residence at the Shangri-La Hotel in Jakarta, the Clinton administration’s objection to the currency board was “not that it wouldn’t work but that it would, and if it worked, they would be stuck with Suharto.” Much the same argument was articulated by Australia’s former Prime Minister Paul Keating: “The United States Treasury quite deliberately used the economic collapse as a means of bringing about the ouster of President Suharto.” Former U.S. Secretary of State Lawrence Eagleberger weighed in with a similar diagnosis: “We were fairly clever in that we supported the IMF as it overthrew [Suharto]. Whether that was a wise way to proceed is another question. I’m not saying Mr. Suharto should have stayed, but I kind of wish he had left on terms other than because the IMF pushed him out.” Even Michel Camdessus could not find fault with these assessments. On the occasion of his retirement, he proudly proclaimed: “We created the conditions that obliged President Suharto to leave his job.”
To depose Suharto, two deceptions were necessary. The first involved forging an IMF public position of open hostility to currency boards. This deception was required to convince Suharto that he was acting heretically and that, if he continued, it would be costly. The IMF’s hostility required a quick about-face: Less than a year before the Indonesian uproar, Bulgaria (where I was President Stoyanov’s advisor) had installed a currency board on July 1, 1997 with the enthusiastic endorsement of the IMF, and Bosnia and Herzegovina (where I advised the government on currency board implementation) had followed suit under the mandate of the Dayton Peace Agreement, and with IMF support, on August 11, 1997.
Shortly after Suharto departed, the IMF’s currency board deception became transparent. On August 28, 1998, Michel Camdessus announced that the IMF would give Russia the green light if it chose to adopt a currency board. This was followed on January 16, 1999 with a little-known meeting in Camdessus’ office at the IMF headquarters in Washington, D.C. The assembled group included IMF top brass, Brazil’s Finance Minister Pedro Malan, and the central bank’s Director of Monetary Policy Francisco Lopes. It was at that meeting that Camdessus suggested that Brazil adopt a currency board.
The second deception involved the widely-circulated story which asserted that I had proposed to set the rupiah’s exchange rate at an overvalued level so that Suharto and his cronies could loot the central bank’s reserves. This take-the-money-and-run scenario was the linchpin of the Clinton administration’s campaign against Suharto. It was intended to “confirm” Suharto’s devious intentions and rally international political support against the currency board idea and for Suharto’s ouster.
The overvaluation story was enshrined by the Wall Street Journal on February 10, 1998. TheJournal reported that Peter Gontha had summoned me to Jakarta and that I had prepared a working paper for the government recommending that the rupiah-U.S. dollar exchange rate be set at 5,500. This was news to me. I did not meet, nor know of, Peter Gontha at that time, nor had I authored any reports about Indonesia or proposed an exchange rate for the rupiah.
I immediately attempted to have this fabrication corrected. It was a difficult, slow, and ultimately unsatisfactory process. Although the Wall Street Journal reluctantly published a half-baked correction on February 14, the damage had been done.
The Journal’s original fabrication (or some variant of it) was repeated in virtually every major magazine and newspaper in the world, and it continues to reverberate to this day, even in so-called scholarly books and journals. For example, in his 2000 memoir, From Third World to First, The Singapore Story: 1965-2000, Lee Kuan Yew asserts that “in early February 1998, Bambang, the president’s son, brought Steve Hanke, an American economics professor from Johns Hopkins University, to meet Suharto to advise him that the simple answer to the low exchange value of the rupiah was to install a currency board.” This bit of misinformation was a surprise, since I have never had any contact with Bambang Suharto. But, it is not just politicians who fail to “fact check” their assertions. Theodore Friend’s 2003 tome, Indonesian Destinies, misspells my name and then proceeds to say that I “counseled the [Suharto] family to peg the exchange rate at 5000.”
Setting the record straight has been complicated by the official spinners at the IMF. Indeed, they have been busy as little bees rewriting monetary history to cover up the IMF’s mistakes, and Indonesia represents one of its biggest blunders. To this end, the IMF issued a 139-page working paper “Indonesia: Anatomy of a Banking Crisis: Two Years of Living Dangerously 1997–99” in 2001. The authors include a “politically correct” version of the currency board episode, asserting among other things, that I counseled President Suharto to set the rupiah-dollar exchange rate at 5000. This pseudo scholarly account, which includes 115 footnotes, fails to document that assertion because it simply cannot be done. That official IMF version of events also noticeably avoids referencing any of my published works or interviews based on my Indonesian experience.
This episode and its manipulations are not unique in the political world. It is useful, though, after time and events unfold, to set facts straight in order to understand the situation then and now. Other countries are currently experiencing some of the vagaries of similar treatments. Let’s hope that they, as well as the rest of us, do not have to pay later for such blunders and mistakes. Indeed, that story should be a sobering lesson.
If Russia wants to avoid further ruble turmoil, further impoverishment of its citizens, and potential political upheavals, it should tether the ruble tightly to the U.S. dollar. That’s what the big oil producers in the Persian Gulf region do — and for good reasons.
The world did not come to an end on December 21, 2012, as the Mayan calendar had predicted. In 2012, news of Iran’s hyperinflation brought the solar Hijri calendar — used throughout Iran and Afghanistan — back into the news. And, every year, over a billion people around the world celebrate the Chinese Lunar New Year. Suffice to say, there are many calendars out there besides our familiar Gregorian calendar.
The Hanke-Henry Permanent Calendar provides a comprehensive revision of the contemporary Gregorian calendar. It adheres to the most basic tenant of a fixed (read: permanent) calendar: each year, each date falls on the same day of the week; in our case, every year begins on Sunday, January 1.
The year is then divided into four three-month quarters. Each month begins on the same day (and date) each year. The first two months of each quarter are made up of 30 days; the third is made up of 31 days. Each quarter contains the same number of days, which simplifies financial calculations; this methodology would have prevented Apple’s Q4 2012 accounting fiasco, for example.
So, each quarter contains 91 days, resulting in a 364-day year that is comprised of 52 seven-day weeks. This is a vital feature of the HHPC, because, by preserving the seven-day Sabbath cycle, the HHPC abides by the fourth commandment, thereby avoiding the major complaints from ecclesiastical quarters that have doomed all other attempts at calendar reform.
Moreover, the HHPC accounts for the disparity between the necessary length of our calendar (364 days) and the astronomical calendar (roughly 365.24 days, the duration of one full orbit of the Earth around the Sun) by simply tacking one additional full week to the end of every fifth or sixth year (specifically, 2015, 2020, 2026, 2032, 2037, 2043, 2048, and so on). This keeps the calendar in line with the seasons — serving the same function as does the leap year in the present system.
The multiplicity of calendars can be explained by a variety of scientific, cultural, economic, and religious factors. But, on a whole, it underscores the fact that no calendar has been able to fully address all of the issues associated with measuring and organizing the passing of time. The Hanke-Henry Permanent Calendar represents the most economically advantageous calendar reform to date.
Q & A
1.) Why fool with the calendar?
There are enormous economic advantages to the proposed calendar. These benefits come because the new calendar is identical every year… except that, every five or six years, there is a one-week long “Mini-Month,” called “Xtr (or Extra),” at the end of December. “Xtr (or Extra) Week” brings the calendar into sync with the seasonal change as the Earth circles the Sun. How much needless work do institutions, such as companies and colleges, put into arranging their calendars for every coming year? From 2017 on, they do it once … and it is done forevermore.
2.) Surely you’re not fooling with the clocks, too?
Yes, starting 2017 January 1, it is proposed that Universal Time, on a 24 hour scale, be used, everywhere on earth, and forevermore. As a result of this, beginning 2017 January 1, the date and time will always be the same, everywhere, greatly facilitating international understanding.
3.) Doesn’t your innovation mean that, for some folks, the date changes when the sun is overhead?
Yes … but those folks live in the middle of the Pacific Ocean. As things stand, they have an International Date Line to contend with. With our proposal, that will disappear forever. So they gain that!
4.) What happens to my birthday?
If, for example, your birthday is March 7, it will ALWAYS fall on a Wednesday, for evermore. However, if you want to celebrate your birthday on the preceding or following weekend, why of course you can! Christmas Day will always fall on a Sunday, which will be pleasing to Christians, but, will also be pleasing to companies who currently lose up to two weeks of work to the Christmas/New Year’s annual mess. New Year’s Day will always be on a Sunday, too.
5.) Do I have to wait until 2017 January 1 to adopt the new calendar?
No, you can adopt it right now; but you need to persuade your neighbors to agree on the date.
6.) Which years have a Xtr (or Extra) “week-long month” at the end of December?
I am indebted to Irv Bromberg for pointing out that a simple way exists to test whether a year contains a Xtr (or Extra) month: if the corresponding Gregorian year either starts on a Thursday, or ends on a Thursday, that year contains a Xtr (or Extra).
These years were chosen so as to keep the new calendar as close as could be to the cycle of the seasons. The new calendar is never more than five days off the seasons, after 2017 January 1: 15% of the time, the date is identical to the Gregorian date; 29% of the time, one day different; 27% of the time, two days different; 19% of the time, three days different, and 9% of the time, 4 days different. Only 1.3% of the time, are the dates different by five days, and never by more than that. The bottom line: 90% of the time, HH is off Gregorian by … 3 days or fewer!
7.) What happens to Daylight Saving Time?
Daylight Saving Time disappears, … but also, it stays, as changes in working hours. Time zones, such as Eastern Standard Time, still exist exactly as they do now, but are considered to be “working hours” zones. In Eastern Standard Time Zone, a “9-to-5” job is defined as a 14:00-to-22:00 (14 o’clock to 22 o’clock) job. The next calendar day begins at what we now call 7 p.m. in the Eastern Time zone. (On the West Coast of the US, the next day begins at 4 p.m.) “Spring forward, Fall back” now means that, on the chosen day, everyone changes their work hours by one hour, but the clock time stays the same. “See you tomorrow” refers to the sun being overhead, not the calendar.
8.) My birthday is January 31. But there will be no more January 31st’s! And I run a restaurant: there will be no birthday parties on February 30’s since no one was born on them! I’ll lose business.
I do think we could adapt to this! And what about people who are born in Xtr (or Extra) week? When is their birthday, in non-Xtr (or Extra) years? Be like Queen Elizabeth: celebrate your birthday on a date of your choosing! For people born on the vanished 31st days of months – there’s a simple solution. They were born on the last day of the month, so their birthday is the last day of the month (which would be the 30th).
9.) Calendar Reform has always failed before. This will, too.
Right, calendar reform has always failed before. The reason was that all the major proposals included breaking the seven day cycle of the week. That is completely unacceptable to humankind, and that will never happen. The HH Calendar does not break that cycle. The HH Calendar can be implemented by those companies that want efficiency whenever they please. Just do it! Countries can, too. Just do it, Mr. President! Just do it, Madame President!
10.) Hold on! You’ve forgotten the farmers! They can’t be four days off in spring planting!
They don’t need to be four days off in spring planting. They just check the date on their calendar that is painted on the wall (painted, since it remains identical from year to year), and then they check what the Gregorian Date is, to see if it is planting day yet. The Gregorian Calendar does not cease to exist, it just isn’t ordinarily used. Except by agronomists.
11.) Why 2012 January 1? and 2017 January 1?
Because in both the current Gregorian Calendar, and in the new HH calendar, that day is a Sunday (the start of a 7-day cycle, which we call a “week.”)
12.) Won’t this whole exercise be costly?
It will be about as costly as the Y2K problem was. Remember that? But it is a one-time cost, and then we are safe until the year 10,000. Also, since we have just been through Y2K, we are in an ideal position to make a “second adjustment,” having already located the software that needs to be adjusted, and learned how to do it. Let’s not get rusty on this again: strike while the iron is hot, or at least still warm!
13.) So, you are really just asking: do I want a very accurate, but very inconvenient calendar (Gregorian), or do I want a more-than-adequately-accurate, but VERY CONVENIENT calendar (HH)?
Yes
Comments Off on What is he Hanke-Henry permanent calendar?
Bankers — facing a barrage of new capital requirements, regulations and investigations — must feel as if they are targets of a witch hunt. Well, if the truth be told, they are. Indeed, it’s gotten so bad that the Dutch authorities, who were clueless before the crisis, have put the sinners (read: bankers) on public display and forced them to repeat the following: “I swear that I will endeavor to maintain and promote confidence in the financial sector…. so help me God.” So, there you have it, so help me God.
The world’s politicians and central bankers — the ones who enabled the excesses that led to the financial crisis of 2009 — have to blame someone else for their misdeeds. And what is a more inviting target than hapless bankers?
Beating up on bankers (and banks) — the ones who produce most of the world’s money — creates a problem: it constrains the growth of money broadly defined. In consequence, Europe is in a slump, and so is Japan. As for the U.S., it’s stuck in a growth recession with nominal aggregate demand growing much more slowly than the trend rate since 1987. Even China is sagging a bit. This is all because of relatively slow money growth. Let’s review the terrain and my themes of the past few years—themes that continue to be supported by the unfolding evidence.
First, take a look at the United States. The Center for Financial Stability, under the direction of Prof. William A. Barnett, publishes Divisia monetary data. These are now available via Bloomberg and provide the most accurate picture of the U.S. money supply that is available.
Even though the Fed has been pumping out State Money at a super-high rate since the crisis of 2009, it hasn’t been enough to offset the anemic supply of money produced by banks — Bank Money. Even after six years of pumping, State Money still only accounts for 21 percent of the total money supply broadly measured. In consequence, the Divisia M4 money supply measure is growing on a year-over-year basis at a very low rate of only 1.7 percent. And that’s why nominal U.S. aggregate demand measured by final sales to domestic purchasers is still growing at below its trend rate of 5% (see the accompanying chart).
Moving across the pond to Europe, the picture starts to turn even uglier–thanks to Bank Money austerity, not fiscal austerity. Here again, the cause is the regulatory witch hunt aimed at banks and bankers by the political class and their loyal troops — the central bankers.
When it comes to measuring the money supply, we must heed the words of Sir John Hicks, a Nobelist and high priest of economic theory: “There is nothing more important than a balance sheet.” Indeed, these sentiments were echoed by my Parisian friend, former Governor of the Banque de France Jacques de Larosiere, in his 17 April 2013 lecture at Science Po.
Components of the money supply appear on a bank’s balance sheet as liabilities. The money supply is simply the sum all of the deposits and various other short-term liabilities of the financial sector. On every balance sheet, the sum total of assets must equal total liabilities. In consequence, the money supply (short-term liabilities) must have either an asset or longer-term liability counterpart on the balance sheet (see the accompanying chart).
One of these counterparts is known as credit, and it includes various financial instruments, such as private loans, mortgages, etc. Money and credit are often confused as synonyms, but they are not the same thing — credit is a counterpart to money.
Any economist worth his salt should have the money supply on his dashboard. But, it is also important to look at what the financial sector is doing with these deposits — are they lending this money back out to the economy, and if so, to whom? There is one very important counterpart of the money supply that is particularly worth looking at — loans to private individuals and businesses, known as “private credit.”
The money supply in Europe is growing, but credit has been contracting since late 2012 (see the accompanying chart). Why? To answer this question it is necessary to determine what driving money supply growth in the Eurozone is. A large chunk of the contribution to the growth in M3 has come from an increase in bank lending to governments.
Another large chunk of this growth in M3 has come from a decrease in banks’ long-term liabilities. To understand how this would increase the money supply, consider the following example: If I own a long-term bank bond, and the bank then retires that bond, I will take the money I receive as a result of this transaction and put it into my bank account. Hence, the money supply (deposits) increases.
In short, government borrowing and the restructuring of the liability side of bank balance sheets is pumping up the Eurozone money supply, while private credit remains in the doldrums. And that’s why it’s not surprising that Europe is on the verge of a recession.
To understand just how dire things in Europe are, take a look at the accompanying chart for Germany’s money and credit. In the absence of developed capital markets, small and medium sized businesses depend on bank credit. And without bank credit, these businesses, which account for the lion’s share of Europe’s job growth, can’t grow and often can’t survive.
China turns out to be one of the few countries in which the authorities understand money, and one that has refused to jump on the capital punishment bandwagon. Indeed, China saved themselves from a slump in 2009 because it massively increased the supply of money and credit (see the accompanying chart), rather than embrace Keynesian fiscal nostrums. That said, China has allowed its money and credit growth to drift below trend. So, it’s not surprising that a recent research paper by Ma Jun of the People’s Bank of China predicts a slowdown in China’s GDP growth — from 7.4 percent in 2014 to 7.1 percent in 2015. The money and credit growth numbers suggest that such a slowdown might just be in the cards.
Money and credit matter. It’s remarkable that the most influential press in the world (read: The New York Times and the Financial Times) love to join the witch hunt and repeat fiscal nostrums, but rarely mention what matters.
Comments Off on Bank Capital Punishment and Other Nostrums
My last column “Regime Uncertainty Weighs on Growth” (October 2014) stressed that market participants do not know what the Big Players (Read: governments and central banks) will do next. This regime uncertainty is creating an economic undertow. No wonder there have been so many recovery false dawns.
In the past month, markets have become very volatile. Equity and oil markets are the most notable. Why? Well, regime uncertainty continues to be ramped up. Indeed, Berlin-bashing by Paris and Rome over fiscal austerity has become the latest political rage. On top of that, weak economic data from the Continent and a spat of surprisingly weak U.S. data moved the world’s stock markets. If that wasn’t enough, there were some so-called mixed economic signals emitted from China. We must not forget the International Monetary Fund’s (IMF) World Economic Outlook report that was unveiled at the World Bank — IMF meetings in Washington, D.C. The report contained a major policy flip-flop, switching mantras from fiscal austerity to fiscal stimulus. The volatility mixer was stirred further when the Saudis clarified that they would not cut back on oil production to prop up crude prices. The Kingdom wants to retain, or increase, its market share. To top it off, Ebola has reared its ugly head. All of this confirms what I call the School Boy’s Theory of History: it’s just one damn thing after another.
Let’s examine some of these factors to see just how they contribute to the world of volatility. The relatively weak U.S. economic data are no surprise. The best proxy for nominal aggregate demand is measured by final sales to domestic purchasers (FSDP). Nominal FSDP has never recovered to its longrun trend of 5% since the crisis of 2009. Indeed, aggregate demand is growing at an anemic year-over-year rate of only 3.9%.
Anyone who is properly informed about the economics of money and banking knows why nominal aggregate demand has not bounced back to a trend rate of growth. The money supply, correctly measured by Prof. William A. Barnett’s Divisia M4, is only growing at a year-over-year rate of 2.0%. Money fuels the economy and without fuel, the economy eventually stalls.
In the U.S., bank regulations since the collapse of Lehman Brothers have been ill-conceived, draconian, and pro-cyclical. In consequence, bank money has shrunk in both relative and absolute terms since 2009 (see the accompanying chart). This has forced the Federal Reserve to engage in a massive quantitative easing program. As the chart shows, the state money produced by the central bank has exploded, growing from less than 10% of M4 to 21.7%. But, since bank money is the elephant in the room, the growth in total broad money has been slow. Therefore, it’s predictable that there is weak nominal growth and a very low inflation rate in the U.S.
The state of money and banking in Europe is even more problematic than in the U.S. Regulators on the Continent have made a strong push to force banks to deleverage, which is why private credit has been contracting in the Eurozone for over a year (see the accompanying chart). Presently, the authorities have an army of approximately 6,000 bureaucrats combing through 135,000 loan files at 130 of Europe’s largest banks. This is all part of Europe’s stress test exercise. The main goal is to make Europe “safe” from bankers and banks. Bankers who have been covering up bad loans will be discovered and taken to the woodshed; zombie banks will be liquidated or recapitalized. If that is not enough, the Single Supervisory Mechanism, a pan-European bank regulator, will be unveiled, on November 4th. This will usher in stress tests as far as the eye can see (Read: tight bank money).
There has been a great deal of non-sense coming from the Continent, too. French President Hollande and Italian Prime Minister Renzi, as well as their followers, have been shouting from the rooftops that Europe has had enough fiscal austerity. They claim that austerity is killing economic growth.
Most of their rhetoric is aimed at Germany, a country in which fiscal austerity is a hallmark. Well, the anti-austerity rhetoric does not match reality. The accompanying chart shows that government expenditures in all but five of the countries in the European Union have seen their government expenditures as a percent of GDP rise since 2007. It is interesting that all of the countries that witnessed real fiscal austerity were former communist states. And two of them (Bulgaria and Lithuania) were countries in which I installed currency boards to discipline monetary and fiscal operations. So, where is all the austerity that Messrs. Hollande, Renzi, and company are screaming about?
Turning to China, we see that the authorities understand money. They have kept the supply growing at close to a trend rate for some time (see the accompanying chart). Yes, the money supply measured by M2 is currently a bit below trend. That’s why the recent injection of 200 billion yuan ($32.8 billion) into twenty of China’s largest banks is no surprise, and why China’s third quarter growth of 7.3% beat the consensus forecast of 7.2%.
Moving from regime uncertainty to the uncertainty caused by Ebola, we find a grim state of affairs. When anticipating economic activity, money matters. When anticipating, the state of health in a country, doctors matter. If a country has few doctors, it will have relatively high mortality rates (see the accompanying chart).
As it turns out, the three countries in which Ebola is concentrated — Guinea, Liberia, and Sierra Leone — have few doctors. This is a bad sign since there is little indigenous capacity to fight the disease. And that’s not all, the governments in these three countries have virtually no capacity to deliver much of anything. Indeed, the World Bank’s Worldwide Governance Indicators Project reports on six broad measures of government effectiveness for 215 countries. Let’s look at a country’s “Government Effectiveness,” which is a broad aggregate that includes public perception of the quality of civil service and government credibility. In 2013, the most effective governments were Finland, Singapore, Denmark, and Sweden. In contrast, Liberia’s government is only more effective than 8.6% of all the governments in the world. Guinea and Sierra Leone were not much better, with percentile rankings of 9.1% and 12.4%, respectively. These data suggest that an indigenous solution to the Ebola crisis is not in the cards.
Most outside governments, as well as the United Nations’ World Health Organization (WHO), have displayed a great deal of incompetence in addressing the Ebola crisis. The only exception seems to be the capable Médecins Sans Frontières, which is also known as Doctors Without Borders. Welcome to the world of volatility.
Comments Off on Welcome to the World of Volatility
Bulgarians will go to the polls on October 5th to elect new members of its parliament and thus a new government. Before casting their votes, voters should reflect on the economic records of Bulgaria’s governments since 1995.
Every country aims to lower inflation, unemployment, and lending rates, while increasing gross domestic product (GDP) per capita. Through a simple sum of the former three rates, minus year-on-year per capita GDP growth, I constructed a misery index for each of Bulgaria’s six governments since 1995 (see the accompanying table).
The first government documented in the table is that of Zhan Videnov’s socialist government. It was a disaster. Hyperinflation occurred on Videnov’s watch, with the monthly inflation rate reaching 242% in February 1997. The misery index soared by 529% during Videnov’s short-lived reign.
Bulgaria clearly lacked an “economic constitution”—one that would provide fiscal discipline and monetary stability. So in the midst of the turmoil of the 1996–97 hyperinflation episode, Bulgaria took an important first step toward what would become an economic constitution.
As an adviser to President Stoyanov, I played a role in ending Bulgaria’s hyperinflation nightmare. Six short months after I presented my blueprint for a Bulgarian currency board to the president, the currency board was born (July 1997). With the currency board in place, Bulgaria’s misery index fell like a stone, falling by 97% during the conservative Kostov government’s tenure. Fiscal discipline and monetary stability were finally established.
Since the Kostov years, Bulgaria has had four governments and the misery index has fluctuated around a reading of 20. The currency board has clearly given Bulgaria fiscal discipline and monetary stability. The misery index readings in the table attest to that fact. The other thing that the misery index readings make clear is that the socialist-led governments in Bulgaria have delivered misery (Videnov 1995–97, Stanishev 2005–09, and Oresharski 2013–14).
Comments Off on Bulgaria’s October 5th Elections: A Flashback at the Economic Records
Last week, President Obama addressed the nation to proclaim that the U.S. and an unspecified coalition were going to once again ramp up our military operations in Middle East and North Africa (MENA). This time, the target is the Islamic State, the group terrorizing Iraqi and Syrian citizens.
Just what is the economic condition of that troubled MENA region? This is a question that must be addressed by anyone who is looking over the horizon. After all, the state of an economy today will have a great influence on post-war prospects tomorrow.
My Misery Index allows us to obtain a clear picture of the current economic situation. The Index is the simple sum of the inflation rate, unemployment rate and bank lending rate, minus per capita GDP growth. I calculated a misery index for the countries in MENA where sufficient data were available.
As the chart shows, many of the countries in MENA are, well, miserable. Indeed, a score of over twenty indicates that serious structural economic problems exist. To correct these problems, thereby reducing misery, major economic reforms (read: free-market reforms) must be implemented. But, even if the respective governments approve such changes, it is unclear whether they can be implemented. To put a bit of color on that conjecture, consider that only 13 of the 21 countries in MENA reported the four pieces of economic data that are required to calculate my Misery Index. The regional governments’ inability to produce reliable economic data is a canary in a coal mine. When it comes to MENA, most of the countries have been singing for a long time. The region is, by and large, miserable.
Comments Off on Middle East and North Africa: A Fatal Attraction
Last week, President Obama hosted the U.S.-Africa Leaders Summit in Washington, D.C. He welcomed over 40 African heads of state and their outsized entourages to what was a festive affair. Indeed, even the Ebola virus in West Africa failed to dampen spirits in the Nation’s capital. Perhaps it was the billions of dollars in African investment, announced by America’s great private companies, that was so uplifting.
Good cheer was also observed in the advertising departments of major newspapers. Yes, many of the guest countries paid for lengthy advertisements — page turners — in the newspapers of record. That said, the substantive coverage of this gathering was thin. Neither the good, the bad, nor the ugly, received much ink.
What about the good? Private business creates prosperity, and prosperity is literally good for your health. My friend, the late Peter T. Bauer, documented the benefits of private trade in his classic 1954 book West African Trade. In many subsequent studies, Lord Bauer refuted conventional wisdom with detailed case studies and sharp economic reasoning. He concluded that the only precondition for private trade and prosperity to flourish was individual freedom reinforced by security for person and property.
More recently, Ann Bernstein, a South African, makes clear that the establishment and operation of private businesses does a lot of economic good (see: The Case for Business in Developing Countries, 2010). Yes, businesses create jobs, supply goods and services, spread knowledge, pay taxes, and so forth. Alas, in the Leaders Summit reportage that covered the multi-billion dollar investments by the likes of The Coca-Cola Co., General Electric and Ford Motor Co., the benefits of the humdrum activity of business and trade were nowhere to be found. But, as they say, “that’s not the President’s thing.”
Let’s move from the good to the bad and the ugly, and focus on the profound misery in Sub-Saharan Africa. I measure misery with a misery index. It is the simple sum of inflation, unemployment and the bank lending interest rate, minus year on year GDP per capita growth. Using this metric, the countries for Sub-Saharan Africa are ranked in the accompanying table for 2012.
As I discussed in my recent Globe Asia column, index scores of around 10 or below indicate a relatively free economy, and countries with scores around 20 indicate considerable dysfunction, requiring serious structural (read: free market) reforms. The Sub-Saharan rankings show that the region literally goes from bad to ugly. For most of these countries to be hospitable for private businesses and the prosperity they bring, huge structural reforms will have to be undertaken.
Can the governments govern? Are they up to the basic tasks which include: the maintenance of law and order; the effective management of monetary and fiscal affairs; and the provision of suitable institutions to support private activities?
For governments in Sub-Saharan Africa, the ability to produce timely economic data sheds some light on these questions. For 2013, only six countries reported the data required to construct a misery index (see the accompanying table). For the other 42 countries in Sub-Saharan Africa, the basic economic data required to produce a misery index are 1.5 years out of date.
So, even if there is a will to tackle the enormous structural economic problems facing most of Africa’s countries, do they have the capacity to deliver, or is everyone just pretending?
Comments Off on Africa: The Good, the Bad and the Ugly


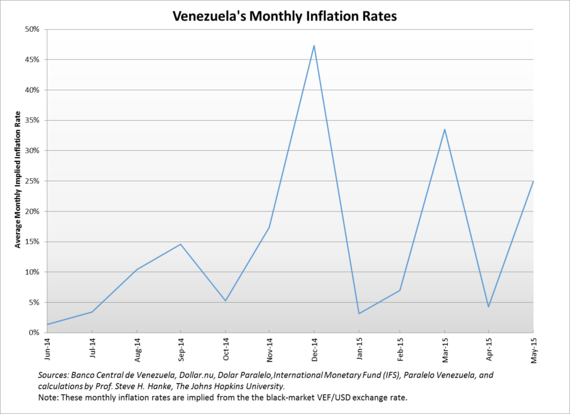


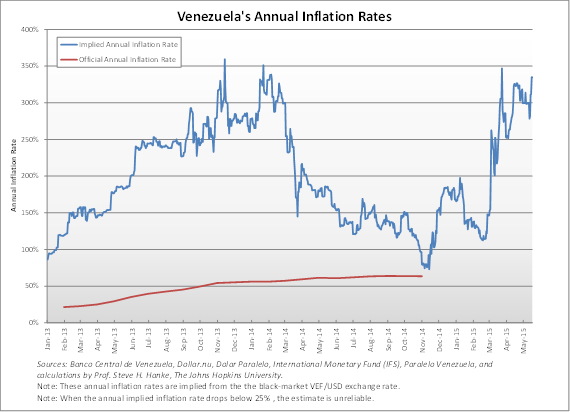
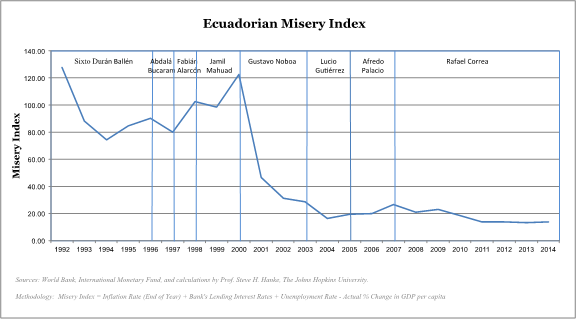


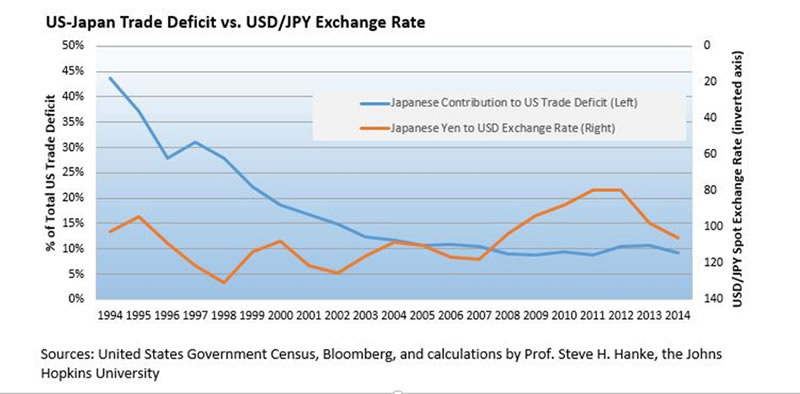


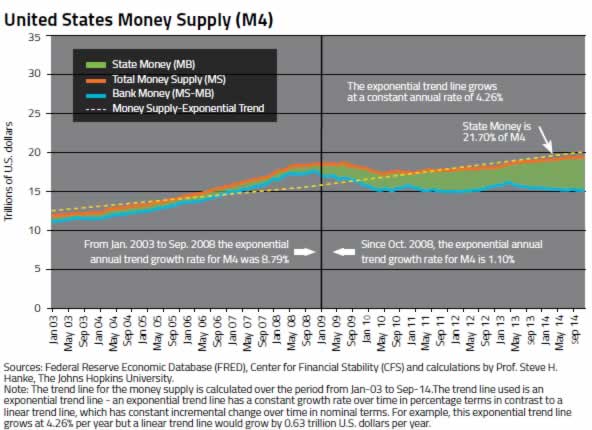
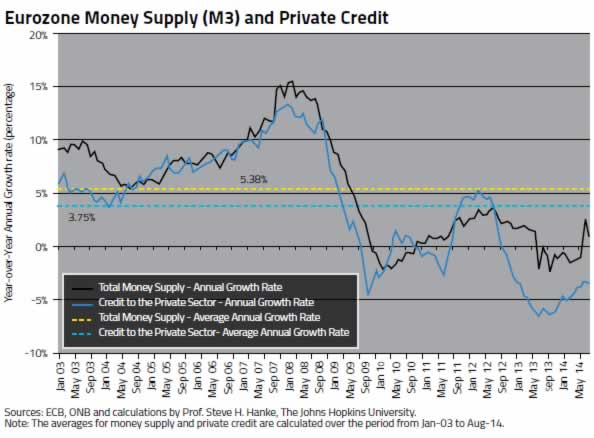
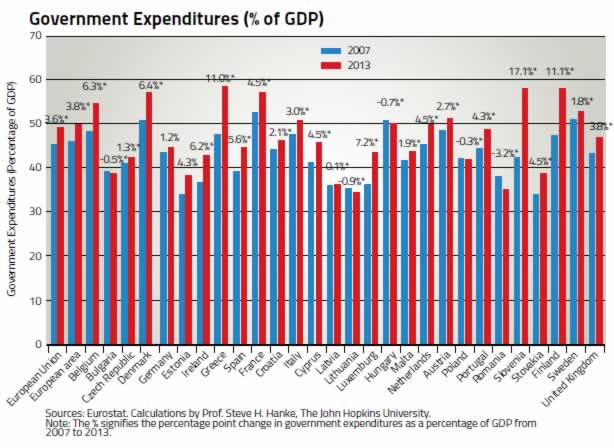
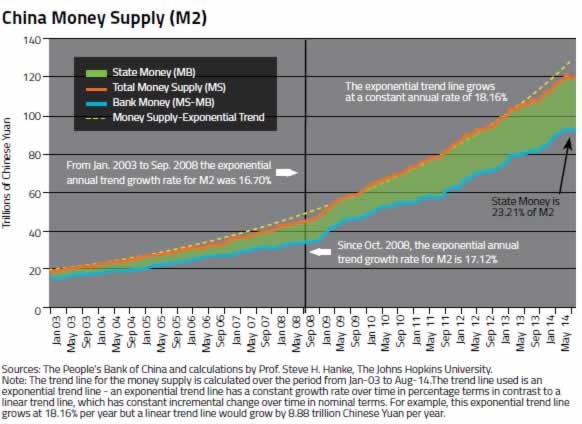
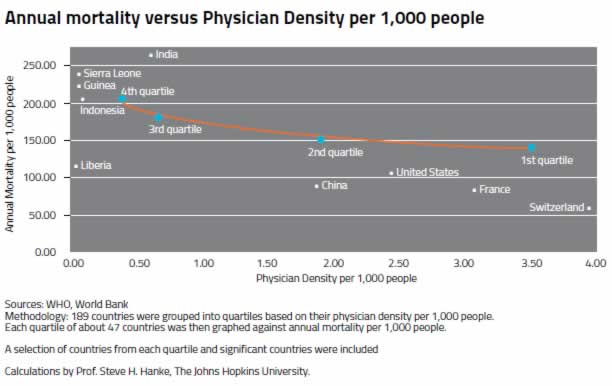


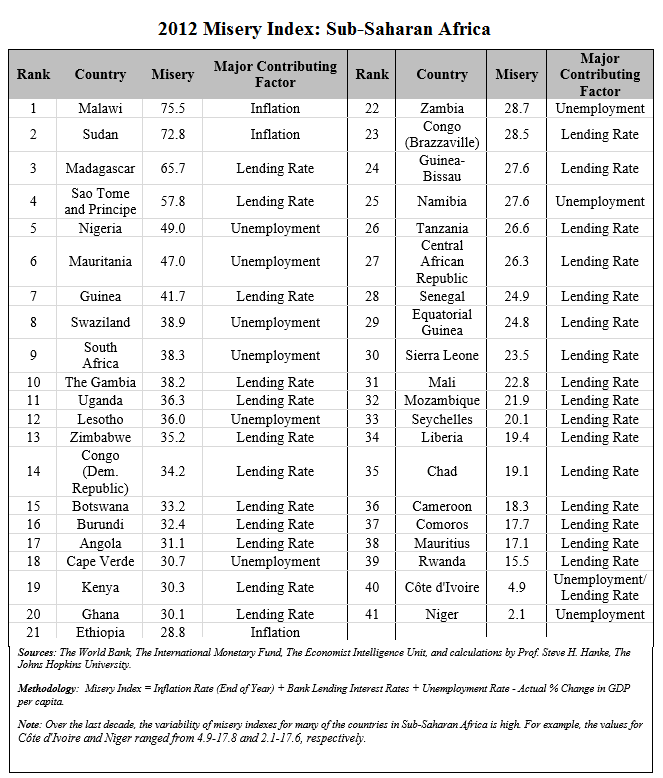
