Recently, I calculated misery index scores for 89 countries (see: Globe Asia May 2014). For any country, a misery index score is simply the sum of the unemployment, inflation and bank lending rates, minus the percentage change in real GDP per capita. A higher misery index score reflects higher levels of “misery”.
The calculations I presented earlier represent a snapshot of the state of misery by country for 2013. In what follows, I present scores calculated over time for several regions and a few selected countries in Asia. These allow us to reflect on the scores in terms of their topological patterns.
The first chart shows the misery index patterns by major regions over the past decade. Several things are worth noting. Even on an aggregate basis, the chart features two poles of attraction: one centered at a score of twenty and another at ten. Countries that gravitate towards the higher pole generally need a heavy dose of structural (read: free-market) reforms. Conversely, countries closer to the lower pole have considerably more economic freedom.
Since the financial crisis of 2008-09, Southeast Asia’s level of misery declined from a score of roughly 20 to 11.7, which suggests that there has been positive structural reform in the region. I should also add that quantitative easing by the U.S. Federal Reserve generated significant hot-money flows that positively affected South East Asia.Western Europe’s endemic structural problems also show up in the chart. Since the crisis, the region’s misery score remained elevated because of pronounced problems in labor markets. To bring the score from its current 15.4 reading down to 10, Europe needs some significant economic liberalization.
Let’s now move from regional groupings to individual countries. Indonesia displays an interesting picture. Thanks to the disastrous advice of the International Monetary Fund (IMF), Indonesia floated the rupiah on 14 August 1997. Contrary to the IMF’s expectations, the rupiah did not float on a sea of tranquility. Its value plunged from 2,700 rupiahs per U.S. dollar, at the time of the float, to lows of nearly 16,000 rupiahs per U.S. dollar in 1998. In consequence, Indonesia’s inflation and its misery index score soared, and Suharto was brought down after 31 years in power. Then, the score fell sharply, and since the Wahid government, it has been drifting downward. Changes in Indonesia’s misery index score and its components are displayed in the accompanying table.
At present, Indonesia’s score of 20.0 is right on the magnetic twenty pole. Whoever is eventually crowned winner of the recent presidential election must introduce serious structural reforms if he wishes to see Indonesia’s misery index score fall towards the lower magnetic pole.
Narendra Modi, the newly elected prime minister of India, faces a misery index score of 24.5. Given the nature of India’s political system and bureaucracy, he certainly has his work cut out for him. Modi will have to go beyond voicing his plans for reforms to ensure their implementation and a significant reduction in India’s misery index score.
While still in Asia, we must take a look at two stellar performers, Chinaand Singapore: both have scoresbelow ten. China is note worthy because its misery index score was well below five during the 1997 –2005 period. It was then that the yuan was tightly linked to the U.S.dollar. China’s misery index score began to steadily climb only afterthe country allowed the yuan to appreciate against the green back due to pressure from Washington, D.C.
By most measures of competitiveness, Singapore holds one of the top spots. It’s not surprising, therefore, that Singapore’s misery index scores are low and even dipped into negative territory in 2010.
A topological trip down the misery index lane reveals two centers of gravity: twenty and ten.The countries whose scores hover around ten are simply reaping free-market dividends. Those with scores around twenty are rather miserable and serious candidates for deep free-market reforms. Without these reforms, those countries are destined to stay, well, miserable.
My big takeaway from Money (McGraw Hill, 2014) is that Steve Forbes is no James Dean. Forbes is a rebel with a cause. Free-markets and sound money, please. In what follows, I will briefly mention 11 other takeaways from my reading of Moneyby Steve Forbes and Elizabeth Ames.
Takeaway #1
The dedication to Alexander Hamilton signaled right away that Money was going in the right direction. We all know that Hamilton was an extraordinary financial engineer. Among other things, he established a federal sinking fund to finance the Revolutionary War debt. Hamilton also engineered a large debt swap in which the debts of individual states were assumed by the newly created federal government. Hamilton’s ability to solve the debt problem established America’s financial credibility and gave the new nation a much needed positive confidence shock. We are also aware of the fact that Hamilton was a great contributor to the Federalist Papers — a superb document. Indeed, no less than Milton Friedman once wrote in Newsweek (June 4, 1973) thatFederalist Paper 15 “contains a more cogent analysis of the European Common Market than any I have seen from the pen of a modern writer.”
What we do not all know, particularly many of those who espouse the sanctity of private property rights, is that Hamilton was a distinguished lawyer who took on some of the most famous property cases in U.S. legal history. After the Revolutionary War, the state of New York enacted harsh measures against Loyalist and British subjects. These included the Confiscation Act (1779), the Citation Act (1782), and the Trespass Act (1783). All involved the seizure of property and garnered wide public support. Hamilton saw the acts as an illustration of the inherent difference between democracy and law. Hamilton took his views to court and successfully defended, in the face of enormous public hostility, those who had their property taken under the three New York state statutes.
Takeaway #2
Speaking of the taking of property and money — right here in the USA, not the USSR — let us not forget the U.S. Congress’ abrogation of the Gold Clauses in June 1933; a confiscation of property that the Supreme Court upheld in 1935.
Before that abrogation, private and public bond covenants included gold clauses. Under this system, bond holders received interest and principal payments in dollars that contained as much gold as the dollar contained when the bonds were issued. Well, after April 1933, the U.S. government manipulated the price of gold upward until President Roosevelt redefined the dollar in gold terms under the Gold Reserve Act of January 1934. Overnight, the dollar became 41% lighter. This left gold-clause bond holders out to dry.
Because of the Congress’ abrogation of the gold clauses, bondholders could only receive the nominal dollar amounts of interest and principal, as stated on their bonds. They could not receive enough additional dollars to make their payments equal in value to the amount of gold originally stipulated. In short, bondholders were stuck with new “light” dollars, not the original “heavy” ones that had been specified in the original bond covenants.
Of course Bondholders sued over this theft. But, the Supreme Court held that the abrogation of the gold clauses for private bonds was constitutional in 1935. The Court’s decision rested on the fallacious argument that contracts that contained the gold clauses interfered with Congress’ authority to coin money and regulate its value (Article 1, Section 8 of the U.S. Constitution).
For bonds issued by the U.S. government, the situation was different because Congress did not have the authority to repudiate obligations of the U.S. government. But, because the legal briefs were defective in proving actual damages, the plaintiffs who had held U.S. government bonds “protected” by gold clauses could not collect damages from the U.S. government.
In anticipation of additional gold-clause cases, Congress simply passed a law amending the jurisdiction of federal courts, barring them from hearing any further gold-clause cases. Every time I reflect on this Congressional maneuver, Paul McCartney’s classic “Back in the USSR” rings in my ears. Yes, when it comes to money, the rule of law is rather elastic (particularly during National Emergencies), even in the U.S..
Takeaway #3
This elasticity in the rule of law with regard to money is not limited to the U.S., however. Even Germany has witnessed this elasticity: under the European Monetary System’s (EMS) exchange rate mechanism (ERM), which was established in December 1978, the Bundesbank was required by law to intervene with unlimited amounts of Deutschmark sales and foreign currency purchases, whenever another member country’s currency reached the ERM’s floor.
Well, the mighty Bundesbank could not bear the thought of such an external interference with its conduct of monetary policy. So, on November 16, 1978, prior to the final EMS agreement, Herr Emminger, President of the Bundesbank, sent a missive to the West German Chancellor Helmut Schmidt. The missive states that the Bundesbank wanted to be freed from its obligation to intervene during a currency crisis.
The Chancellor wanted an EMS agreement, which was ultimately agreed to by resolution of the European Council at a meeting in Breman on December 5, 1978. But, what to do about the Bundesbank? On November 30, 1978, the Chancellor complied with the Bundesbank’s wishes by initialing the Emminger letter, before he signed the EMS agreement. But, he also told the Bundesbank Council that the Emminger letter must remain secret and not be part of the EMS agreement — yes, a secret agreement.
The Chancellor further stated that all this agreement was allowable under the classical legal exemption clause: “Clausula rebus sic stantibus” (For those of you who aren’t Latin lovers: treaties may become inapplicable because of changes in circumstances).
Well, the Bundesbank trotted out the Emminger letter 14 years later. On Friday September 11, 1992, the Bundesbank indicated that, on Monday, it would stop supporting the hapless Italian lira. This forced a devaluation of the lira over the weekend and helped spark the run on the British pound on “Black Wednesday,” September 16th — the day both Italy and the U.K. were forced to leave the ERM. In case you have forgotten, this was the event that allowed George Soros to fill his pockets in a few minutes.
Takeaway #4
It is clear that Forbes and Ames have taken the water in Vienna, or perhaps in Baden bei Wien. Indeed, Money contains many Austrian themes:
Forbes and Ames reject the closed economy model. Like Bob Mundell, who once said that the only closed economy is the world, Forbes and Ames embrace an open economy framework. This outlook is in sharp contrast to our last Fed Chairman Ben Bernanke. Bernanke did not even include the USD/EUR exchange rate (the most important price in the world) on his six-gauge dashboard.
Forbes and Ames junk the idea of equilibrium and economic stability.
Also, they embrace the central role of the entrepreneur in markets that are seen as a means to assemble dispersed knowledge and information.
As Forbes and Ames say, “Information combined with trade and enterprise: that says everything one really needs to know about economics. Money — sound, trustworthy money — is the crucial facilitator that brings it all together.” Totally Austrian, indeed.
Takeaway #5
For those who do not like to get out in the theoretical weeds and want a more practical takeaway from Money, allow me to quote from Paul Volcker’s preface to Marjorie Deane and Robert Pringle’s 1995 book The Central Banks. Volcker’s edifying preface captures both the substance and spirit ofMoney:
“We sometimes forget that central banking, as we know it today, is, in fact, largely an invention of the past hundred years or so, even though a few central banks can trace their ancestry back to the early nineteenth century or before. It is a sobering fact that the prominence of central banks in this century has coincided with a general tendency towards more inflation, not less. By and large, if the overriding objective is price stability, we did better with the nineteenth-century gold standard and passive central banks, with currency boards, or even with “free banking.” The truly unique power of a central bank, after all, is the power to create money, and ultimately the power to create is the power to destroy.”
Takeaway #6
Like Volcker, and unlike most money and banking professionals, Forbes and Ames are straightforward and clear, but they are puzzled:
“Why then is so much writing on the subject of money so needlessly complicated, with dense, impenetrable language and equations that make sense to only a handful of academicians? And why do so many people insist that bad ideas about monetary policy, like ‘inflation is needed to increase employment,’ are as settled and unassailable as scientific principles?”
To answer that question, we need go no further than research by Larry White. He found that 74% of articles on monetary policy published in 2002 were in Fed sponsored publications and authored by people on the Fed’s staff or associated with the Fed. Fortunately, Forbes and Ames leapfrog that Fed hurdle.
Takeaway #7
Where does this near-monopoly of the professional publications lead us? Well, let’s look at the current crisis and the Great Recession that we are still in the midst of. Even after the financial crises of 2008-2009, we are still cursed by the central bankers’ mantra of inflation targeting and floating exchange rates. To refresh your memories, consider the following:
1. Former Fed Governor Ben Bernanke sounded an alarm in November 2002. He claimed that the major danger facing the U.S. economy was deflation. It was, of course, a false alarm. Never mind.
2. To fight the phantom deflation, the Fed pushed the federal funds rate all the way down to 1% by July 2003, when the natural rate was 3% – 4%.
3. With those artificially low interest rates, the Fed became the great enabler for the wild yield chasing, risk taking, accelerating carry trade, leveraging, and relative price distortions.
4. The behavior of the CPI inflation target and other important prices in the 2003-2008 period tell the tale: the CPI, excluding food and energy, only increased by 12.4% during that period. Indeed, that metric increased at a steady annual rate of 2.1% –right on target. Housing prices, however, went up 45% from 2003 until 2006 (Q1). Stock prices went up 66% from 2003 until 2007 (Q4). Commodities zoomed 92% from 2003 until 2008 (Q2).
5. As Prof. Gottfried Haberler put it in 1928, “The relative position and change of different groups of prices are not revealed, but are hidden and submerged in a general [price] index.” But, inflation targeters ignore Haberler’s observation. In consequence, they (read: the Fed) fly blind. Yes, going into the 2008-2009 storm, the Fed was flying blind. Recall that Bernanke’s dashboard, had no exchange-rate gauges!
6. This resulted in a disaster. Indeed, the error of 2008 was to engage in a very tight monetary policy. If Bernanke had an exchange-rate gauge, he would have seen the dollar soar against the euro by 33% from June 2008 to late October 2008. As the USD soared, oil prices plummeted, falling by about the same percentage as the USD appreciated against the euro. And oil prices plunged from $148/bbl to $35/bbl. Annual inflation measured by the CPI was 5.6% in July 2008. By February 2009, negative annual CPI numbers were being registered. So much for those alleged long and variable lags between changes in monetary policy and inflation.
7. But, we are left today with the Deputy Governor of Sweden’s Riksbank and inflation targeting guru Lars Svensson’s words: “My view is that the crisis was largely caused by factors that had very little to do with monetary policy.” What nonsense.
8. Never mind. With the central bankers’ grip on the professional press, we are left with inflation targeting too. Indeed, that nostrum is even more entrenched than it was before the crisis.
Takeaway #8
Foreign Exchange Comment I:
Now for some remarks about exchange rates that support the exchange-rate fixity espoused by Forbes and Ames. Many think current account surpluses and deficits are the product of misaligned exchange rates. Well, truths in economics often boil down to accounting principles that are as immutable as the laws of physics. Current account deficits are, for example, equal to the sum of two quantities: the excess of private investment over savings and the government deficit. Exchange rates have little to do with current account deficits.
Takeaway #9
Foreign Exchange Comment II:
Forget the D.C. chatter about currency manipulation. The U.S. Treasury (UST), as well as everyone else, cannot even define currency manipulation. That is why the UST has never formally branded China a currency manipulator. Fortunately, during the 1997-2004 period, the RMB/USD rate was marked by fixity. And, as the accompanying table shows, the RMB link to the USD was very good for inflation and growth in China. This link was also good for the global economy.
Takeaway #10
Foreign Exchange Comment III:
According to economic folklore, Milton Friedman only advocated floating exchange rate regimes because they are the only free market mechanisms for foreign exchange. False. In principle and in many real-world cases, Friedman backed currency unification and fixed exchange rates. A review of Friedman’s exchange-rate taxonomy explains why:
As for cases when Friedman endorsed currency boards, I will mention two. In 1992, I co-authored a book with Lars Jonung and Kurt Schuler, Monetary Reform for a Free Estonia. It carries the following dust jacket endorsement by Friedman: “A currency board such as that proposed by Hanke, Jonung, and Schuler is an excellent system for a country in Estonia’s position.” Friedman also embraced Hong Kong’s fixed exchange rate, writing in 1994, “The experience of Hong Kong clearly indicates that a particular country like Hong Kong does not need a central bank. Indeed, it has been very fortunate that it has not had one. The currency board system that was introduced in 1983 has worked very well for HK and I believe it is desirable that it be continued.”
A currency-board fixed exchange-rate regime is a free market system. Friedman understood this. With a currency board, the exchange rate between domestic money issued by the board and the board’s reserve, or anchor, currency is fixed, and the two currencies are fully convertible. So, the supply curve for domestic money is infinitely elastic. This means that the currency board will supply more domestic money as long as people wish to freely exchange anchor currency money for domestic money at the fixed exchange rate. In consequence, with currency board, the quantity of domestic money in the economy is determined by changes in the demand for domestic money. The quantity of domestic high powered money is, therefore, freely determined by changes in the demand for domestic money. Such a system operates automatically to determine the quantity of domestic base money in the system. Indeed, it does so without a monetary policy.
Takeaway #11
When it comes to exchange rates, more currency unification, please. The world’s two most important currencies — the dollar and the euro — should, via formal agreement, trade in a zone ($1.20 – $1.40 to the euro, for example). The European Central Bank would be obliged to maintain this zone of stability by defending a weak dollar via dollar purchases. Likewise, the Fed would be obliged to defend a weak euro by purchasing euros. The East Asian dollar bloc, which was torpedoed during the 2003 Dubai Summit, should be resurrected with the yuan and other Asian currencies tightly linked to the greenback. Many other countries (Brazil and Venezuela, for example), should adopt currency boards linked to either the dollar or euro. Or, they should simply “dollarize” by adopting a foreign currency (like the dollar, for example) as their own.
Yes. Why not dollarize? It works. Just look at Ecuador, El Salvador and Panama. They are all dollarized, and, based on my Misery Index, they are the three least miserable countries in Latin America. Dollarization, like currency boards, provides discipline. This discipline leads to prosperity and less misery.
Comments Off on Remarks on Money: How the Destruction of the Dollar Threatens the Global Economy — and What We Can Do about It by Steve Forbes and Elizabeth Ames
In late April of this year, the Bureau of Economic Analysis (BEA) at the U.S. Department of Commerce announced that it would start reporting a new data series as part of the U.S. national income accounts. In addition to gross domestic product (GDP), the BEA will start reporting gross output (GO). This announcement went virtually unnoticed and unreported — an unfortunate, but not uncommon, oversight on the part of the financial press. Yes, GO represents a significant breakthrough.
A brief review of some history of economic thought will show just why GO is a big deal. The Classical School of economics prevailed roughly from Adam Smith’s Wealth of Nations time (1776) to the mid-19th century. It focused on the supply side of the economy. Production was the wellspring of prosperity.
“Reporting gross output (GO) is a big deal.”
The French economist J.-B. Say (1767-1832) was a highly regarded member of the Classical School. To this day, he is best known for Say’s Law of markets. In the popular lexicon — courtesy of John Maynard Keynes — this law simply states that “supply creates its own demand.” But, according to Steven Kates, one of the world’s leading experts on Say, Keynes’ rendition of Say’s Law distorts its true meaning and leaves its main message on the cutting room floor.
Say’s message was clear: a demand failure could not cause an economic slump. This message was accepted by virtually every major economist, prior to the publication of Keynes’ General Theory in 1936. So, before the General Theory, even though most economists thought business cycles were in the cards, demand failure was not listed as one of the causes of an economic downturn.
All this was overturned by Keynes. Kates argues convincingly that Keynes had to set Say up as a sort of straw man so that he could remove Say’s ideas from the economists’ discourse and the public’s thinking. Keynes had to do this because his entire theory was based on the analysis of demand failure, and his prescription for putting life back into aggregate demand — namely, a fiscal stimulus (read: lower taxes and/or higher government spending).
Keynes was wildly successful. With the publication of the General Theory, the supply side of the economy almost entirely vanished. It was replaced by aggregate demand, which was faithfully reported in the national income accounts. In consequence, aggregate demand has dominated economic discourse and policy ever since.
Among other things, Keynes threw economics into the sphere of macro economics. It is here where economic aggregates are treated as homogenous variables for purposes of analysis. But, with such innocent looking aggregates, there lurks a world of danger. Indeed, because of the demand-side aggregates that Keynes’ analysis limited us to, we were left with things like the aggregate sizeof consumption and government spending. The structure of the economy — the supply side — was nowhere to be found.
Yes, there were various rear-guard actions against this neglect of the supply side. Notable were economists from the Austrian School of Economics,such as Nobelist Friedrich Hayek. There were also devotees of input-out put analysis, like Nobelist Wassily Leontief. He and his followers stayed away from grand macroeconomic aggregates;they focused on the structure of the economy. There were also branches of economics — like agricultural economics– that were focused on production and the supply side of the economy. But,these fields never pretended to be part of macroeconomics.
Then came the supply-side revolution in the 1980s. It was associated with the likes of Nobelist Robert Mundell. This revolution was carried out, in large part, on the pagesof The Wall Street Journal, where J.-B.Say reappeared like a phoenix. The Journal’s late-editor Robert Bartley recounts the centrality of Say in his book The Seven Fat Years: And How to Do It Again (1992) “I remember Art Laffer telling me I had to learn Say’s Law. ‘That’s what I believe in’, he professed. ‘That’s what you believe in.’”
It is worth mentioning that the onslaught by Keynes on Say was largely ignored by many economic practitioners who attempt to anticipate the course of the economy. For them,the supply side of the economy has always received their most careful and anxious attention. For example, the Conference Board’s index of leading indicators for the U.S. economy is predominantly made up of supply-side indicators. Bloomberg’s supply-chain analysis function (SPLC) is yet another tool that indicates what practitioners think about when they conduct economic and financial analyses.
But, when it comes to the public and the debate about public policies, there is nothing quite like official data. So, until now, demand-side GDP data produced by the government has dominated the discourse. With GO, GDP’s monopoly will be broken as the U.S. government will provide official data on the supply side of the economy and its structure. GO data will complement, not replace, traditional GDP data. That said, GO data will improve our understanding of the business cycle and also improve the quality of the economic policy discourse.
So, what makes up the conventional measure of GDP and the new GO measure? And what makes up the gross domestic expenditures (GDE)measure, a more comprehensive, close cousin of GO? The accompanying two tables answer those questions. And for readers who are more visually inclined,bar charts for the two new metrics — GO and GDE — are presented.
Now, it’s official. Supply-side (GO) and demand-side (GDP) data are both provided by the U.S. government. How did this counter revolution come about? There have been many counter revolutionaries, but one stands out: Mark Skousen of Chapman University. Skousen’s book The Structure of Production, which was first published in 1990, backed his advocacy with heavy artillery. Indeed, it is Skousen who is, in part, responsible for the government’s move to provide a clearer, more comprehensive picture of the economy, with GO. And it is Skousen who is solely responsible for calculating GDE.
These changes are big, not only conceptually, but also numerically. Indeed, in 2013 GO was 76.4% larger, and GDE was 120.4% larger, than GDP. Why? Because GDP only measures the value of all final goods and services in the economy. GDP ignores all the intermediate steps required to produce GDP. GO corrects for most of those omissions. GDE goes even further, and is more comprehensive than GO.
Even though the always clever Keynes temporarily buried J.-B. Say, the great Say is back. With that, the relative importance of consumption and government expenditures withers away (see the accompanying bar charts). And, yes, the alleged importance of fiscal policy withers away, too.
Contrary to what the standard textbooks have taught us and what that pundits repeat ad nauseam, consumption is not the big elephant in the room. The elephant is business expenditures.
On August 14, 1997, shortly after the Thai baht collapsed on July 2, Indonesia floated the rupiah. This prompted Stanley Fischer, Deputy Managing Director of the International Monetary Fund, to proclaim that “the management of the IMF welcomes the timely decision of the Indonesian authorities. The floating of the Rupiah, in combination with Indonesia’s strong fundamentals, supported by prudent fiscal and monetary policies, will allow its economy to continue its impressive economic performance of the last several years.”
Contrary to the IMF’s expectations, the rupiah did not float on a sea of tranquility. It plunged from 2,700 rupiahs per U.S. dollar at the time of the float to lows of nearly 16,000 rupiahs per U.S. dollar in 1998. Indonesia was caught up in the maelstrom of the Asian crisis.
By late January 1998, President Suharto realized that the IMF medicine was not working and sought a second opinion. In February, I was invited to offer that opinion and began to operate pro bono as Suharto’s Special Counselor. Although I did not have any opinions on the Suharto government, I did have definite ones on the matter at hand. After the usual open discussions at the President’s private residence, I proposed as an antidote an orthodox currency board in which the rupiah would be fully convertible into the U.S. dollar at a fixed exchange rate. On the day that news hit the street, the rupiah soared by 28 percent against the U.S. dollar. These developments infuriated the U.S. government and the IMF.
Ruthless attacks on the currency board idea and the Special Counselor ensued. Suharto was told in no uncertain terms – by both the President of the United States, Bill Clinton, and the Managing Director of the IMF, Michel Camdessus – that he would have to drop the currency board idea or forego $43 billion in foreign assistance. He was also aware that his days as President would be numbered if the rupiah was not stabilized.
Economists jumped on the bandwagon too. Every half-truth and non-truth imaginable was trotted out against the currency board idea. In my opinion, those oft-repeated canards were outweighed by the full support for an Indonesian currency board (which received very little press) by four Nobel Laureates in Economics: Gary Becker, Milton Friedman, Merton Miller, and Robert Mundell.
Why all the fuss over a currency board for Indonesia? Merton Miller understood the great game immediately. As he wrote when Mrs. Hanke and I were in residence at the Shangri-La Hotel in Jakarta, the Clinton administration’s objection to the currency board was “not that it wouldn’t work but that it would, and if it worked, they would be stuck with Suharto.” Much the same argument was articulated by Australia’s former Prime Minister Paul Keating: “The United States Treasury quite deliberately used the economic collapse as a means of bringing about the ouster of President Suharto.” Former U.S. Secretary of State Lawrence Eagleberger weighed in with a similar diagnosis: “We were fairly clever in that we supported the IMF as it overthrew [Suharto]. Whether that was a wise way to proceed is another question. I’m not saying Mr. Suharto should have stayed, but I kind of wish he had left on terms other than because the IMF pushed him out.” Even Michel Camdessus could not find fault with these assessments. On the occasion of his retirement, he proudly proclaimed: “We created the conditions that obliged President Suharto to leave his job.”
To depose Suharto, two deceptions were necessary. The first involved forging an IMF public position of open hostility to currency boards. This deception was required to convince Suharto that he was acting heretically and that, if he continued, it would be costly. The IMF’s hostility required a quick about-face: Less than a year before the Indonesian uproar, Bulgaria (where I was President Stoyanov’s advisor) had installed a currency board on July 1, 1997 with the enthusiastic endorsement of the IMF, and Bosnia and Herzegovina (where I advised the government on currency board implementation) had followed suit under the mandate of the Dayton Peace Agreement and with IMF support on August 11, 1997.
Shortly after Suharto departed, the IMF’s currency board deception became transparent. On August 28, 1998, Michel Camdessus announced that the IMF would give Russia the green light if it chose to adopt a currency board. This was followed on January 16, 1999 with a little-known meeting in Camdessus’ office at the IMF headquarters in Washington, D.C. The assembled group included IMF top brass, Brazil’s Finance Minister Pedro Malan, and the central bank’s Director of Monetary Policy Francisco Lopes. It was at that meeting that Camdessus suggested that Brazil adopt a currency board.
The second deception involved the widely-circulated story that I had proposed to set the rupiah’s exchange rate at an overvalued level so that Suharto and his cronies could loot the central bank’s reserves. This take-the-money-and-run scenario was the linchpin of the Clinton administration’s campaign against Suharto. It was intended to “confirm” Suharto’s devious intentions and rally international political support against the currency board idea and for Suharto’s ouster.
The overvaluation story was enshrined by the Wall Street Journal on February 10, 1998. TheJournal reported that Peter Gontha had summoned me to Jakarta and that I had prepared a working paper for the government recommending that the rupiah-U.S. dollar exchange rate be set at 5,500. This was news to me. I did not meet, nor know of, Peter Gontha, nor had I authored any reports about Indonesia or proposed an exchange rate for the rupiah.
I immediately attempted to have this fabrication corrected. It was a difficult, slow, and ultimately unsatisfactory process. Although the Wall Street Journal reluctantly published a half-baked correction on February 14, the damage had been done.
The Journal’s original fabrication (or some variant of it) was repeated in virtually every major magazine and newspaper in the world, and it continues to reverberate to this day, even in so-called scholarly books and journals. For example, in his 2000 memoir, From Third World to First, The Singapore Story: 1965-2000, Lee Kuan Yew asserts that “in early February 1998, Bambang, the president’s son, brought Steve Hanke, an American economics professor from Johns Hopkins University, to meet Suharto to advise him that the simple answer to the low exchange value of the rupiah was to install a currency board.” This bit of misinformation was a surprise, since I have never had any contact with Bambang Suharto. But it is not just politicians who fail to “fact check” their assertions. Theodore Friend’s 2003 tome, Indonesian Destinies, misspells my name and then proceeds to say that I “counseled the [Suharto] family to peg the exchange rate at 5000.”
Setting the record straight has been complicated by the official spinners at the IMF. Indeed, they have been busy as little bees rewriting monetary history to cover up the IMF’s mistakes, and Indonesia represents one of its biggest blunders. To this end, the IMF issued a 139-page working paper “Indonesia: Anatomy of a Banking Crisis: Two Years of Living Dangerously 1997–99” in 2001. The authors include a “politically correct” version of the currency board episode asserting, among other things, that I counseled President Suharto to set the rupiah-dollar exchange rate at 5000. This pseudoscholarly account, which includes 115 footnotes, fails to document that assertion because it simply cannot be done. That official IMF version of events also noticeably avoids referencing any of my published works or interviews based on my Indonesian experience.
That episode and its manipulations are not unique in the political world. It is useful, though, after time and events unfold, to set facts straight in order to understand the situation then and now. Other countries, such as China, are currently experiencing some of the vagaries of similar treatments. Let’s hope that they and all of us do not have to pay later for such blunders and mistakes.
Comments Off on On the Fall of the Rupiah and Suharto
The Great Recession grinds on. And as it does, politicians of all stripes ask, usually behind closed doors, “Just how miserable are our citizens?” The chattering classes offer a variety of opinions. As it turns out, there is a straightforward way to measure what is termed the misery index.
The late Arthur Okun, a distinguished economist who served as chairman of the President’s Council of Economic Advisers during President Johnson’s administration, developed the original misery index for the United States. Okun’s index is equal to the sum of the inflation and unemployment rates.
“The misery index pours cold water on the current critique of free markets and fiscal austerity. ”
Harvard Professor Robert Barro amended the misery index by also including the 30-year government bond yield and the output gap for real GDP. Barro used his index to measure the change in misery during a president’s term.
From these metrics, we would anticipate that if there were a high level of misery in a country, and the current politicians increased the level of misery, then this increase would be borne out by looking at the polls. In other words, we expect citizens to be aware of misery, and approve or disapprove accordingly.
The data in the misery index chart speak loudly. Contrary to left-wing dogma, the Reagan “free-market years, ” were very good ones. And the Clinton years of Victorian fiscal virtues– when President Clinton proclaimed in his January 1996 State of the Union address: “the era of big government is over” — were also very good ones.
The misery index pours cold water on the current critique of free markets and fiscal austerity — a critique that has taken on the characteristics of a religion embraced without investigation. Indeed, it makes one bothered to subject their ideas to a reality check.
But does the misery index accurately measure misery? Well, when looking at the relationship between a president’s approval ratings and the misery index, the truth comes into sharp relief. If the economy is doing poorly during a president’s term, the likelihood for this president to have a low approval rate is high, and vice versa (correlation of -0. 54). By examining the misery index ranking in the United States and the poll ratings of U. S. Presidents (compare the first two charts), the correlation becomes apparent.
For most people, their quality of life is important. Constituents prefer lower inflation rates, lower unemployment rates, lower lending rates, and higher GDP per capita. By combining the poll rankings and the misery index, we calculate a standardized ranking from one president to another (see chart on the right). This type of analysis is not limited to the United States. The misery index concept can be applied to any country where suitable data exist. A misery index — a simple sum of inflation, lending rates, and unemployment rates, minus year-on-year per capita GDP growth — is used to construct a ranking for 90 countries (see the PHOTO misery index scores, page 24).
When measured by the misery index, Venezuela holds the ignominious top spot, with an index value of 79. 4. But, that index value, as of 31 December 2013, under states the level of misery because it uses the official annual inflation rate of 56. 2%. In fact, I estimate that Venezuela’s annual implied inflation rate at the end of last year was 278%. That rate is almost five times higher than the official inflation rate. If the annual implied inflation rate of 278% is used to calculate Venezuela’s misery index, the index jumps from 79. 4 to 301, indicating that Venezuela is in much worse shape than suggested by the official data.
Why is there such a huge gap between the official inflation rate and my estimate of the true inflation rate? Venezuela imposes a complex web of government price controls. In consequence, when one observes prices for the items that comprise Venezuela’s price index, many of the prices will be those mandated by the government, not the market. So, the inflation rates for the basket will be artificially low. The official inflation reading will be for what is termed “suppressed” inflation.
And that’s not the end of the story. Indeed, with binding price controls, many goods in the official price index basket are nowhere to be found. And when it comes to price-control induced shortages, there is no better authority than Milton Friedman:
“We economists don’t know much, but we do know how to create a shortage. If you want to create a shortage of tomatoes, for example, just pass a law that retailers can’t sell tomatoes for more than two cents perpound. Instantly you’ll have a tomato shortage. It’s the same with oil or gas.”
The accompanying chart (page 25) confirms Friedman’s observation. In Venezuela, 28% of basic products are not available.
When price controls and shortages prevail, how do we measure the true rate of inflation — “open” inflation?
Binding price controls spawn black markets. Many of the goods and services subject to controls migrate to black markets. For example, in German-occupied Poland during World War II, price controls prevailed and the black market flourished. Everything from basic food and industrial goods to foreign exchange traded on black markets. There was even an illegal stock market. The scale of the black markets was impressive, with 80% of all food being supplied via illegal markets.
One way to estimate the rate of true, open inflation, in cases such as Venezuela’s, would be to track down the free-market prices — including the black-market prices — for all goods in the official basket. But such a procedure would be very difficult, if not virtually impossible, to implement. That is why no country has ever accomplished such a herculean task.
As an alternative, I have developed a procedure for estimating the true, open inflation rate for an economy in the grip of high inflation and price controls. While it is impractical to determine the free-market (read: black-market) prices for all items in an official basket, it is often quite easy to observe the free, black-market exchange rate. Since this is the most important price in the economy, changes in the free, black-market exchange rate can be used to estimate the true, open inflation rate for an economy.
By using the most important free-market price in Venezuela — the black — market bolivar / U. S. dollar rate — we can accurately estimate Venezuela’s annual open inflation rate (see the accompanying chart). At the end of 2013, this true, open inflation rate was five times higher than the official rate. And the associated true misery index was 301, not 79. 4.
It’s not surprising that President Maduro’s popularity has plunged 16 percentage points since he took office in April 2013. And if that wasn’t bad enough, politically-motivated street violence has claimed 39 lives since mid-February 2014.
President Hollande’s new line up is loaded with contradictions. Not a good sign.
Just take Prime Minsiter Valls’ assertion that, when it comes to economics, he is a clone of Bill Clinton. For anyone familiar with the facts, this claim is bizarre, if not delusional.
When it comes to France’s fiscal stance, the Valls’ government is fighting austerity tooth and nail. Indeed, the Socialist government is seeking greater leeway from the European Commission (read: Germany) over European targets for reducing France’s stubborn budget deficit. With French government expenditures accounting for a whopping 56.6 percent of GDP, it’s truly astounding that the government is reluctant to engage in a bit of belt tightening.
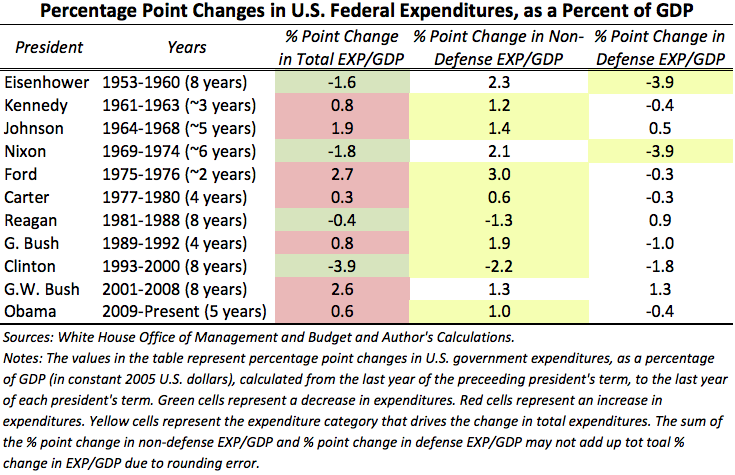
This brings us back to Valls’ self-promotion — namely, to compare himself to Bill Clinton. For a reality check, a review of the fiscal records of U.S. Presidents is most edifying. Let’s take a look at Clinton.
The Clinton presidency was marked by the most dramatic decline in the federal government’s share of the U.S. economy since 1952, Harry Truman’s last full year in office. The Clinton administration reduced the relative size of government by 3.9 percentage points. Since 1952, no other president has even come close. At the end of his second term, President Clinton’s big squeeze left the size of government, as a percent of GDP, at 18.2 percent.
What is noteworthy is that the squeeze was not only in defense spending, but also in non-defense expenditures. Indeed, the non-defense squeeze accounted for 2.2 percentage points of President Clinton’s 3.9 total percentage point reduction in the relative size of the federal government. Since 1952, the only other President who has been able to reduce non-defense expenditures was Ronald Reagan.
During his presidency, Clinton squeezed and squeezed hard, and his rhetoric matched his actions. Recall that in his 1996 State of the Union address, he declared that “the era of big government is over.”
When it comes to fiscal rhetoric and record, it’s hard to imagine that Manuel Valls will be able — even in his wildest dreams — to match Bill Clinton, the King of the Fiscal Squeeze.
President Obama set the chattering classes abuzz after his recent unilateral announcement to raise the minimum wage for newly hired Federal contract workers. During his State of the Union address in January, he sang the praises for his decision, saying that “It’s good for the economy; it’s good for America.” As the worldwide economic slump drags on, the political drumbeat to either introduce minimum wage laws (read: Germany) or increase the minimums in countries where these laws exist — such as Indonesia — is becoming deafening. Yet the glowing claims about minimum wage laws don’t pass the most basic economic tests. Just look at the data from Europe (see the accompanying chart).
Sources: Eurostat (Unemployment rates – Annual Average),
and calculations by Prof. Steve H. Hanke, The Johns Hopkins University. Note: The averages displayed in the chart are arithmetic means.
There are seven European Union (E.U.) countries in which no minimum wage is mandated (Austria, Cyprus, Denmark, Finland, Germany, Italy, and Sweden). If we compare the levels of unemployment in these countries with E.U. countries that impose a minimum wage, the results are clear. A minimum wage leads to higher levels of unemployment. In the 21 countries with a minimum wage, the average country has an unemployment rate of 11.8%. Whereas, the average unemployment rate in the seven countries without mandated minimum wages is about one third lower — at 7.9%.
This point is even more pronounced when we look at rates of unemployment among the E.U.’s youth — defined as those younger than 25 years of age (see the accompanying chart).
Sources: Eurostat (Unemployment rates – Annual Average; Age: Less than 25 years),
and calculations by Prof. Steve H. Hanke, The Johns Hopkins University. Note: The averages displayed in the chart are arithmetic means.
In the twenty-one E.U. countries where there are minimum wage laws, 27.7% of the youth demographic — more than one in four young adults — was unemployed in 2012. This is considerably higher than the youth unemployment rate in the seven E.U. countries without minimum wage laws — 19.5% in 2012 — a gap that has only widened since the Lehman Brothers collapse in 2008.
So, minimum wage laws — while advertised under the banner of social justice — do not live up to the claims made by those who tout them. They do not lift low wage earners to a so-called “social minimum”. Indeed, minimum wage laws — imposed at the levels employed in Europe — push a considerable number of people into unemployment. And, unless those newly unemployed qualify for government assistance (read: welfare), they will sink below, or further below, the social minimum.
As Nobelist Milton Friedman correctly quipped, “A minimum wage law is, in reality, a law that makes it illegal for an employer to hire a person with limited skills.”
Dr. Jens Weidmann, President of Germany’s Bundesbank, must have heard Prof. Friedman and looked at these European data before he took on Chancellor Angela Merkel for proposing the introduction of a minimum wage law in Germany. In short, Dr. Weidmann said that this would damage Germany’s labor market and be a German job killer. He is right.
And, executives surveyed in the recently released Duke University/CFO Magazine Global Business Outlook Survey agree, too. Indeed, Chief Financial Officers from around the world were interviewed and a significant number of them concurred: a minimum wage increase in the United States from the current $7.25/hour to President Obama’s proposed $10.10/hour — would kill U.S. jobs. The accompanying table shows what the CFOs had to say.
Perhaps, Prof. Friedman said it best when he concluded that “The real tragedy of minimum wage laws is that they are supported by well-meaning groups who want to reduce poverty. But the people who are hurt most by high minimums are the most poverty stricken.”
High mandated minimum wages will throw people out of work and onto the welfare rolls in cases where unemployment benefits exist. When it comes to welfare payments, they obey the laws of economics, too. Indeed, if something — like unemployment — is subsidized, more of it will be produced.
Sources: CFOSurvey.org. Prepared by: Prof. Steve H. Hanke, The Johns Hopkins University.
When the data on unemployment benefits speak, they tell us that if the unemployed receive unemployment benefits, the chances that they will become employed are reduced. Those data also show that the probability of an unemployed worker finding employment increases dramatically the closer an unemployed worker comes to the termination date for receipt of his unemployment benefits. In short, when the prospect of losing welfare benefits raises its head, unemployed workers magically tend to find work.
The most important lesson to take away from allowing the minimum wage and unemployment benefit data to talk is that abstract notions of what is right, good and just should be examined from a concrete, operational point of view. A dose of reality is most edifying.
This article appeared in the April 2014 issue of Globe Asia.
Comments Off on Let the Data Speak: The Truth Behind Minimum Wage Laws
When Communism inevitably and finally collapsed, Bulgaria’s economy was a basket case – behind almost all other communist basket cases, including Ukraine’s. Indeed, Bulgaria defaulted on its debt in 1990. By February 1991, Bulgaria had broken out in a bout of hyperinflation, with the inflation rate at 123% per month. And in February 1997, Bulgaria experienced the agonies of hyperinflation again, with the inflation rate reaching 242% per month.
As he looked into the abyss, President Petar Stoyanov decided against taking the plunge and appointed me as his advisor in January 1997. I immediately prescribed a currency board system to put an end to Bulgaria’s malady, something I had laid out for Bulgaria back in 1991 (Steve H. Hanke and Kurt Schuler, Teeth for the Bulgarian Lev: A Currency Board Solution. Washington, D.C.: International Freedom Foundation, 1991.).
Bulgaria installed a currency board in July 1997. The lev was backed 100% by German marks and traded freely at a fixed rate of 1000 leva to 1 mark. Inflation and interest ratesfell like stones. The economy stabilized, and the Bulgarians learned that, even though stability might not be everything, everything is nothing without stability. Discipline at last.
Yes, the main feature of a currency board is the fiscal and financial discipline that it provides. No more running to the central bank for a fiscal bailout. A currency board ties the hands of those meddlesome monetary authorities. And forget the silly theoretical and obscure arguments made by economists who don’t embrace fixed exchange rates. A currency board regime is all about discipline.
As we watch Ukraine melt down once again, we can see what could have been (and what could be) if Ukraine would have only embraced a system of discipline (read: currency board) – like Bulgaria did in 1997. The following table tells the tale:
Bulgaria versus Ukraine
Country
GDP per Capita (USD)
Fiscal Balances %GDP
Current Account Balances %GDP
General Govt. Gross Debt %GDP
Gross Borrowing Needs %GDP
Import Coverage Ratio (FX Reserves / Imports)
W.B. Ease of Doing Business 2014 Rank
Bulgaria
$7,623
-1.9%
1.5%
16.0%
2.6%
6.7
58
Ukraine
$4,011
-8.7%
-8.9%
42.8%
11.0%
1.9
112
Comments Off on Bulgaria’s Currency Board versus Ukraine’s Chaos
In 2008, Bitcoin was mysteriously introduced to the world in an obscure, technical paper written under the pseudonym Satoshi Nakamoto. By late 2013, the financial press was filled with reportage on Bitcoin and its dramatic price increase.
Well ahead of Satoshi Nakamoto, Nobelist Milton Friedman, champion of free market economics and noted expert on money and banking, anticipated the coming of digital currencies, and foresaw the potential impacts that they would have on finance and economics.
I think that the Internet is going to be one of the major forces for reducing the role of government. The one thing that’s missing, but that will soon be developed, is a reliable e-cash, a method whereby on the Internet you can transfer funds from A to B without A knowing B or B knowing A. The way I can take a $20 bill hand it over to you and then there’s no record of where it came from.
You may get that without knowing who I am. That kind of thing will develop on the Internet and that will make it even easier for people using the Internet. Of course, it has its negative side. It means the gangsters, the people who are engaged in illegal transactions, will also have an easier way to carry on their business.
Prof. Friedman’s anticipation of Bitcoin is truly remarkable. He even understood the concept well enough to anticipate something like the Silk Road scandal involving illegal Bitcoin transactions.
In April 2013, Nathaniel Popper of The New York Times reported on Bitcoin in an article titled “Digital Money is Gaining Champions in the Real World”. In his reportage, Popper asked me if I thought Bitcoin had the makings of a speculative mania like the 17th century Dutch tulip bulb frenzy. My response was clear and unambiguous: “To say highly speculative would be the understatement of the century.”
Subsequently, the price action in Bitcoin confirms my diagnosis (see the following chart). In January 2013, one could buy a Bitcoin for about $13. By late November, one Bitcoin would have set a buyer back over $1100. And what about Bitcoin’s price volatility? As shown in the chart, Bitcoin’s volatility is truly fantastic.
While the price currently fluctuates around $600, Bitcoin remains far from secure. Serious discrepancies in price exist even between exchanges. For example, the price of a Bitcoin on the Mt. Gox exchange has fallen by over 50% in the past week, while the price of the exact same Bitcoin on the BitStamp exchange has fallen by only 3% in the same time period.
A hallmark of socialism and interventionism is failure. Venezuela is compelling proof of this, having spent the past half century going down the tubes. Indeed, in the 1950’s, it was one of Latin America’s most well off countries. No more. Now it is a basket case – a failed state that’s descending into chaos.
How could this be? After all, Venezuela’s combined reserves of oil and gas are second only to Iran’s. Well, it might have reserves, but thanks to the wrongheaded policies of President Hugo Chavez, Venezuela is the only major energy producer that has seen its production fall over the past quarter of a century. The following chart tells that dismal tale:
Comments Off on Venezuela’s Plunging Petroleum Production
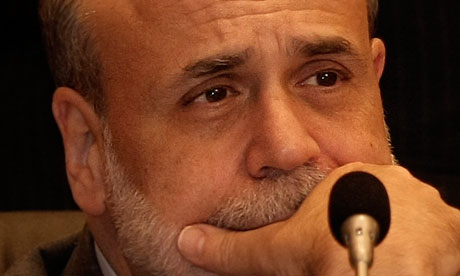
Willem Buiter (“The Fed’s bad manners risk offending foreigners”, Comment, February 5) hits the nail on the head — almost. Yes, the Fed, under the chairmanship of Prof Ben Bernanke, operated as if it were “the central bank of a closed economy”. The absurdities that this led to go further than those articulated by Dr Buiter, however.
For example, the six metrics on Prof Bernanke’s Dashboard (see In Fed We Trust, by David Wessel, p271) did not include the USD/EUR exchange rate — arguably the world’s most important price.
Comments Off on Letter to the Editor: Fed Omitted Most Important Price
Most who have graded Prof. Ben Bernanke’s twelve years at the Federal Reserve have issued marks which range from A to a gentleman’s C. I think those marks are much too generous. Indeed, I think a failing mark would be more appropriate.
In the ramp up to Britain’s Northern Rock bank run in 2007 and the Lehman Brothers’ bankruptcy in September 2008, Bernanke and the Fed created a classic aggregate demand bubble: when final sales to domestic purchasers — a good proxy for aggregate demand — surge well above the trend rate of growth consistent with modest inflation. The Fed also facilitated the spawning of many market-specific bubbles in the housing, equity, and commodity markets. True to form, Fed officials have steadfastly denied any culpability for creating the bubbles that so spectacularly burst during the Panic of 2008-09.
The pre-2008 crisis bubble was set off by the Fed’s liquidity injections which were initially designed to fend off a false deflation scare in late 2002. That’s when then-Fed Governor Bernanke sounded a deflation alarm in a dense and noteworthy speech before the National Economists Club. Bernanke convinced his Fed colleagues that a deflation danger was lurking. As then-Chairman Alan Greenspan put it, “We face new challenges in maintaining price stability, specifically to prevent inflation from falling too low”.
To fight the alleged deflation threat, the Fed pushed interest rates down sharply. By July 2003, the Fed funds rate was at a then-record low of 1 percent, where it stayed for a year. This artificially low interest rate — compared to the natural or neutral rate at that time, in the 3-4 percent range — induced investors to aggressively speculate by chasing yield in “risky” venues and to ramp up their returns by increasing the amount of leverage they applied. These activities generated asset bubbles and created hot-money flows to developing countries.
However, as the accompanying chart shows, the Fed’s favorite inflation target—the consumer price index, absent food and energy prices—increased by only 12.4 percent over the entire 2003–08 (Q3) period. The Fed’s inflation metric signaled “no problems”.
But, as the late Prof. Gottfried Haberler emphasized in 1928, “the relative position and change of different groups of prices are not revealed, but are hidden and submerged in a general [price] index”. Unbeknownst to the Fed, abrupt shifts in major relative prices were underfoot. For any economist worth his salt, these relative price changes should have set off alarm bells. Indeed, sharp changes in relative prices are a signal that, under the deceptively smooth surface of a general price index of stable prices, basic maladjustments are probably occurring. And it is these maladjustments that, according to Haberler, hold the key to Austrian business cycle theory — and, I would add, a key to understanding the current crisis.
Just which sectors realized big swings in relative prices during the last U.S. aggregate demand bubble? Housing prices, measured by the Case-Shiller home price index, were surging, increasing by 45 percent from the first quarter in 2003 until their peak in the first quarter of 2006. Share prices were also on a tear, increasing by 66 percent from the first quarter of 2003 until they peaked in the last quarter of 2007. The most dramatic price increases were in commodities, however. Measured by the Commodity Research Bureau’s spot index, commodity prices increased by 92 percent from the first quarter of 2003 to their pre-Lehman Brothers peak in the second quarter of 2008.
In addition to the bubbles spawned in the U.S., the Fed’s artificially low interest rates set off a wild yield-chasing scramble and leveraging lunacy. This gave rise to bubbles abroad and currency war polemics. The accompanying carry trade chart shows the massive increase in U.S. assets abroad. These were fueled by hot-money flows during the Bernanke years.
Artificial credit-created investment booms sow the seeds of their own destruction. With the Fed funds rate well below the natural rate in 2003, a credit boom was off and running. And as night follows day, a bust was just around the corner. As usual, it was punctuated by bankruptcies and a landscape littered with malinvestments made during the boom.
While operating under a regime of inflation targeting and a floating U.S. dollar exchange rate, Chairman Bernanke also saw fit to ignore fluctuations in the value of the dollar. Indeed, changes in the dollar’s exchange value did not appear as one of the six metrics on “Bernanke’s Dashboard”—the one the chairman used to gauge the appropriateness of monetary policy. Perhaps this explains why Bernanke has been so dismissive of valid questions suggesting that changes in the dollar’s exchange value influence either commodity prices or more broad-based gauges of inflation.
As Nobelist Prof. Robert Mundell — one of the founding fathers of modern supply-side economics — has convincingly argued, changes in exchange rates transmit inflation (or deflation) into economies, and they can do so rapidly. This was the case during the financial crisis.
By ignoring this, Bernanke was flying blind in the initial months of the crisis. In consequence, the Fed failed to stabilize the USD/EUR exchange rate, which swung dramatically in the months surrounding the collapse of Lehman Brothers in September 2008 (see the accompanying table). This in turn created wild swings in the prices of gold and oil. In addition, the annual inflation rate measured by the Consumer Price Index plunged from 5.6% in July 2008 to -2.1% in July 2009. With the demand for greenbacks and safe assets (read: U.S. Treasuries) soaring, the Fed was way too tight and didn’t even know it.
In addition to not displaying the dollar’s exchange rate, Chairman Bernanke’s Dashboard didn’t concern itself with money-supply gauges. For Bernanke, it was all about an inflation target. As long as the Fed hit a designated level of inflation, the Fed could wash its hands of all other responsibilities. As Prof. Lars Svensson, deputy governor of Sweden’s Riksbank — the world’s first central bank — and a well-known pioneer of inflation targeting put it: “My view is that the crisis was largely caused by factors that had very little to do with monetary policy”. What nonsense.
For central bankers, including Bernanke, the name of the game is to blame someone else for the world’s economic and financial troubles. Indeed, as part of the Fed’s blame game, its accusatory finger has been pointed at commercial bankers. The central banking establishment asserts that banks are too risky and dangerous because they are “undercapitalized” and “underregulated”. It is therefore not surprising that the Bank for International Settlements in Basel, Switzerland (the central bankers’ bank) has issued new Basel III capital rules that will bump up banks’ capital requirements. And if that isn’t bad enough, the Fed has embraced many new regulations contained in the Dodd-Frank legislation. All this regulatory zeal has created a credit crunch. This has resulted in a damaging pro-cyclical policy stance in the middle of a slump — just what we don’t need.
But, how could this be? After all, central banks around the world have turned on the money pumps. Shouldn’t this be ratcheting up money supply growth?
The problem is that central banks only produce what Lord John Maynard Keynes referred to in 1930 as “state money”. And state money (also known as base or high-powered money) is a rather small portion of the total “money” in an economy. The commercial banking system produces most of the money in the economy by creating bank deposits, or what Keynes called “bank money”.
Since August 2008, the month before Lehman Brothers collapsed, the supply of state money has more than quadrupled, while bank money has shrunk by 12.1 percent — resulting in an anemic increase of only 4.5 percent in the total money supply (M4) (see the accompanying chart). The public is confused — as it should be. After all, the Fed has embraced contradictory monetary policies. On the one hand, when it comes to state money, the Fed has been ultra-loose. But, on the other hand, when it comes to the largest component of the money supply, bank money, a tight monetary stance has been embraced.
Prof. Bernanke’s days at the Fed have been marked by monetary misjudgments and malfeasance. Since the proof of the pudding should be in the eating, zero stars in the Michelin Guide.
President Obama set the chattering classes abuzz after his unilateral announcement to raise the minimum wage for newly hired Federal contract workers. During his State of the Union address, he sang the praises for his action, saying that “It’s good for the economy; it’s good for America.”[1] Yet this conclusion doesn’t pass the economic smell test; just look at the data from Europe.
There are seven European Union (EU) countries with no minimum wage (Austria, Cyprus, Denmark, Finland, Germany, Italy, and Sweden). If we compare the levels of unemployment in these countries with EU countries that impose a minimum wage, the results are clear – a minimum wage leads to higher levels of unemployment. In the 21 countries with a minimum wage, the average country has an unemployment rate of 11.8%; whereas, the average unemployment rate in the seven nations without a minimum wage is about one third lower – at 7.9%.
Yesterday, in the wake of Tuesday’s State of the Union address,I poured cold water on President Obama’s claimthat a hike in the minimum wage for federal contract workers would benefit the United States’ economy, pointing specifically to unemployment rates in the European Union. The data never lie: EU countries with minimum wage laws suffer higher rates of unemployment than those that do not mandate minimum wages. This point is even more pronounced when we look at rates of unemployment among the EU’s youth – defined as those younger than 25 years of age.
In the twenty-one EU countries where there are minimum wage laws, 27.7% of the youth demographic – more than one in four young adults – was unemployed in 2012. This is considerably higher than the youth unemployment rate in the seven EU countries without minimum wage laws – 19.5% in 2012 – a gap that has only widened since the Lehman Brothers collapse in 2008.