


By Josep Colomer.

Thomas Schelling (1921-2016)
Thomas Schelling was one of the greatest game theorists, Nobel Laureate in 2005, and influential advisor for several U.S. presidents. During the Cold War, he produced several consequential ideas. On the one hand, he supported the Strategic Arms Limitation Talks (SALT) between the USA and the USSR. This initiative fitted the interpretation of the Cold War as a Prisoner’s Dilemma game in which only persistent and repeated rounds of negotiations might lead to a durable agreement. However, as the classical Prisoner’s Dilemma shows, the subsequent treaties were not seriously enforced and the negotiations were abandoned.
On the other hand, Schelling suggested to President Kennedy to establish the ‘hot line’ or ‘red phone’ between the White House and the Kremlin in order to prevent accidents or put them in control if an unintended attack happened before a nuclear war could explode. This rather fitted an alternative interpretation of the Cold War as a Chicken game, in which it may be rational for the attacked player not to retaliate and prevent the biggest catastrophe. Schelling was a main consultant for the movie Dr. Strangelove or How I Learned to Stop Worrying and Love the Bomb, whose most famous and hilarious scene was crafted around that direct phone line between the presidents of the two great powers in conflict. You can see here how the U.S. president (impersonated by Peter Sellers), tries to persuade the Soviet chairman of not counterattacking when several American rockets with nukes had inadvertently departed toward Soviet lands. CLICK
Schelling-inspired Tipping Game of Leadership
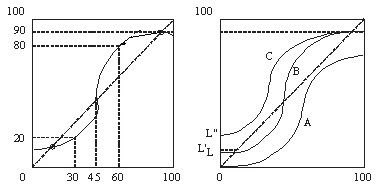
“You can see a graphic representation of the dynamics between leaders and followers in Figure 4.1, which is a variant of the model initially proposed by Nobel Prize–winning economist Thomas Schelling. The horizontal axis represents the number of people expected to participate in a collective action, and the vertical axis represents the number of people who do, in fact, participate. The diagonal forty-five-degree dotted line represents a hypothetical situation in which the number of expected participants is always equal to the number of actual participants. The curve rises to the right, but, in general, since different people have different thresholds of participation, it can be assumed that it has an S-shape.
“In the graph on the left, the starting point of the curve at the bottom-left corner indicates that some people always participate: the “leaders.” At the upper-right corner the solid line of the curve flattens out, since not even an expected participation of 90 percent can move the recalcitrant remaining 10 percent. As an example, for an expected participation of thirty, only twenty participate, which triggers a demobilization process. In contrast, for an expected participation of sixty, eighty actually participate, which generates a participatory process. There are two points of equilibrium, implying, respectively, general demobilization and general action, as indicated by the points near the two extremes of the curve.
“The graph on the right, with curve B representing the original curve, shows what can happen if the number of people always participating increases. This can produce a massive mobilization, as represented by the new curve C, which is always above the forty-five-degree line. In contrast, if a few leaders disappear, the curve starts at zero. The new curve A is always below the forty-five-degree line, which indicates that the number of people participating will always be lower than the number expected, and thus collective action will fail.”
From my textbook The Science of Politics (Oxford U.P.): CLICK