


By David Andolfatto.
For some people, almost everything you need to know about Japanese macroeconomic performance is encapsulated in this diagram:
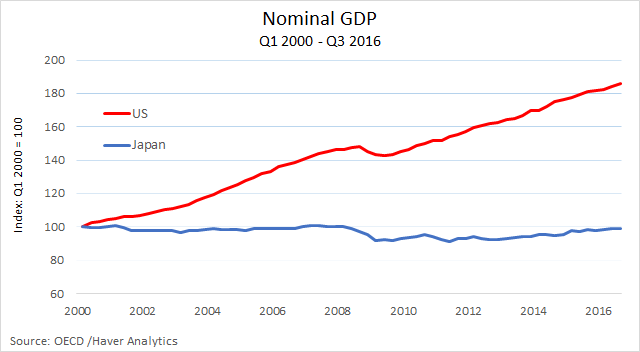
This chart tells us that the Japanese economy produced about the same total yen value of goods and services in 2016 as it did in 2000. By way of contrast, the U.S. economy increased the total dollar value of its production by 80% over the same period of time.
But of course, our material living standards do not depend on the amount of dollars or yen an economy produces–these are just units of measurement. The diagram above would be fine to use as a comparison of macroeconomic performance if the purchasing power of dollars and yen remained stable over time. The following diagram shows that this has not been the case.

If we correct for the falling (rising) purchasing power of the dollar (yen), the first diagram above is altered as follows:

But there’s something else to consider as well. The total income of a country also depends on population size. How much of the difference above is accounted for by different population growth rates? The following diagram provides the answer:

There are a couple of other things I’d like to mention about the comparison above. The growth in per capita RGDP in Japan in the early 2000s largely coincided with the Koizumi era. I’ve written about this here: Another Look at the Koizumi Boom. This growth episode was driven largely by a boom in private investment. It occurred at time of declining government investment spending, a sharp reversal of the the Bank of Japan’s QE program in 2006 and, of course, continued deflation. In the U.S. in the meantime, per capita RGDP grew by almost 9% over the three years 2003-2006. That’s a pretty high rate of growth by historical standards–did people really believe this to be sustainable? (Related post here: Secular Stagnation, Then and Now).
A big concern these days has to do with productivity growth. The value of production per employed person rose at more or less the same rate in both countries from 2000-2008. But labor productivity in Japan has lagged the U.S. since then.

Here is what the picture looks like in terms of production per hour worked (data only available until 2014):

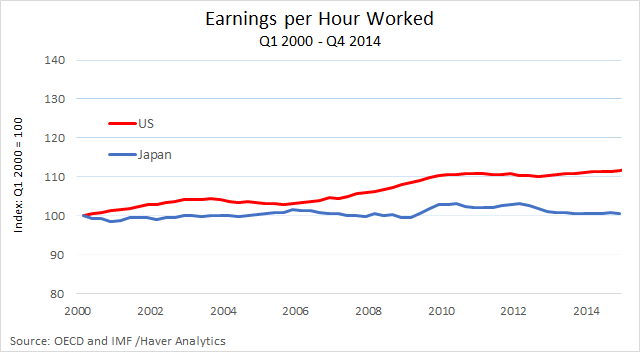

Note: I’m not entirely sure whether bonuses or non-wage benefits are included in the compensation measures used to compute real wages above. Assuming that these measures are roughly comparable, the divergence between the two series is really quite striking. In Japan, in particular, while labor productivity has generally been rising, the compensation to labor has essentially flat lined. I suspect that some of the post 2014 productivity and wage dynamic for Japan may be related to the increase in the employment of low-wage workers.
Prime Minister Shinzo Abe’s policy reforms (Abenomics) are motivated by a desire to increase long-run economic growth (RGDP or per capita RGDP). It’s not clear to me how monetary policy is supposed to help in this endeavor. I do not believe that achieving the 2% inflation target will have any significant consequences for real economic growth. (And in any case, I do not think the target is even feasible given present circumstances, see: The Failure to Inflate Japan.) On the fiscal policy front, I think the April VAT increase was a mistake–I do not think Japan’s fiscal situation is as dire as many make it out to be (see previous link). The third of Abe’s arrows–structural reform–seems like the only real hope. Some of these reforms are evidently targeted at relaxing restrictions on immigrant labor. But it’s unlikely in my view that this will do much to mitigate the effects of Japan’s aging (and declining) population. And it’s not entirely clear what effect the proposed reforms will have on Japan’s stagnating real wages.