


Posts by DonnaWelles:
An Inventory of South American Demographics
September 1st, 2016
By Donna Welles.
Venezuela and Brazil are struggling currently with political upheaval. The Venezuelan opposition party has announced a large march this week protesting the government of President Nicolas Maduro and the President of Brazil, Dilma Rousseff, has been impeached by the Brazilian Senate.
South of Venezuela and Brazil are four smaller countries that might be affected by this political turmoil. These are Peru, Bolivia, Paraguay, and Uruguay. Each of these four countries currently experiences a trade deficit with the People’s Republic of China. Trade deficits can lead to political turmoil and so it is an appropriate time to inventory social economic indicators in Peru, Bolivia, Paraguay, and Uruguay.
Peru has the largest population and Uruguay has the smallest population. Peru has a total of 32m people, Bolivia has 11m people, Paraguay has 7m people, and Uruguay has 4m people. Peru has the largest city and Uruguay reported the smallest figure for largest city. Peru has a city of 10m people, Paraguay has a city of 3m people, Bolivia has a city of 2m people, and Uruguay has a city of 2m people.
Uruguay has the longest life expectancy and Bolivia has the shortest life expectancy. Uruguay has a life expectancy of 77 years, Peru has a life expectancy of 75 years, Paraguay has a life expectancy of 73 years, and Bolivia has a life expectancy of 68 years.
Peru has the largest land area and Uruguay has the smallest land area. Peru has a land area of 1.3m square km, Bolivia has a land area of 1.1m square kilometers, Paraguay has a land area of 400,000 square km, and Uruguay has a land area of 200,000 km. Lima is the capital of Peru, Asuncion is the capital of Paraguay, La Paz is the capital of Bolivia, and Montevideo is the capital of Uruguay.
Comments Off on An Inventory of South American Demographics
Nigerian Energy and the Commodities Markets
August 24th, 2016By Donna Welles.

Nigeria, Togo, Benin, and Ghana all are having to defend their natural resources because the commodities markets are out of alignment and not enough money is being paid in exchange for energy or metals. Nigeria and Ghana have valuable energy reserves and Ghana additionally has metals. Togo and Benin are small countries in between them.
Nigerian petroleum refineries are not operating at peak efficiency and the Nigerian Government is sometimes confronted by a hostile private sector. All four countries have ports on the Atlantic Ocean. West African countries have capital cities that are also ports and some have capital cities that are inland.
Abuja is the capital of Nigeria and it is inland, Accra is the capital of Ghana and it is a port, Cotonou is the capital of Benin and it is a port, and Lome is the capital of Togo and it is a port.
Nigeria has a GDP of $569b USD, Ghana has a GDP of $39b USD, Benin has a GDP of $10b USD, and Togo has a GDP of $5b USD. Nigeria has a population of 177m people, Ghana has a population of 27m people, Benin has a population of 11m people, and Togo has a population of 7m people.
In terms of military personnel neither Benin nor Togo have armies larger than 10,000 soldiers. Ghana has an army of 16,000 soldiers and Nigeria has an army of 162,000 soldiers.
Comments Off on Nigerian Energy and the Commodities Markets
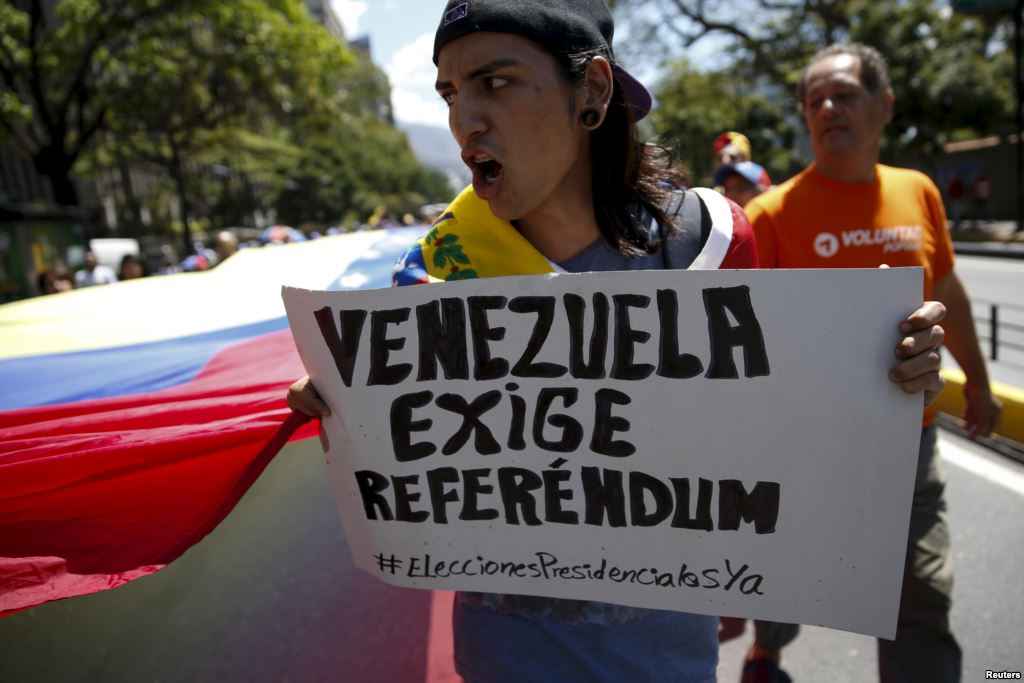
Venezuela Economics and the Referendum
August 18th, 2016By Donna Welles.
(1)
Hugo Chavez has been succeeded by Nikolas Maduro. Hugo Chavez had a public mandate and an organic constituency. Nikolas Maduro worked for Hugo Chavez and then Hugo Chavez died suddenly in 2013. I view Maduro with suspicion and the people of Venezuela likely also view Maduro with suspicion. Either Maduro is culpable in the death of Hugo Chavez or he is not.
Economically since the death of Hugo Chavez there is less food and more foreign military personnel exporting petroleum when the commodities markets make selling energy unwise. Foreign military personnel in Venezuela exporting energy seem unmoved that there is little food in grocery stores. The foreign military personnel likely come from Spain, the Netherlands, and Russia.
England and France are north in the Caribbean Sea and east in French Guinea. Belize still lists the Queen of England as its Head of State but French Guinea does not report much trade data to the World Bank. England once exported dyes to Europe from the Yucatan Peninsula and France has a colonial history in Mexico. The United States fought the Spanish-American War after the explosion on the USS Maine while it was sitting in a Havana harbor.
Elections for the Venezuelan Parliament, the referendum, and audits of treasury money are symptoms of food shortages and energy being removed from South America en masse without adequate compensation. The International Monetary Fund lists energy prices on its website and petroleum and natural gas prices remain low.
Comments Off on Venezuela Economics and the Referendum
Asiatic States of Eastern Europe, Economic Profile
September 24th, 2015By Donna Welles.

Edgar Savisaar
Mayor of Tallinn, Estonia.
Yesterday Tallinn sacked its Mayor, Edgar Savisaar, and arrested him on suspicion of taking bribes. Estonia is not an Indo-European nation, rather it is Asiatic and closely related to Finland and Hungary. Allow us to examine these Asiatic nations in Eastern Europe by way of their social and economic indicators.
Finland has the highest life expectancy of the group, 81 years from birth. Both Estonia and Hungary have lower life expectancies than I would have thought, 76 and 75 years. It is possible the Estonian figure is affected by ethnic Russians left over from the Soviet Era; it is possible the Hungarian figure is affected by ethnic Slavic peoples left over from the Soviet Era. Estonia, Finland, and Hungary all have Western European social behaviors.
Hungary has the largest population of the group, roughly 10m people. Finland’s population as of 2014 was 6m and Estonia’s was 2m. By contrast, France reported 66m, the United Kingdom reported 65m, and Sweden reported 10m.
Finland and Estonia sit better in terms of unemployment than Hungary. Hungary reported an unemployment rate of 10% in 2013; Finland reported 8% and Estonia reported 9%. By contrast, the United Kingdom and Sweden both reported 8% and France reported 10%.
Paris and London are much larger than Budapest, Stockholm, Helsinki, and Tallinn. Each of the latter cities have less than 2m people.
Comments Off on Asiatic States of Eastern Europe, Economic Profile
Economic context, Prime Minister Malcolm Turnbull
September 17th, 2015
By Donna Welles.

A transition of power has taken place this week in Australia as a new Prime Minister has been installed. Allow us to examine Australia’s economy in the greater context of New Zealand and the United Kingdom using the following indicators, (1) GDP, (2) Population, and (3) Unemployment.
Regionally, GDP in Australia expanded to $1.5t USD in 2014 and New Zealand’s to $188b. In 2000, Australia’s GDP was $415b and New Zealand’s was $53b. Populations in both countries grew from 2000 to 2014. Australia’s population was 19.2m; it is now 23.5m. New Zealand’s population was 3.9m; it is now 4.5m. The United Kingdom’s population was 59m; it is now 65m.
Largest City population data in each of these countries has grown in recent years. London now has 10.2m people, whereas in 2000 it had 8.6m. Sydney now has 4.5m people, whereas in 2000 it had 4.0m. Auckland now has 1.3m people, whereas in 2000 it had 1.0m.
Unemployment data in the group has remained low since at least 2000. Australia has reported unemployment data of 5% and 6% from 2000-2012. . The United Kingdom has the highest rate of the group, 8% in 2013. New Zealand’s unemployment rates have been stable throughout that time, 6% in 2000 and 5% in 2012.
Comments Off on Economic context, Prime Minister Malcolm Turnbull
Egypt, Regional Context of Economic Stability
September 10th, 2015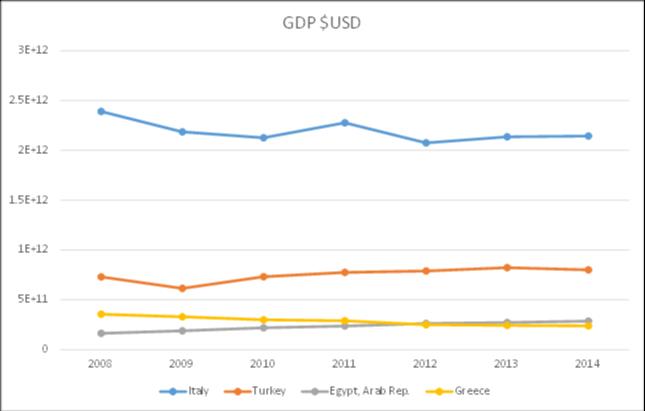
By Donna Welles.
Although currently struggling with unemployment, Egypt has been immune to some of the fluctuations the global economy has experienced since 2008.
Out of a sample of Egypt and its neighbors, only Egypt never experienced a year where its GDP contracted. Rather, Egypt’s economy has expanded every year since 2004. Allow us to examine Egypt in the regional context of Italy, Turkey, Greece, Algeria, Morocco, and Tunisia.
Italy’s is the only economy in the group that includes trillions of dollars. In 2014, Italy’s GDP was $2.1t USD and Turkey’s was $800b. A second tier within the group includes Egypt which reported a GDP of $287b, Greece of $238b, and Algeria of $214b. Finally, Morocco reported a GDP of $107b and Tunisia of $47b.
Italy and Greece had the lowest unemployment figures of the group in 2008, 7% and 8%. Egyptian unemployment was 9% in 2008, Morocco’s was 10%, and both Turkey and Algeria reported unemployment figures of 11%.
By 2013, Greek unemployment had risen to 27%, Egyptian to 13%, and Italian to 12%. By 2013, both Turkish and Algerian unemployment had dropped to 10% while Moroccan unemployment had dropped to 9%.
Egypt’s population in 2014 was 83m people and it is slightly larger than the combined land areas of Texas and Oklahoma.
Comments Off on Egypt, Regional Context of Economic Stability
Relative Unemployment, Czech and Slovak Republics.
September 3rd, 2015
By Donna Welles.
Czech Republic and the Slovak Republic peacefully separated in 1993. Now the Slovak Republic is struggling with unemployment whereas the Czech Republic is not. Allow us to understand these nation states by way of the following economic indicators, (1) Population and Land Area, (2) GDP and Unemployment, (3) Bilateral Trade, and (4) Municipalities and Armed Forces pools.
Czech has roughly twice the population of Slovak Republic. In 2000, Czech had 10.3m people while Slovak had 5.4m. In 2014, Czech had 10.5m people, while Slovak had 5.4m. Czech is 77,230 km^2, which is roughly the size of the State of Maine. Slovak is 48,088 km^2, which is half the size of the State of Kentucky.
Czech has roughly twice the GDP of the Slovak Republic. In 2000, Czech’s GDP was $62b USD while Slovak’s was $29b. Since 2010, Czech’s GDP has contracted from $207b to $206b in 2014. Slovak’s GDP has expanded since 2010 to $100b from $89b. Slovak unemployment rates have been consistently higher than Czech unemployment rates since at least 2005. In 2005, Slovak rates were 16.2% while Czech’s were 7.9%. In 2010, Slovak rates were 14.4% while Czech’s were 7.3%. In 2013, Slovak rates were 14.2% while Czech’s were 7.0%.
Both countries have positive net trade balances. Slovak exports in 2013 totaled $85b while Slovak imports totaled $81b. Czech exports totaled $162b while Czech imports totaled $143b. Germany serves as both nations’ top import partner; including 26% of Czech imports and 16% of Slovak imports. The People’s Republic of China is Czech’s second top import partner while Czech is Slovak’s second top import partner. Germany serves as both nations’ top export partner; including 31% of Czech exports and 21% of Slovak exports. Slovak serves as Czech’s second top export partner while Czech serves as Slovak’s second top export partner.
Prague’s population has grown since 2000 to 1.3m people. Bratislava’s has contracted from 430,000 in 2000 to 406,000 in 2013. Armed Forces pools in both countries have diminished since 1995. Czech had 92,000 soldiers in 1995 while Slovak had 51,000. In 2013, Czech had 24,100 soldiers while Slovak had 15,850.
Comments Off on Relative Unemployment, Czech and Slovak Republics.
Albania, Modern Land of Enver Hoxha
August 27th, 2015
By Donna Welles.

During the twentieth century, southeastern Europe was dominated by three strong dictators; these were Enver Hoxha of Albania, Nicolae Ceaușescu of Romania, and Josip Broz Tito of Yugoslavia. All three men have since died. What has replaced these leaders? Allow us to examine modern Albania by way of its social and economic indicators.
Albania’s armed forces pool has dropped by 90% since 1995. In 1995, Albania had 86,500 soldiers and in 2013 Albania had 8,500 soldiers. Romania has retained 151,300 soldiers. Yugoslavia has been separated politically into six nation-states, including Bosnia, Croatia, Macedonia, Montenegro, Serbia, and Slovenia.
Albania’s GDP has grown from $4 billion in 2000 to $13 billion in 2014. Italy and the People’s Republic of China are Albania’s major trading partners in terms of both imports and exports. Romania’s GDP has grown from $37 billion in 2000 to $199 billion in 2014. Germany and Italy are Romania’s major trading partners in terms of both imports and exports.
Population figures for both Albania and Romania have dropped since 2000. Albania currently has 2.9 million people; Romania has 19.9 million people. In 2000, Albania had 3.1 million and Romania had 22.4 million.
Albania last reported unemployment figures in 2012 when it was 13.4%; Romania reported in 2013 when it was 7.3%. Albania reported an unemployment rate of 22.7% in 2001, 13.5% in 2007, and 14.2% in 2010. Romanian unemployment rates have not risen above their 2002 report which was 8.1%.
Trade balance is an issue for Albania as Albanian exports totaled $2.3 billion in 2013 and imports totaled $4.8 billion. Exports from Albania are largely mineral fuel, clothing apparel, and iron and steel. Imports to Albania include 22% manufactured goods, 18% machinery, 17% mineral fuel, and 13% agricultural products.
Albania’s life expectancy is 78 years and it has a similar land area to that of the State of Maryland.
Comments Off on Albania, Modern Land of Enver Hoxha
The Netherlands, Land Area and GDP.
August 20th, 2015
By Donna Welles.
The Netherlands has roughly the same land area as the State of Virginia; it has roughly the same GDP as the State of Florida. The Netherlands’ GDP is $870billion USD whereas that of the State of Florida is $833billion.
Allow us to examine the Netherlands in terms of the following indicators, (1) trading partners, (2) imports and exports, (3) unemployment, and (4) armed forces personnel totals.
Germany and Belgium are the Netherlands’ major trading partners in terms of both imports and exports. In 2013, Dutch imports totaled $506billion and Dutch exports totaled $571billion. German trade accounted for 17% of Dutch imports and 25% of Dutch exports. Belgian trade accounted for 10% of Dutch imports and 11% of Dutch exports.
The People’s Republic of China accounted for 8% of Dutch imports and 2% of Dutch Exports. The United Kingdom accounted for 7% of Dutch imports and 8% of Dutch exports. Finally, the United States accounted for 7% of Dutch imports and 4% of Dutch exports.
Machinery and Transportation equipment represented 27% of Dutch imports and 25% of Dutch exports in 2013. Mineral Fuel represented 25% of Dutch imports and 20% of Dutch exports; Chemicals, including pharmaceuticals and organic chemicals, represented 13% of Dutch imports and 17% of Dutch exports; and food and live animals represented 9% of Dutch imports and 12% of Dutch exports in 2013.
Unemployment in the Netherlands has risen slightly since 2005; it was 7% in 2013 and 5% in 2005. Total population is 17million, roughly 500,000 more people than in 2005. Armed forces personnel totals have fallen since 2000; 43,000 soldiers in 2013 and 57,000 in 2000.
Comments Off on The Netherlands, Land Area and GDP.
Poland, in the Context of Eastern Europe.
August 13th, 2015By Donna Welles.
Coat of arms Poland
Poland has been a member of NATO since 1999 and a member of the European Union since 2004, although it has not yet joined the Eurozone. Poland’s language is Western Slavic, it of course is related to ancient Sanskrit and it does not use the Cyrillic alphabet. Ukrainian and Belarussian are more closely related to the Russian language than is Polish, as they are Eastern Slavic languages. Allow us to examine Poland’s East-West tendencies by virtue of its economic and social indicators.
Poland has Eastern Europe’s largest pool of armed forces personnel as of 2013, 173,000 soldiers. Belarus has 158,000 soldiers, Romania has 151,000, Ukraine has 122,000, and Bulgaria has 47,000. In 1995, Ukraine had more than half a million soldiers. Poland had 302,000, Romania had 297,000, Bulgaria had 136,000, and Belarus had 106,000.
Poland also has Eastern Europe’s largest economy. In 2014, Poland’s GDP was $548billion, the Czech Republic’s was $205billion, Romania’s was $199billion, Hungary’s was $137billion, and Ukraine’s was $132billion.
Population figures reported by the World Bank show Poland to be the second largest country in Eastern Europe. In 2014, Ukraine had 45million people, Poland had 38million, Romania had 20million, the Czech Republic had 11million, and Hungary had 10million. Of these, only the Czech Republic has seen an increase in population since 2000. Romania’s population has contracted by 11%, Ukraine’s by 8%, Hungary’s by 3%, and Poland’s by 1%.
Poland is halfway down the list per unemployment figures in Eastern Europe. In 2013, 10.3% of Poles were unemployed whereas in Macedonia unemployment was at 29%, in Bosnia at 28%, in Serbia at 22%, in Croatia at 17%, and in the Slovak Republic at 14%.
Germany is Poland’s most dominate trading partner in terms of both imports and exports. In 2014, Polish imports totaled $211billion and Polish exports totaled $209 billion. German trade accounted for 28% of Poland’s imports and 27% of Poland’s exports. British trade accounted for 3% of Poland’s imports and 7% of Poland’s exports. Russian trade accounted for 9% of Poland’s imports and 4% of Poland’s exports. Chinese trade accounted for 7% of Poland’s imports and a negligible amount of Poland’s exports.
Life expectancy in Poland is 77 years; that in Belarus is 72, in Romania is 74, in Ukraine is 71, and in Bulgaria is 74. Poland is the size of the State of Arizona, roughly 300,000 km2.
Comments Off on Poland, in the Context of Eastern Europe.
Unemployment in Ireland, Economic Profile
August 6th, 2015By Donna Welles.
Ireland has an unemployment rate of 13%. Its European neighbors have unemployment rates that dot the spectrum; Norway has 4%, the United Kingdom has 8%, and Spain has 26%. In 2000, Ireland’s unemployment rate was 4%.
Allow us to examine Ireland’s economy in terms of the following indicators, (1) trade balance, (2) trade with the United Kingdom and Germany, and (3) social indicators. In 2014, Ireland’s GDP was $246billion USD, up from $99billion in 2000.
Ireland’s exports greatly exceed its imports. The World Bank’s WITS database reports that 2014 Irish exports totaled $118billion, whereas its imports totaled $71billion. Of the $118billion in exports, 58% is chemicals, 13% is manufactured goods, 11% is machinery, and 10% is food and live animals.
Specifically, pharmaceuticals accounted for $29billion, organic chemicals accounted for $24billion, perfumes and cosmetics accounted for $9billion, and scientific instruments accounted for $6billion. Of the $71billion in imports, 27% is machinery, 21% is chemicals, 13% is manufactured goods, 12% is mineral fuel, and 11% is food and live animals.
External trade with Germany has fluctuated significantly since 2000, although that with the United Kingdom appears stagnant. Irish exports to Germany have decreased by 13% whereas imports from Germany have increased by 98%. Irish exports to the United Kingdom have increased by 16.6% whereas Irish imports from the United Kingdom have increased by 61%.
In terms of social indicators, Ireland’s armed forces personnel totals have dropped to 9,350 servicemen in 2013 from 11,500 in 2000. Dublin has increased in size since 2000 to 1.2million in 2014. Ireland’s total population in 2014 was 4.6million and its life expectancy was 81.
Comments Off on Unemployment in Ireland, Economic Profile
Malaysia, Growth Market for Telecommunications.
July 30th, 2015
By: Donna Welles.
Allow us to examine Malaysia as a potential growth market for telecommunications. In terms of its overall economic landscape, Malaysia has a GDP of $327billion USD and a population of 30million. Indonesia has a GDP of $889billion and a population of 253million. Relative growth rates since 2000 show that Indonesia’s economy has expanded by 438% whereas Malaysia’s has expanded by 249%. Australia’s GDP has expanded 250% since 2000.
Social indicators show that people in Malaysia live to be 75 whereas in Indonesia people live to be 71. Australia’s life expectancy is more in line with that of Western Democracies, 82years. In terms of armed forces personnel totals, Indonesia has by far the largest reserve totaling 677,000, Malaysia has 134,000 soldiers, and Australia has 57,000.
In terms of targeted marketing per the telecommunications sector, Malaysia enjoys an internet connectivity rate of 68% whereas less than 18% of Indonesians have access to the internet. Further, external trade indicators show Malaysia to be home higher quality goods than Indonesia. The countries have roughly the same imports and exports ($USD), although Malaysia’s total GDP $USD is much smaller. In 2014, Malaysian exports totaled $234billion whereas Indonesia’s totaled $176billion. Malaysian imports totaled $209billion whereas Indonesia’s totaled $178billion.
Malaysia’s land area is a fifth the size of Indonesia, less than half a million square kilometers. Malaysia’s capital city is Kuala Lumpur, Indonesia’s is Jakarta, and Australia’s is Canberra.
Comments Off on Malaysia, Growth Market for Telecommunications.
Tajikistan, Regional and Eurasian Context
July 23rd, 2015By Donna Welles.

The Tajik Aluminum Company (TALCO), located in Tursunzoda, Tajikistan
Tajikistan’s population statistics are indicative of a people who move around a lot. Although Total Population and Largest City Population have increased steadily since the Fall of the Soviet Union, there is a noticeable amount of fluctuation in terms of net migration reports. In 2014, Dushanbe had a population of 800,745 and Tajikistan as a whole had a population of 8.4million. Net migration figures are reported to the World Bank every five years and the next one is expected in 2017.
Central Asia’s geographical dimensions can perhaps be understood by Americans in terms of units Alaska. Alaska’s total land area is 1.5million km2 whereas that of Kazakhstan is 2.7million, Turkmenistan is .4million, Uzbekistan is .4million, Kyrgyz Republic is .2million, and Tajikistan is .1million. Central Asia’s climate is largely determined by elevation which increases eastward from the Caspian and Aral Seas.
Kazakhstan has the region’s highest internet connectivity rate as well as its largest GDP, 54% in 2013 and $212billion in 2014. Kazakhstan served as the base of operations for the Soviet Space Program and does so even today as launch pads there continue to rocket Russian satellites into space. Tajikistan’s internet connectivity rate in 2013 was roughly 1 in 4; it’s GDP was $9.2billion in 2014. Tajikistan exports aluminum and imports both chemicals and electric current. Tajik exports in 2000 totaled $692million; imports in 2000 totaled $644million.
Life expectancy figures in the region range between 65.5 years in Turkmenistan and 70.5 years in Kazakhstan. Tajikistan has the region’s smallest armed forces pool, reporting 16,300 soldiers in 2013. Kazakhstan reported 70,500 and Uzbekistan reported 68,000. In the Eurasian context, Lithuania reported 22,000 soldiers in 2013 while Estonia and Latvia reported less than 6,000 soldiers.
Comments Off on Tajikistan, Regional and Eurasian Context
Bulgaria’s Manufacturing Base, Electrical Equipment & Clothing Apparel
July 16th, 2015
By Donna Welles.

Bulgaria’s Foreign Minister, H.E. Daniel Mitov, spoke this week in Washington, DC. Much of the conversation pertained to energy, specifically to natural gas and to Russia’s Gazprom. Allow us, however, to examine the Bulgarian economy in terms of its manufacturing base as well as its trading partners.
Clothing Apparel and Electrical Equipment are Bulgaria’s major manufacturing exports; Copper is Bulgaria’s major export in terms of Non-Ferrous Metals. Notably, Clothing Apparel, Electrical Equipment, and Copper are in demand all over the world and at all times. In 2014, Bulgaria’s exports totaled $29bllion USD. Of that, Non-Ferrous Metals totaled $3billion, Electrical Equipment totaled $2billion, and Clothing Apparel totaled $2billion.
Regionally, Bulgaria is surrounded by enviable buyers such as Hungary, Italy, and Turkey. Romania exports much more to Hungary than Bulgaria exports to Hungary. In 2014, Romanian exports to Hungary totaled $3.5billion while Bulgarian exports to Hungary totaled $395million. Italian and Turkish figures are more similar, however. To Turkey, Bulgaria exported $2.8billion in 2014. To Italy, Bulgaria exported $2.6billion in 2014. Romania exported $3.5billion and $8.2billion. Arguably, there is room for growth in terms of Bulgarian exports to each of these regional buyers.
On the whole, both Bulgaria’s and Romania’s economies have expanded since 2010. Bulgaria’s to $56billion from $48billion and Romania’s to $199billion from $165billion. Population figures for both countries are in decline, however, resulting from both low fertility rates as well as net outflow of migration. Also, unemployment rates for both countries are concerning.
Bulgaria’s were up to 12.9% in 2013 from 10.2% in 2010. Romania’s were a little lower, 7.3% in both years. Literacy rates in both countries are steady at 98.5% and life expectancy rates for both countries are 74.5 years.
July 16, 2015
Comments Off on Bulgaria’s Manufacturing Base, Electrical Equipment & Clothing Apparel
Spain, Norway, Disparity in Unemployment Rates
July 9th, 2015By Donna Welles.

Ancient seafaring nations, Norway and Spain occupy opposite ends of the spectrum in terms of modern Unemployment Rates. In 2014, Norway’s unemployment rate was 3.5% whereas that of Spain was 26.1%. Norway is endowed with natural resources including fossil fuels and fishing reserves. Spain still trades with South America and currently holds a seat on the UN Security Council. Allow us to examine these two economies using the following indicators, (1) Population, (2) GDP, (3) Military Personnel, (4) Fertility Rates, (5) Bilateral Trade, and (6) External Trade by Product. Are we able to understand the disparity in 2014 Unemployment Rates?
Spain’s population is nine times that of Norway, 46million and 5million. Spain’s GDP is less than three times that of Norway. In 2000, the relative GDPs were $595billion and $171billion. In 2010, the relative GDPs were $1.43trillion and $429billion. Spain’s economy has since contracted to $1.40trillion while Norway’s has expanded to $500billion. What has happened since 2010 so that Spain’s economy has contracted while Norway’s has expanded?
Spain has a sizable pool in terms of Armed Forces Personnel, according to the World Bank’s World Development Indicators Databank. Figures for both nations have declined since 2000, dropping from 241,800 and 27,000 in 2000, 220,000 and 47,000 in 2005, 223,216 and 24,450 in 2010, to 213,950 and 25,800 in 2013. Fertility rates in both nations are low. Spain’s in 2013 was 1.3births for every woman and Norway’s was 1.9. Norway’s was exactly 1.9 in 2000 as well, whereas Spain’s has risen slightly from 1.2.
In terms of external trade and in particular exports, Norway exports predominantly to the United Kingdom whereas Spain exports predominantly to France. In 2014, 23% of Norway’s exports were purchased by the United Kingdom and 6% were purchased by France. The same year, 16% of Spain’s exports were purchased by France and 7% were purchased by the United Kingdom. Norway exported to the United States more than they did to China; to China more than they did Spain; and to Spain more than they did to Russia. Spain exported to the United States more than they did to China; and to China more than they did to Russia.
Finally, 64% of Norway’s exports as listed by the World Bank are categorized as Mineral Fuel while 9.5% are categorized as Machinery/Transportation Equipment. Other leading exports for Norway include Food/Live Animals as well as Manufactured Goods. Spain’s exports are more evenly distributed, 32% are categorized as Machinery/Transportation Equipment, 16% as Manufactured Goods, 13% as Chemicals, and 12% as Food/Live Animals.
Spain’s is not the only European economy to have contracted since 2007 but its Unemployment Rates are by far the worst among its cohort.
Comments Off on Spain, Norway, Disparity in Unemployment Rates
Iceland and the United Kingdom, Joint Economic Indicators
July 2nd, 2015
By Donna Wells.
Iceland’s Foreign Minister, Gunnar Bragi Sveinsson, visited the United States this week. Allow us to examine Iceland’s economy in terms of both its overall health as well as its bilateral trading partners.
Although Iceland’s population has grown since 2007, its economy has contracted. The United Kingdom has experienced a similar contraction, although of a smaller magnitude. Both economies have grown overall since 2000. By contrast, Norway, Sweden, Finland, and the Netherlands have experienced economic growth since 2007.
Since 2000, Iceland’s economy expanded 91% to $17billion in 2014. The United Kingdom’s economy expanded 90% to $2.9trillion in 2014. Since 2007, Iceland’s economy has contracted by 20% whereas the United Kingdom’s economy has contracted by 1%. Norway, Sweden, Finland, & the Netherlands grew by 25%, 17%, 6%, and 4% since 2007.
Populations in each of these nations have grown since both 2000 and 2007. Iceland’s population grew 5.1% from 2007 to 327,589 in 2014. The United Kingdom’s population grew 5.2% to 65million.
Bilateral Trade with Iceland exists is two tiers. The United Kingdom and the United States are major trading partners. Total Trade between Iceland and the United Kingdom in 2014 was $890million; Total Trade between Iceland and the United States was $790million.
A second tier By: Donna Wellesof trading partners exists in the People’s Republic of China, France, and the Russian Federation. China traded with Iceland $439million in 2014, France traded $385million in 2014, and Russia traded $249million in 2014. In 2000, China traded $59million, France traded $184million, and Russia traded $54million.

Comments Off on Iceland and the United Kingdom, Joint Economic Indicators
Ethiopia, Literacy per Unemployment Rates
June 26th, 2015
By Donna Welles.
Geopolitical analysis of Ethiopia is currently highlighting both the elections that took place this week as well as Ethiopia’s economic growth. Elections there were peaceful, although what has emerged is akin to a one-party system. Allow us to examine Ethiopia’s economic identity using the following indicators, (1) Overall Economic Growth, (2) Bilateral Trading Partners, (3) Unemployment Rates, and (4) Literacy Rates. Although Ethiopia’s population and GDP have grown dramatically in recent decades, Literacy Rates remain a cause for concern.
In terms of both Population and GDP, analysts are correct in that Ethiopia’s economy has grown dramatically relative to other ancient African nations. In 2000, both Egypt and Ethiopia reported a population of 66 million. By 2013, Egypt’s population had grown 24% to 82 million and Ethiopia’s had grown 42% to 94 million. Lower growth in population rates were seen in Morocco and Turkey, 14% and 19% respectively.
Ethiopia’s GDP grew from $8.2billion USD in 2000 to $47.5billion 2013. This is a 476% expansion. During the same time period, Egypt’s economy grew by 172%, Morocco’s by 181%, and Turkey’s by 208%. Ethiopia’s remains the smallest economy of that group, and the only one to double twice.
Bilateral Trade data indicates that the People’s Republic of China is Ethiopia’s largest trading partner, $3.4 billion USD in 2014. The United States traded $1.9 billion in 2014. A second tier of trading partners can be found in the United Kingdom, France, and the Russian Federation. In 2013, the United Kingdom traded with Ethiopia $211 million USD while the Russian Federation traded with Ethiopia $69 million. In 2014, France traded with Ethiopia $189 million USD according to the World Bank.
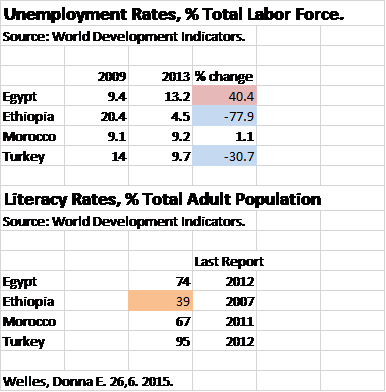
Since 2009, Unemployment Rates in Ethiopia have improved dramatically. In 2009, 20.4% of Ethiopia’s Total Labor Force was unemployed. In 2013, that number dropped to 4.5%. Unemployment Rates stagnated in Morocco, 9.1% in 2009 and 9.2% in 2013. In Egypt, Unemployment Rates have worsened since 2009 when 9.4% of the Total Labor Force was Unemployed. By 2013, the number was 13.2%.
Literacy Rates in Ethiopia are cause for concern. According to the World Development Indicators Databank, the last time Ethiopia reported Literacy Rates was in 2007 when only 39% of the Total Adult Population could read. Compared to other ancient African nations, Morocco reported in 2011 that 67% of adults there could read, Egypt reported in 2012 that 74% of adults could read, and Turkey reported in 2012 that 95% of adults could read. From the perspective of the New World, 69% of Guatemalans can read whereas 93% of adults can read in Ecuador.
Comments Off on Ethiopia, Literacy per Unemployment Rates
Zimbabwe, Armed Forces and Inflation
June 22nd, 2015By Donna Welles.

Zimbabwe enjoys high literacy rates and a dynamic music and comedy scene. It has colonial roots in the United Kingdom; Cecil Rhodes harvested diamonds there. In modern times, the People’s Republic of China has invested in Zimbabwe’s energy sector. Allow us to examine this South African nation from two perspectives, that of its armed forces and that of its currency.
Fifteen nations in Sub-Saharan Africa employ more than 25,000 Armed Forces Personnel. Zimbabwe is one of three South African nations included in this group. Angola employs 117,000 troops, South Africa employs 77,150 troops, and Zimbabwe employs 50,800 as of 2013. Notably, eight of the fifteen are located in East Africa. This includes two of the top three, Eritrea and South Sudan. Eritrea employs 201,750 troops and South Sudan employs 185,000. Sudan, located in North Africa, has Sub-Saharan Africa’s largest Armed Forces pool at 264,300.
Zimbabwe’s currency today is what has attracted the global media. From 2000-2014, Sub-Saharan nations with the most radical deviation from the $USD are Zimbabwe, Democratic Republic of Congo, Angola, Malawi, and Guinea. Zimbabwe’s inflation rating is inestimable, while the other four are tangible figures. Democratic Republic of Congo has deviated from the $USD by 4,138%, Angola by 879%, Malawi by 673%, and Guinea by 301%.
Nigeria, Africa’s largest nation, deviated from the $USD during the same timeframe by 56%. Nations who utilize the Central African Franc as well as the West African Franc deviated from the $USD by -31%. In the global context, Japan’s Yen deviated from the $USD by -2% while the Euro by -31%.
Comments Off on Zimbabwe, Armed Forces and Inflation
Ecuador, Economic Profile 2015
June 12th, 2015
By Donna Welles.

Ecuador is the only country in South America to use the $USD as its national currency. Ecuador has also experienced the most dramatic growth in GDP since 2000, 415% GDP growth. Allow us to examine Ecuador’s economy using the following indicators, (1) Trading Partners, (2) Total Trade between the People’s Republic of China and the United States, (3) Net Migration, and (4) Vulnerability Indicators.
Trading Partners take two forms, South American neighbors and Imperial powers from abroad. Arguably, the United States is both of these in that it is located in the North American continent. From 1990-2014, the United States and the People’s Republic of China were Ecuador’s top trading partners.
Ecuador’s top five trading partners for the years 1990 and 2014 are as follows,
1990: United States, PRC, Japan, Germany, Peru.
2014: United States, PRC, Colombia, Chile, Peru.
Ecuador’s trading partners ranked sixth through tenth for the years 1990 and 2014 are as follows,
1990: Panama, Brazil, Italy, Spain, Chile.
2014: Panama, Mexico, Japan, Germany, Spain.
These lists show that Germany and Japan dropped out of the top five over the past quarter century and they were replaced with South American neighbors, Colombia and Chile.
Other Imperial notables include Spain, the Netherlands, and the United Kingdom. While Spain and the Netherlands remained in the top fifteen in both 1990 and 2014, the United Kingdom dropped from fourteenth to twentieth.
Today, three countries in South America trade more with the People’s Republic of China than they do with the United States; these are Brazil, Chile, and Uruguay. Ecuador’s Total Trade with the United States greatly exceeds that with the People’s Republic of China. According to the World Bank, Ecuador’s combined Imports and Exports to the People’s Republic of China in 2014 totaled $4.3 billion in 2014, whereas those to the United States totaled $19 billion.
Other South American countries trade similarly with the United States and the PRC. Specifically, Peru’s Total Trade with the United States is $15.3 billion and with the PRC is $14.2 billion. Argentina’s Total Trade with the United States is $14 billion and with the PRC is $12.9 billion.
Fewer people are leaving Ecuador, but the World Bank still reports a negative net migration figure as of 2012. In 2002, the figure was -43,463. In 2007, the figure was -46,470. And, in 2012, the figure was -30,000 people.
Only Chile and Venezuela have positive net migration figures in the South American continent. Ecuador’s numbers are similar to that of Guyana and Uruguay. Guyana’s figure has stayed steady since 2002 whereas fewer people are leaving Uruguay.
If a country’s Imports figure grows too quickly, it is vulnerable to debt. Ecuador’s Imports doubled three times since 1990, although its GDP doubled twice; therefore it is vulnerable to debt. Argentina also doubled its Imports three times in that timeframe but its GDP only doubled twice. Peru doubled both its Exports and Imports three times but its GDP only doubled twice. Finally, Bolivia doubled its Exports three times, but its GDP only doubled twice. Only Suriname doubled its GDP three times between 1990 and 2013 as reported by the World Bank.
Comments Off on Ecuador, Economic Profile 2015
Food Shortages in Venezuela, In Context
June 4th, 2015
By Donna Welles.

Food shortages in Venezuela were reported this week and consumers are said to be faced with limited options when buying groceries or consumer durables.
Oil production has risen in order to account for the drop in oil prices, and as such measures have been taken to increase capacity in Venezuela’s distribution network. Russia has interceded with liquid as well as human capital.
Leopoldo Lopez, a Harvard-educated political reformer, began a hunger strike and called for Venezuelans across the country to march peacefully through the streets. On May 31, several thousand people successfully turned out to protest the internment of political prisoners.
Venezuela’s economy has shifted away from the $USD in recent decades. Although its GDP and population have grown roughly alongside that of other South American countries, its currency has devalued by almost 800%. In 2000, the exchange rate of Bolivars:USD was .7:1. In 2013, the ratio climbed to 6:1.
Venezuela is a member of OPEC and it is South America’s fifth biggest economy.
Comments Off on Food Shortages in Venezuela, In Context